Practice the problems of Math in Focus Grade 8 Workbook Answer Key Chapter 7 Lesson 7.2 Understanding the Distance Formula to score better marks in the exam.
Math in Focus Grade 7 Course 3 B Chapter 7 Lesson 7.2 Answer Key Understanding the Distance Formula
Math in Focus Grade 8 Chapter 7 Lesson 7.2 Guided Practice Answer Key
Solve.
Question 1.
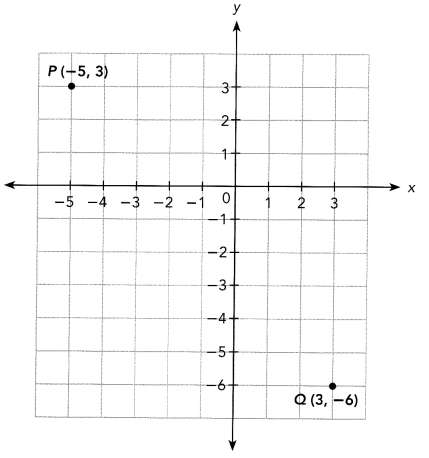
Points P (-5, 3) and Q (3, -6) are plotted on a coordinate plane. Find the distance between points P and Q. Find both the exact value and an approximate value. Round your answer to the nearest tenth.
So, the distance between points P and Q is exactly  units and approximately units.
Answer:
The task is to determine the distance between the points P and Q. compute for the exact vaLue, and then calculate the approximate value.
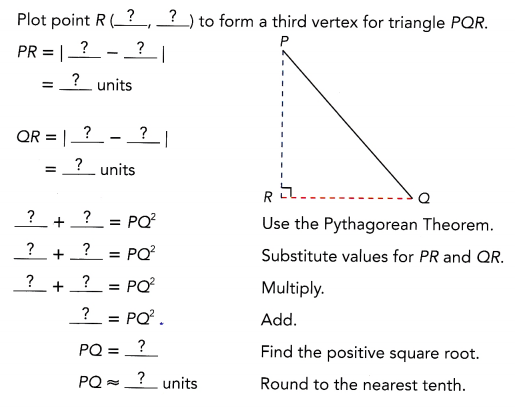
Note that P is on point (-5, 3) and Q is on point (3, -6), to determine the third vertex R, make a right triangle where Line P and line Q will meet Notice that the vertex wilL be either on (-5, -6) or (3, 3). Say, the third vertex is (-5, -6), then to find the lengths of side \(\overline{P R}\) and \(\overline{Q R}\), determine the absolute value of the y-coordinates of point P and point R, and point Q and point R.
PR = |3 – (-6)|
= |9|
= 9 units
\(\overline{Q R}\) = |3 – (-5)|
= |8|
= 8 units
Apply the Pythagorean Theorem which states that the sum of the squares of the two legs of a right triangle is equal to the square of the hypotenuse. Note that \(\overline{P R}\) and \(\overline{Q R}\) are the legs of the triangle ∆PQR and Let \(\overline{P Q}\) be the hypotenuse.
PR2 + QR2 = \(\overline{P Q}^{2}\) Apply Pythagorean Theorem.
92 + 82 = \(\overline{P Q}^{2}\) Substitution.
81 + 64 = \(\overline{P Q}^{2}\) Evaluate the Squares.
145 = \(\overline{P Q}^{2}\) Add.
\(\sqrt{145}=\sqrt{\overline{P Q}^{2}}\) Use Square Root Property.
\(\overline{P Q}\) ≈ 12 Simplify.
Therefore, point P is exactly \(\sqrt{145}\) units away from point Q or around 12 units.
Solve.
Question 2.
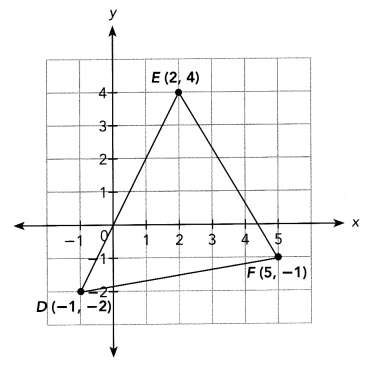
Mrs. Smith gives the class the coordinates D (-1, -2), E (2, 4), and F (5, -1) and asks them to join the three points to form triangle DEF.
a) Find the length of \(\overline{\mathrm{DE}}\), \(\overline{\mathrm{EF}}\), and \(\overline{\mathrm{DF}}\).
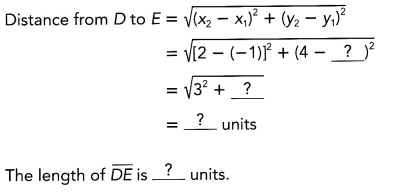
First find the length of \(\overline{\mathrm{DE}}\).
Let D (-1, -2) be (x1, y1) and E(2, 4) be (x2, y2).
Answer:
The goal of this task is to analyze the graph of ∆DEF where the coordinates of points D, E, and F are (-1, -2), (2, 4), and (5, -1) respectively then
a. Determine the Length of Line \(\overline{D E}\), \(\overline{E F}\) and \(\overline{D F}\), and
b. Verify if ∆DEF is an isosceles triangle
a) The length of the sides of the triangle can be obtained by applying the distance formula which is the formula used in determining the distance between two points. For the measure of \(\overline{D E}\), let D(-1, -2) be (x1, y1) and E(2, 4) be (x2, y2).
\(\overline{D E}\) = \(\sqrt{\left(x_{2}-x_{1}\right)+\left(y_{2}-y_{1}\right)}\) Formula.
= \(\sqrt{(2-(-1))^{2}+(4-(-2))^{2}}\) Substitution.
= \(\sqrt{3^{2}+6^{2}}\) Subtract.
= \(\sqrt{9+36}\) Multiply.
= \(\sqrt{45}\) Add.
≈ 6.7 Simplify
Therefore, measures exactly \(\sqrt{45}\) units or approximately 6.7 units.
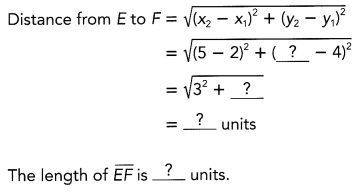
Next find the length of \(\overline{\mathrm{EF}}\)
Let E (2, 4) be (x1, y1) and F(5, -1) be (x2, y2).
Answer:
Next, the length of \(\overline{E F}\) can be obtained by applying the distance formula which is the formula used in determining the distance between two points Forthe measure of \(\overline{E F}\), let E (2, 4) be (x1, y1) and F(5, -1) be (x2, y2)
\(\overline{E F}\) = \(\sqrt{\left(x_{2}-x_{1}\right)+\left(y_{2}-y_{1}\right)}\) Formula.
= \(\sqrt{(5-2)^{2}+(5-4)^{2}}\) Substitution.
= \(\sqrt{3^{2}+1^{2}}\) Subtract.
= \(\sqrt{9+1}\) Multiply.
= \(\sqrt{10}\) Add.
≈ 3.2 Simplify
Therefore, \(\overline{E F}\) measures exactly \(\sqrt{10}\) units or approximately 3.2 units.
If two of the three sides of a triangle are of the same length, the triangle is an isosceles triangle.

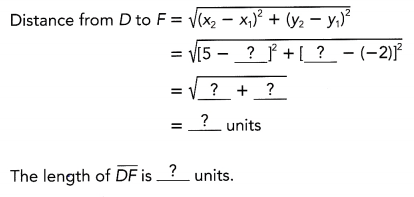
Then find the length of \(\overline{\mathrm{DF}}\).
Let D (-1, -2) be (x1, y1) and F(5, -1) be (x2, y2).
Answer:
Lastly, the length of \(\overline{D F}\) can be obtained by applying the distance formula which is the formula used in determining the distance between two points For the measure of \(\overline{D E}\), let D(-1, -2) be (x1, y1) and F(5, -1) be (x2, y2).
\(\overline{D F}\) = \(\sqrt{\left(x_{2}-x_{1}\right)+\left(y_{2}-y_{1}\right)}\) Formula.
= \(\sqrt{(5-(-1))^{2}+((-1)-(-2))^{2}}\) Substitution.
= \(\sqrt{6^{2}+1^{2}}\) Subtract.
= \(\sqrt{36+1}\) Multiply.
= \(\sqrt{37}\) Add.
≈ 6.1 Simplify
Therefore, \(\overline{D F}\) measures exactly \(\sqrt{37}\) units or approximateLy 6.1 units.
b) Is triangle DEF an isosceles triangle? Explain.
Because  , triangle DEF is .
Answer:
Note that an isosceles triangle is a triangle whose 2 sides are equal. Since no two sides have the same length, the triangle is not an isosceles triangle.
Solve
Question 3.
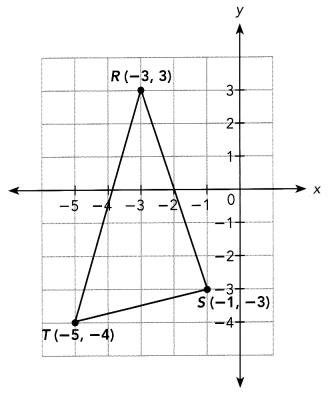
Mr. Jacobs gives his students the coordinates R (-3, 3), S(-1, -3), and T(-5, -4) and asks them to join the three points to form triangle RST.
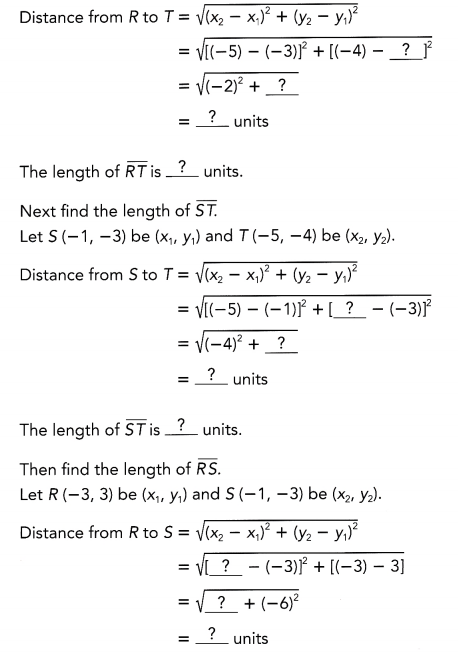
a) Find the lengths of \(\overline{R T}\), \(\overline{S T}\) and \(\overline{R S}\).
First find the length of \(\overline{R T}\).
Let R (-3, 3) be (x1, y1) and T(-5, -4) be (x2, y2).
The length of \(\overline{R S}\) is  units.
Answer:
The task is to analyze the graph of ∆RST where the coordinates of points R, S, and T are (-3, 3), (-1, -2), and (-5, -4) respectively then complete the solution to a. Determine the Length of Line \(\overline{R T}\), \(\overline{S T}\) and \(\overline{R S}\), and b. Verify if ∆DEF is an isosceles triangle.
a) The length of the sides of the triangle can be obtained by applying the distance formula which is the formula used in determining the distance between two points. For the measure of \(\overline{R T}\) substitute R(-3, 3) to (x1, y1) while T(-5, -4) to (x2, y2). Then,
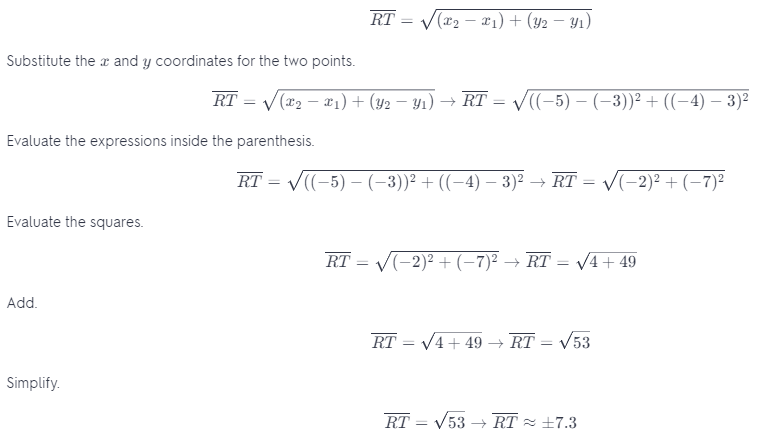
Since there is no negative magnitude(distance), take only the positive vaLue in ±7.3. Therefore, \(\overline{R T}\) is around 7.3 units.
Next, to determine the Length of \(\overline{S T}\), substitute S(-1, -2) to (x1, y1) whiLe T(-5, -4) to (x2, y2). Then, applying the distance formula,
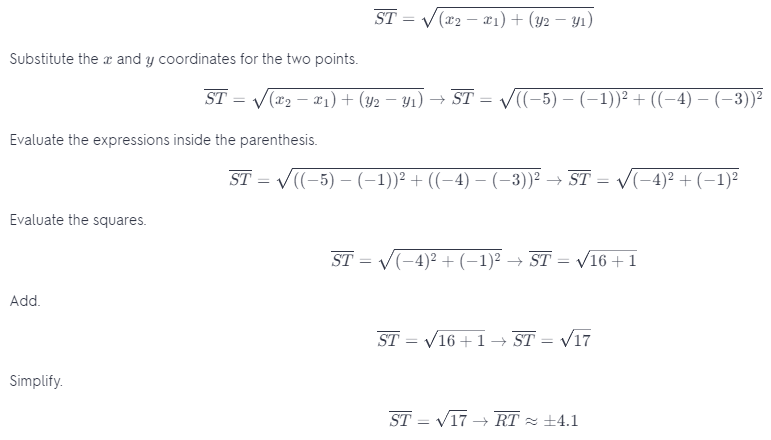
Since there is no negative magnitude(distance), take only the positive value in ±4.1 Therefore, \(\overline{S T}\) is approximately 4.1 units.
Lastly, to determine the length of \(\overline{R S}\), substitute R(-3, 3) to (x1, y1) while T(-1, -2) to (x2, y2). Then, applying the distance formula,
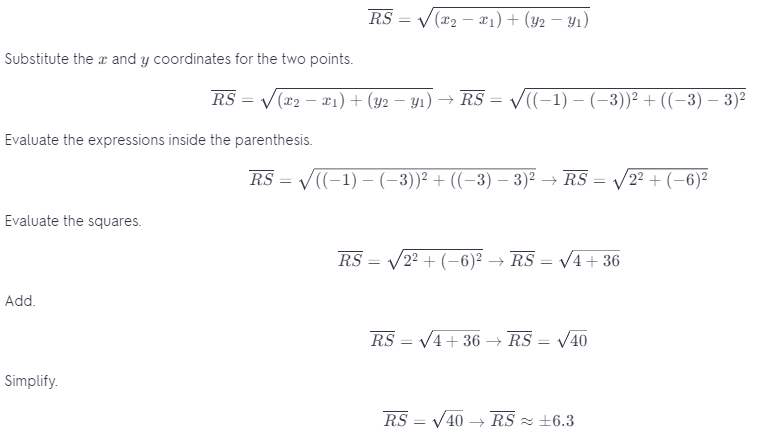
Since there is no negative magnitude(distance), take only the positive value in ±6.3. Therefore, \(\overline{R S}\) is approximately 6.3 units.
b) Is triangle RST an isosceles triangle? Explain.
Because , triangle RST is .
Answer:
Note that an isosceles triangle is a triangle whose 2 sides are equal. Since no two sides have the same length, the triangle is not an isosceles triangle.
Math in Focus Course 3B Practice 7.2 Answer Key
For this practice, you may use a calculator. Round your answers to the nearest tenth if necessary.
Question 1.
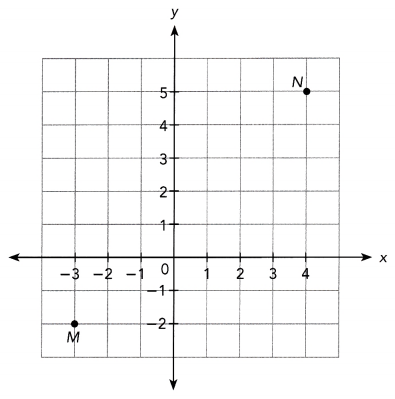
Points M (-3, -2) and N (4, 5) are plotted on a coordinate plane. Find the exact distance between points M and N.
Answer:
The goal of this task is to give the exact distance of point M to point N if M has a coordinates (-3, -2) and N is on point (4, 5).
First identify the third vertex forming a right triangle where \(\overline{M N}\) is the hypotenuse. Say Point P is the Last vertex and it is on the point (-3, 5) then find the Lengths of \(\overline{P M}\)and \(\overline{P N}\)
\(\overline{P M}\) = |5 – (-2)|
= 7 units
\(\overline{P N}\) = |-3 – 4|
= 7 units
Apply the Pythagorean Theorem which states that the square of the hypotenuse of a right triangle is equal to the sum of the squares of the two sides then
\(\overline{P M}^{2}+\overline{P N}^{2}=\overline{M N}^{2}\) Use the Pythagorean Theorem.
72 + 72 = \(\overline{M N}^{2}\) Substitute values for \(\overline{P M}\) and \(\overline{P N}\)
49 + 49 = \(\overline{M N}^{2}\) Multiply
98 = \(\overline{M N}^{2}\) Add.
\(\overline{M N}\) = \(\sqrt{98}\) Find the positive square root.
\(\overline{M N}\) ≈ 9.9 units Round to the nearest tenth.
Therefore, the exact distance of point M to point N is \(\sqrt{98}\).
Question 2.
Find the distance between each pair of points. Which pair of points are the greatest distance apart?
a) A(1, 4), B(6, 6)
Answer:
To find the distance of two points, use the distance formula which is the formula used in determining the distance between two points. Then, let A(1, 4) be (x1, y1) while B(6, 6) be (x2, y1) and g be the distance of A to B.
g = \(\sqrt{\left(x_{2}-x_{1}\right)^{2}+\left(y_{2}-y_{1}\right)^{2}}\) Distance Formula.
= \(\sqrt{(6-1)^{2}+(6-4)^{2}}\) Substitution.
= \(\sqrt{5^{2}+2^{2}}\) Subtract.
= \(\sqrt{25+4}\) Evaluate the squares.
= \(\sqrt{29}\) Add.
≈ ±5.4 Evaluate.
Note that there is no negative magnitude (distance), thus take only the positive value of g. Therefore, A is 5.4 units away from B.
b) C(-4, 7), D(3, 2)
Answer:
Apply the distance formula then let C(-4, 7) be (x1, y1) while D(3, 2) be (x2, y2) and h be the distance of C to D.
h = \(\sqrt{\left(x_{2}-x_{1}\right)^{2}+\left(y_{2}-y_{1}\right)^{2}}\) Distance Formula.
= \(\sqrt{(3-(-4))^{2}+(2-7)^{2}}\) Substitution.
= \(\sqrt{7^{2}+(-5)^{2}}\) Subtract.
= \(\sqrt{49+25}\) Evaluate the squares.
= \(\sqrt{74}\) Add.
≈ ±8.6 Evaluate.
Since there is no negative magnitude(distance), take only the positive value of h. Therefore, the distance of C to D is 8.6 units.
c) L(2, -5), N(-3, -1)
Answer:
Use the distance formuLa then let L(2, -5) be (x1, y1) while N(-3, -1) be (x2, y2) and o be the distance of L to N.
o = \(\sqrt{\left(x_{2}-x_{1}\right)^{2}+\left(y_{2}-y_{1}\right)^{2}}\) Distance Formula.
= \(\sqrt{((-3)-2)^{2}+((-1)-(-5))^{2}}\) Substitution.
= \(\sqrt{(-5)^{2}+4^{2}}\) Subtract.
= \(\sqrt{25+16}\) Evaluate the squares.
= \(\sqrt{41}\) Add.
≈ ±6.4 Evaluate.
No magnitude(distance) is negative so take only the positive value of o. Therefore, L is 6.4 units away from N.
d) Y(-6, -4), Z(0, 5)
Answer:
Let Y(-6, -4) be (x1, y1) white Z(0. 5) be (x2, y2) and p be the distance of Y to Z then apply the distance formula.
p = \(\sqrt{\left(x_{2}-x_{1}\right)^{2}+\left(y_{2}-y_{1}\right)^{2}}\) Distance Formula.
= \(\sqrt{(0-(-6))^{2}+(5-(-4))^{2}}\) Substitution.
= \(\sqrt{6^{2}+9^{2}}\) Subtract.
= \(\sqrt{36+81}\) Evaluate the squares.
= \(\sqrt{117}\) Add.
≈ ±10.8 Evaluate.
Take only the positive value of p since there is no negative magnitude(distance). Therefore, Y is 10.8 units away from Z.
Question 3.
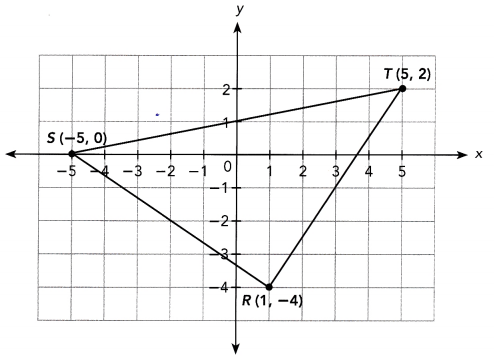
Zack plots the points R(1, -4), S(-5, 0), and T(5, 2) on a coordinate plane. He joins the three points to form triangle RST. Is the triangle an isosceles triangle? Explain.
Answer:
The target of this task is to verify if ∆RST is an isosceles triangle when points R, S, and T have coordinates (1, -4), (-5, 0) and (5, 2) respectively.
An isosce[es triangLe is a triangle where two of its sides are equal. Calculate the length of \(\overline{R S}\), \(\overline{S T}\), and \(\overline{R T}\) to determine if there exist two sides that are equal by applying the distance formula which is the formula used in determining the distance between two points. For \(\overline{R S}\) let R(1, -4) be (x1, y1) while S(-5, 0) be (x2, y2) and n be the distance of R to S.
n = \(\sqrt{\left(x_{2}-x_{1}\right)^{2}+\left(y_{2}-y_{1}\right)^{2}}\) Distance Formula.
= \(\sqrt{((-5)-1)^{2}+(0-(-4))^{2}}\) Substitution.
= \(\sqrt{(-6)^{2}+(-4)^{2}}\) Subtract.
= \(\sqrt{36+16}\) Evaluate the squares.
= \(\sqrt{52}\) Add.
≈ ±7.2 Evaluate.
Note that there is no negative magnitude(distance), thus take only the positive value of n. Therefore, R is 7.2 units away from S.
For \(\overline{S T}\) let S(-5, 0) be (x1, y1) while T(5, 2) be (x2, y2) and a be the distance of S to T.
a = \(\sqrt{\left(x_{2}-x_{1}\right)^{2}+\left(y_{2}-y_{1}\right)^{2}}\) Distance Formula.
= \(\sqrt{(5-(-5))^{2}+(2-0)^{2}}\) Substitution.
= \(\sqrt{10^{2}+2^{2}}\) Subtract.
= \(\sqrt{100+4}\) Evaluate the squares.
= \(\sqrt{104}\) Add.
≈ ±10.2 Evaluate.
Since there is no negative magnitude(distance), take only the positive value of a. Therefore, the distance of S to T is 10.2 units.
Then for \(\overline{R T}\) let R(1, -4) be (x1, y1) whiLe T(5, 2) be (x2, y2) and k be the distance of Sto T.
k = \(\sqrt{\left(x_{2}-x_{1}\right)^{2}+\left(y_{2}-y_{1}\right)^{2}}\) Distance Formula.
= \(\sqrt{(5-1)^{2}+(2-(-4))^{2}}\) Substitution.
= \(\sqrt{4^{2}+6^{2}}\) Subtract.
= \(\sqrt{16+36}\) Evaluate the squares.
= \(\sqrt{52}\) Add.
≈ ±7.2 Evaluate.
No magnitude(distance) is negative so take only the positive value of k. Therefore, R is 7.2 units away from T.
Notice that \(\overline{R S}\) is 7.2 units, \(\overline{S T}\) is 10.2 units and \(\overline{R T}\) is also 7.2 units. Two sides of ∆RST is equal which is a property of an isosceles triangle. Therefore the triangle is an isosceles triangle.
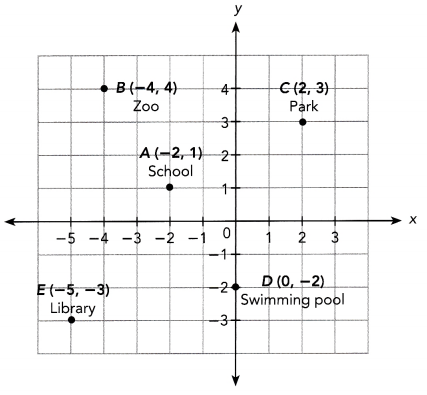
Use the data in the diagram for questions 4 to 6. Each unit on the grid equals 1 kilometer.
Question 4.
Find the approximate distance from the school to each of the following locations.
a) Zoo
b) Park
c) Swimming pool
d) Library
Answer:
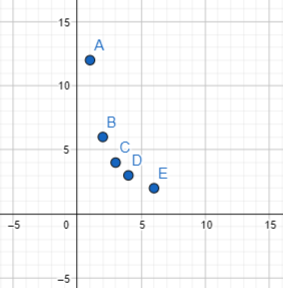
The goal is to determine the estimated distance of school at point A(-2, 1) to the a. Zoo at B(-4, 4), b. Park at C(2, 3), c. Swimming Pool at D(0, -2), and d. Library at E(-5, -3). Note that every unit is equal to 1 kilometer.
a) Calculate for the distance two points A and B to determine the distance of the school and the zoo. Apply the distance formula which is the formula used in determining the distance between two points. Let e be the distance of A to B, and A(-2, 1) be (x1, y1) while B(-4, 4) be (x2, y2).
e = \(\sqrt{\left(x_{2}-x_{1}\right)^{2}+\left(y_{2}-y_{1}\right)^{2}}\) Distance Formula.
= \(\sqrt{((-4)-(-2))^{2}+(4-1)^{2}}\) Substitution.
= \(\sqrt{(-2)^{2}+(3)^{2}}\) Subtract.
= \(\sqrt{4+9}\) Evaluate the squares.
= \(\sqrt{13}\) Add.
≈ ±3.6 Evaluate.
Because that there is no negative magnitude(distance), take only the positive value of e. Therefore, the zoo is around 3.6 kilometers away from the school.
b) Compute for the distance of points A and C to know the distance of school to park by applying the distance formula describe in (a). Then Let f be the distance of A to C, and A(-2, 1)) be (x1, y1) whiLe C(2, 3) be (x2, y2).
f = \(\sqrt{\left(x_{2}-x_{1}\right)^{2}+\left(y_{2}-y_{1}\right)^{2}}\) Distance Formula.
= \(\sqrt{(2-(-2))^{2}+(3-1)^{2}}\) Substitution.
= \(\sqrt{4^{2}+2^{2}}\) Subtract.
= \(\sqrt{16+4}\) Evaluate the squares.
= \(\sqrt{20}\) Add.
≈ ±4.5 Evaluate.
Since there is no negative magnitude(distance), take only the positive value of f. Therefore, the distance of school to the park is approximately 4.5 kiLometers.
c) Solve for the distance of two points A and D to identify the distance of the school and the swimming pool using the distance formula as mentioned above. Next, Let g be the distance of A to D, and A(-2, 1)) be (x1, y1) while D(0, -2) be (x2, y2).
g = \(\sqrt{\left(x_{2}-x_{1}\right)^{2}+\left(y_{2}-y_{1}\right)^{2}}\) Distance Formula.
= \(\sqrt{(0-(-2))^{2}+((-2)-1)^{2}}\) Substitution.
= \(\sqrt{2^{2}+(-3)^{2}}\) Subtract.
= \(\sqrt{4+9}\) Evaluate the squares.
= \(\sqrt{13}\) Add.
≈ ±3.6 Evaluate.
No magnitude(distance) is negative thus take only the positive value of g. Therefore, the swimming pool is around 3.6 kilometers away from the school.
d) Calculate for the distance of point A and point E to determine the distance ci me school and the library by applying the distance formula Let h be the distance of A to E, and A(-2, 1)) be (x1, y1) while E(-5, -3) be (x2, y2).
h = \(\sqrt{\left(x_{2}-x_{1}\right)^{2}+\left(y_{2}-y_{1}\right)^{2}}\) Distance Formula.
= \(\sqrt{((-5)-(-2))^{2}+((-3)-1)^{2}}\) Substitution.
= \(\sqrt{(-3)^{2}+(-4)^{2}}\) Subtract.
= \(\sqrt{9+16}\) Evaluate the squares.
= \(\sqrt{25}\) Add.
≈ ±5 Evaluate.
There is no negative magnitude(distance) so take only the positive value of h. Therefore, the library is 5 kilometers away from the school.
Question 5.
Which two locations are the same distance from the school?
Answer:
The objective of this task is to determine the locations that are equal in distance from the school.
Note that by applying the distance formula which is the formula used in determining the distance between two points. The distance of A(school) to B(park) is computed by substituting A(-2, 1) to (x1, y1) while B(-4, 4) to (x2, y2) and letting e be the distance.
e = \(\sqrt{\left(x_{2}-x_{1}\right)^{2}+\left(y_{2}-y_{1}\right)^{2}}\) Distance Formula.
= \(\sqrt{((-4)-(-2))^{2}+(4-1)^{2}}\) Substitution.
= \(\sqrt{(-2)^{2}+(3)^{2}}\) Subtract.
= \(\sqrt{4+9}\) Evaluate the squares.
= \(\sqrt{13}\) Add.
≈ ±3.6 Evaluate.
Thus, the park is 3.6 kilometers from the school.
Also, A(-2, 1) is substituted to (x1, y1) whiLe D(0, -2) to (x2, y2) to calculate for the distance of the school to the swimming pool.
g = \(\sqrt{\left(x_{2}-x_{1}\right)^{2}+\left(y_{2}-y_{1}\right)^{2}}\) Distance Formula.
= \(\sqrt{(0-(-2))^{2}+((-2)-1)^{2}}\) Substitution.
= \(\sqrt{2^{2}+(-3)^{2}}\) Subtract.
= \(\sqrt{4+9}\) Evaluate the squares.
= \(\sqrt{13}\) Add.
≈ ±3.6 Evaluate.
Thus, the swimming pool is 3.6 kilometers from the school.
Therefore, the swimming pool and the park is have the same distance from the schooL
Question 6.
Which location is farthest from the school?
Answer:
The task is to identify the location with the largest distance from the school at point A(-2, 1) if the zoo is at B( -4, 4), park at C(2, 3), swimming pool at D(0, -2), and Library at E(-5, -3).
First calculate for the distance of points A and B to determine the distance of the school and the zoo. Apply the distance formula which is the formula used in determining the distance between two points. Let h be the distance of A to B, and A(-2, 1) be (x1, y1) while B(-4, 4) be (x2, y2).
h = \(\sqrt{\left(x_{2}-x_{1}\right)^{2}+\left(y_{2}-y_{1}\right)^{2}}\) Distance Formula.
= \(\sqrt{((-4)-(-2))^{2}+(4-1)^{2}}\) Substitution.
= \(\sqrt{(-2)^{2}+(3)^{2}}\) Subtract.
= \(\sqrt{4+9}\) Evaluate the squares.
= \(\sqrt{13}\) Add.
≈ ±3.6 Evaluate.
Because that there is no negative magnitude(distance), take only the positive vaLue of h. Therefore, the zoo is around 3.6 kilometers away from the school.
Next, compute for the distance of points A and C to know the distance of school to park by app[ying the distance formula describe in (a). Then let j be the distance of A to C, and A(-2, 1) be (x1, y1) while C(2, 3) be (x2, y(x1, y1)).
j = \(\sqrt{\left(x_{2}-x_{1}\right)^{2}+\left(y_{2}-y_{1}\right)^{2}}\) Distance Formula.
= \(\sqrt{(2-(-2))^{2}+(3-1)^{2}}\) Substitution.
= \(\sqrt{4^{2}+2^{2}}\) Subtract.
= \(\sqrt{16+4}\) Evaluate the squares.
= \(\sqrt{20}\) Add.
≈ ±4.5 Evaluate.
Since there is no negative magnitude(distance), take only the positive vaLue of j Therefore, the distance of the school to the park is approximately 4.5 kiLometers.
Now, solve for the distance of two points A and D to identify the distance of schooL and the swimming pool using the distance formula as mentioned above. Let k be the distance of A to D, and A(-2, 1) be (x1, y1) while D(0, -2) be (x2, y2).
k = \(\sqrt{\left(x_{2}-x_{1}\right)^{2}+\left(y_{2}-y_{1}\right)^{2}}\) Distance Formula.
= \(\sqrt{(0-(-2))^{2}+((-2)-1)^{2}}\) Substitution.
= \(\sqrt{2^{2}+(-3)^{2}}\) Subtract.
= \(\sqrt{4+9}\) Evaluate the squares.
= \(\sqrt{13}\) Add.
≈ ±3.6 Evaluate.
No magnitude(distance is negative thus take only the positive value of k. Therefore, the swimming pool is around 3.6 kilometers away from the school.
Lastly, calculate for the distance of point A and point E to determine the distance of the schooL and the library by applying the distance formula Let l be the distance of A to E, and A(-2, 1) be (x1, y1) whiLe E(-5, -3) be (x2, y2).
l = \(\sqrt{\left(x_{2}-x_{1}\right)^{2}+\left(y_{2}-y_{1}\right)^{2}}\) Distance Formula.
= \(\sqrt{((-5)-(-2))^{2}+((-3)-1)^{2}}\) Substitution.
= \(\sqrt{(-3)^{2}+(-4)^{2}}\) Subtract.
= \(\sqrt{9+16}\) Evaluate the squares.
= \(\sqrt{25}\) Add.
= ±5 Evaluate.
There is no negative magnitude(distance) so take only the positive value of l. Therefore, the library is 5 kilometers away from the school.
Since the school has a distance of 3.6 kilometers for both the zoo and swimming pool, has a distance of 4.5 kilometers to the park and 5 kilometers to the Library. Therefore, library has the farthest distance from the school.
Solve. Show your work.
Question 7.
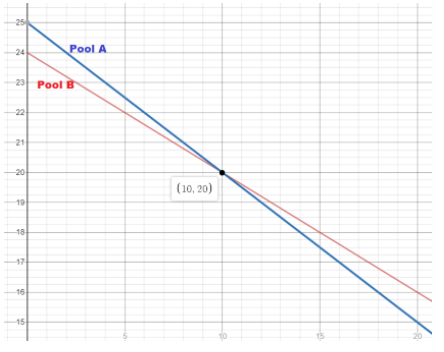
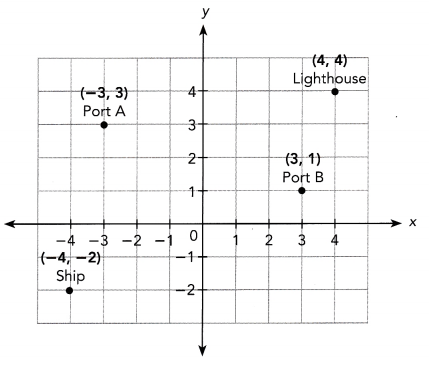
A ship is located at the point shown in the diagram. The ship needs to stop at a port for refueling on its way to the lighthouse. It can either stop at Port A or Port B. If the captain wants the journey to be as short as possible, which port should the ship stop at?
Answer:
The goal is to find which port the captain should pass for a shorter journey to the Lighthouse at (4, 4) if the ship is on point (-4, -2) and the two possible port to stop are Port A(-3, 3) and Port B(3, 1)
First, calculate the distance or me ship to Port A to the from Port A to the Lighthouse. Afterward, add the computed distances to determine the total distance the ship will travel if it will pass through Port A. Applying the distance formula which is the formula used in determining the distance between two points. Let the position of the ship (-4, -2) be (x1, y1) whiLe Port A(-3, 3) be (x2, y2) and u denoted their distance.
u = \(\sqrt{\left(x_{2}-x_{1}\right)^{2}+\left(y_{2}-y_{1}\right)^{2}}\) Distance Formula.
= \(\sqrt{((-3)-(-4))^{2}+(3-(-2))^{2}}\) Substitution.
= \(\sqrt{1^{2}+5^{2}}\) Subtract.
= \(\sqrt{1+25}\) Evaluate the squares.
= \(\sqrt{26}\) Add.
≈ ±5.1 Evaluate.
Note that there is no negative magnitude(distance) so only take u equals to 5.1. Thus, the ship is 5.1 units away from Port A.
For the distance of Port A to the [ighthouse, let Port A(-3. 3) be substituted to (x1, y1) while the position (4, 4) of the Lighthouse to (x2, y2) and let w be their distance then
w = \(\sqrt{\left(x_{2}-x_{1}\right)^{2}+\left(y_{2}-y_{1}\right)^{2}}\) Distance Formula.
= \(\sqrt{(4-(-3))^{2}+(4-3)^{2}}\) Substitution.
= \(\sqrt{7^{2}+1^{2}}\) Subtract.
= \(\sqrt{49+1}\) Evaluate the squares.
= \(\sqrt{50}\) Add.
≈ ±7.1 Evaluate.
Hence, Port A and the Lighthouse has a distance of 7.1 units. Now add the two distances u and w,
u + w = 5.1 – 7.1
= 12.2 units
Thus, the total distance that the ship will travel if it stops to Port A then proceed to the Lighthouse is 12.2 units.
Next, calculate the distance of the ship to Port B then from Port B to the Lighthouse. Then, add the computed distances to determine the total distance the ship will travel if it will pass through Port B. Apply the distance formula to compute for the distance of the ship to the Port B. Let the position of the ship (-4, -2) be (x1, y1) while Port B(3, 1) be (x2, y2) and y denoted their distance.
y = \(\sqrt{\left(x_{2}-x_{1}\right)^{2}+\left(y_{2}-y_{1}\right)^{2}}\) Distance Formula.
= \(\sqrt{(3-(-4))^{2}+(1-(-2))^{2}}\) Substitution.
= \(\sqrt{7^{2}+3^{2}}\) Subtract.
= \(\sqrt{49+9}\) Evaluate the squares.
= \(\sqrt{58}\) Add.
≈ ±7.6 Evaluate.
Thus, the ship is 7.6 units away from Port B.
For the distance of Port B to the [ighthouse, [et Port B(3, 1) be substituted to (x1, y1) white the position (4, 4) of the lighthouse to (x2, y2) and let z be their distance then
z = \(\sqrt{\left(x_{2}-x_{1}\right)^{2}+\left(y_{2}-y_{1}\right)^{2}}\) Distance Formula.
= \(\sqrt{(4-3)^{2}+(4-1)^{2}}\) Substitution.
= \(\sqrt{1^{2}+3^{2}}\) Subtract.
= \(\sqrt{1+9}\) Evaluate the squares.
= \(\sqrt{10}\) Add.
≈ ±3.2 Evaluate.
Hence, Port B and the lighthouse has a distance of 3.2 units. Now add the two distances y and z,
y + z = 7.6 + 3.2
= 10.8 units
Thus, the total distance that the ship will travel if it stop to Port B then proceed to the lighthouse is 10.8 units.
Therefore, the ship should take the route passing to Port B to the lighthouse for a shorter journey.
Question 8.
Blair drew two triangles on a coordinate plane.
a) Find the lengths of the sides of triangle XYZ Classify the triangle by its side lengths.
Answer:
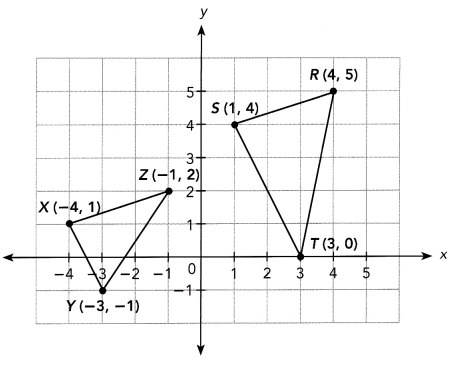
b) Blair thinks that triangle RST is a right triangle. Do you agree? Why or why not?
Answer:
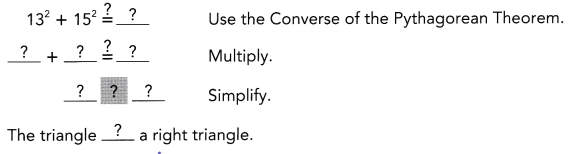
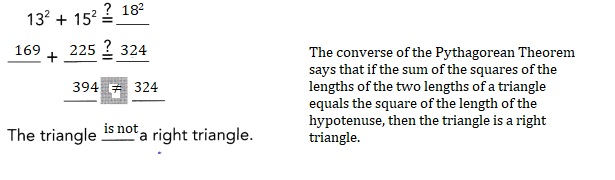
Determine the sides of the triangle by applying the distance formula. Afterwards, use the Converse of Pythagorean Theorem which states that if the square of the length of the hypotenuse of a triangle is equal to the sum of the squares of the lengths of the two legs, then the triangle is a right triangle. If the hypotenuse of ∆RST is equal to the sum of the square of its legs then ∆RST is indeed a right triangle. To calculate side \(\overline{S R}\), substitute S(1, 4) to (x1, y1) while R(4, 5) to (x2, y2)
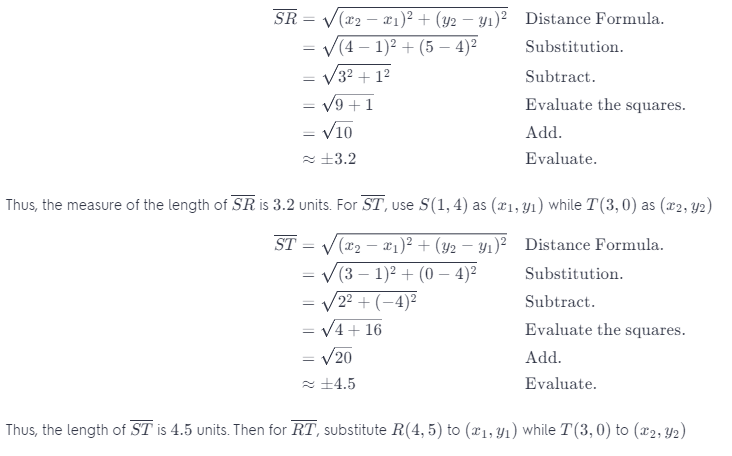
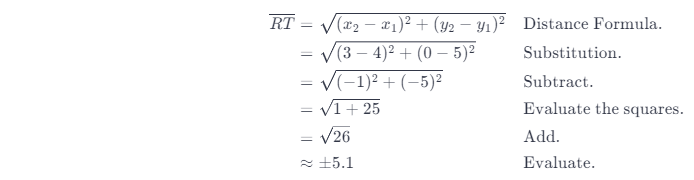
Thus, \(\overline{R T}\) is 5.1 units Long. Since \(\overline{R T}\) has the largest length use it as the hypotenuse then
(5.1)2 = (45)2 + (3.2)2 Use the Converse Pythagorean Theorem.
26.01 = 20.25 + 10.24 Evaluate the squares.
26.01 ≠ 30.49 Add.
Since, the square of \(\overline{R T}\) is not equal to the sum of the squares of ST and SR, then ∆RST is not a right triangle.
Question 9.
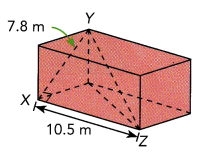
The engine on a cruise ship has broken down and the passengers are waiting for a patrol ship to rescue them. The positions of the two ships are shown on the right. Each unit on the grid equals 6 miles.
a) How far is the patrol ship from the cruise ship?
Answer:
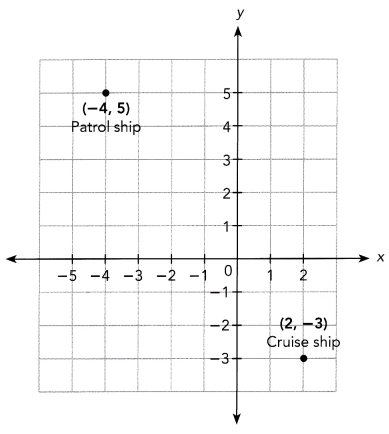
The objective of this task is to analyze the positions of the cruise ship and the patrol ship then a. Find the distance of the two ships to each other, and b. Determine how long will it takes the patrol ship to reach the boat if its traveling at the speed of 50 miles per hour.
Observe that position of the patrol ship denoted by point S is on (-4, 5) while the coordinates of the cruise ship represented by point H is (2, -3) Say vertex P is on (2, 5) and forms a right triangle with the other two points then,
\(\overline{S P}\) = |-4 – 2|
= |-6|
= 6 units
\(\overline{H P}\) = |-3 – 5|
= |-8|
= 8 units
Apply the Pythagorean Theorem which states that the square of the hypotenuse of a right triangle is equal to the sum of the squares of the two other sides then
\(\overline{S P}^{2}+\overline{H P}^{2}=\overline{S H}^{2}\) Use the Pythagorean Theorem.
62 + 82 = \(\overline{S H}^{2}\) Substitute values for \(\overline{S P}\) and \(\overline{H P}\)
36 + 64 = \(\overline{S H}^{2}\) Multiply.
100 = \(\overline{S H}^{2}\) Add.
\(\overline{S H}\) = \(\sqrt{100}\) Find the positive square root.
\(\overline{S H}\) = 10 units. Simplify.
Since each unit is equal to 6 miles then multiply 10 units to 6. Therefore, the patrol ship is 60 miles away from the other ship.
b) If the patrol ship travels at a speed of 50 miles per hour, how long will it take to reach the boat?
Answer:
Since the patrol ship is 60 miles away from the cruise ship and it is travelling at the speed of 5Omi[es per hour, then divide this speed to the distance of the ships to each other to know how long will it takes the patrol ship to reach the boat.
= \(\frac{60 \text { miles }}{50 \text { miles } / \text { hour }}\)
1.2 hour
Therefore, the patrol ship will meet the other ship in 1.2 hours or in 1 hour and 12 minutes.
Question 10.
Math Journal Point P (1,2) is the center of a circle. Three of the following points lie on the circle. Tell which point is not on the circle. Explain your reasoning. A (-1, 4), B (4, 4), C (3, 0), and D (3, 4)
Answer:
The goal of this task is to find out which point among D(3, 4), C(3, 0), B(4, 4), and A(-1, 4) does not belong on circle P whose center is at (1, 2).
To determine which points does note belong to the circle, solve for the distance between the center of the circle and each of the points by applying the distance formula. This states that distance is equal to the square root of the sum of the x-coordinate of the second point minus the x-coordinate of the first point and the y-coordinate of the second point minus the y-coordinate of the first point. Let (1, 2) be (x1, y1) and (3, 4) be (x2, y2) and p be the distance of the center from point D, then
p = \(\sqrt{\left(x_{2}-x_{1}\right)^{2}+\left(y_{2}-y_{1}\right)^{2}}\) Formula.
= \(\sqrt{(3-1)^{2}+(4-2)^{2}}\) Substitution.
= \(\sqrt{2^{2}+2^{2}}\) Subtract.
= \(\sqrt{4+4}\) Evaluate the squares.
= \(\sqrt{8}\) Add.
≈ ±2.8 Evaluate.
Therefore, the center of the circle is approximateLy 2.8 units from point D.
Applying the distance formula, let (1, 2) be (x1, y1) and (3, 0) be (x2, y2) and q be the distance of the center from point C, then
q = \(\sqrt{\left(x_{2}-x_{1}\right)^{2}+\left(y_{2}-y_{1}\right)^{2}}\) Formula.
= \(\sqrt{(3-1)^{2}+(0-2)^{2}}\) Substitution.
= \(\sqrt{2^{2}+(-2)^{2}}\) Subtract.
= \(\sqrt{4+4}\) Evaluate the squares.
= \(\sqrt{8}\) Add.
≈ ±2.8 Evaluate.
Therefore, the center of the circle is around 2.8 units from point C.
Next, using the distance formula, let (1, 2) be (x1, y1) and (4, 4) be (x2, y2) and r be the distance of the center from point B, then
r = \(\sqrt{\left(x_{2}-x_{1}\right)^{2}+\left(y_{2}-y_{1}\right)^{2}}\) Formula.
= \(\sqrt{(4-1)^{2}+(4-2)^{2}}\) Substitution.
= \(\sqrt{3^{2}+2^{2}}\) Subtract.
= \(\sqrt{9+4}\) Evaluate the squares.
= \(\sqrt{13}\) Add.
≈ ±3.6 Evaluate.
Therefore, the center of the circle is about 3.6 units from point B.
Applying the distance formula for the last time, let (1, 2) be (x1, y1) and (-1, 4) be (x2, y2) and s be the distance of the center from point A, then
s = \(\sqrt{\left(x_{2}-x_{1}\right)^{2}+\left(y_{2}-y_{1}\right)^{2}}\) Formula.
= \(\sqrt{(-1)-1)^{2}+(4-2)^{2}}\) Substitution.
= \(\sqrt{(-2)^{2}+2^{2}}\) Subtract.
= \(\sqrt{4+4}\) Evaluate the squares.
= \(\sqrt{8}\) Add.
≈ ±2.8 Evaluate.
Therefore, the center of the circle is approximateLy 2.8 units from point A. Notice that points A, C and D has the same distance from the center of the circle. Thus point B does not belong on circle P.
Question 11.
Math Journal Jose found the distance between points X and Y by first counting grids to find the horizontal and vertical distances. Then he used the Pythagorean Theorem. How is his method different from using the distance formula? How is it the same?
Answer:
The task is to state the similarity and difference of the Pythagorean Theorem and the distance formula.
Both the Pythagorean Theorem and the Distance Formula is utilized to determine the measure of a Line segment The Pythagorean Theorem is used most of the time when the Length of a diagonal Line is unknown The method includes generating Line segments that will serve as the legs of the hypotenuse. This legs must have known measurements so the method will work. The distance formula on the other hand only needs the coordinates of the endpoints of the line so the measure of the length of the segment can be computed.