Practice the problems of Math in Focus Grade 8 Workbook Answer Key Chapter 6 Review Test to score better marks in the exam.
Math in Focus Grade 8 Course 3 A Chapter 6 Review Test Answer Key
Concepts and Skills
Given the relation described, identify the input and the output.
Question 1.
Daphne wants to find the area of a circle given its radius.
Answer:
Input: Radius
Output: Area of Circle
Question 2.
Mr. Reynard wants to find the total cost of the number of items he bought at a store where everything costs one dollar.
Answer:
Input: one dollar
Output: total cost of the number of items
Question 3.
The head of the English department wants to see how each student in Grade 8 does on an English test.
Answer:
Input: Each student’s name
Output: Grades for the English test
Based on the mapping diagrams, state the type of relation. Tell whether each relation is a function.
Question 4.
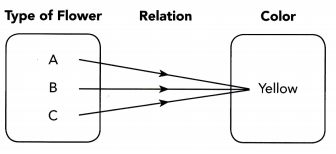
Answer: Many to one relation, it is a function
Question 5.
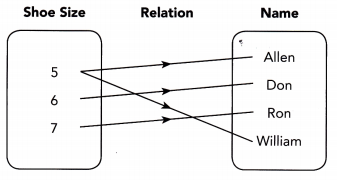
Answer: One to many relation, it is not a function
Tell whether each relation is a function.
Question 6.

Answer: One to one relation, it is a function
Question 7.

Answer: Many tone relation, it is a function
Question 8.
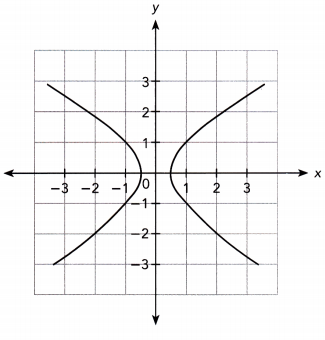
Answer: No
Use graph paper. Show your work.
Question 9.
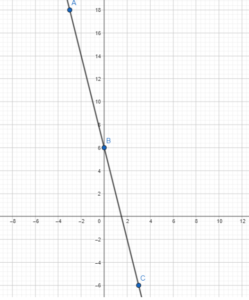
Represent the function y = -4x + 6 as a table and as a graph. Use 1 grid square on the horizontal axis to represent 1 unit for the x interval from -3 to 3, and 1 grid square on the vertical axis to represent 2 units for the y interval from -6 to 18.
Answer:
Given,
y = -4x + 6
| x | -3 | 0 | 3 |
| y | 18 | 6 | -6 |
Tell whether each function is linear or nonlinear. Then tell whether the function is increasing or decreasing.
Question 10.

Answer: Non-Linear and decreasing function
Question 11.
The area of a square, A square centimeters, is a function of its side length, s centimeters, where A = s2.
Answer:
Non-linear and increasing function
Problem Solving
Describe the function. Sketch a graph for the function.
Question 12.
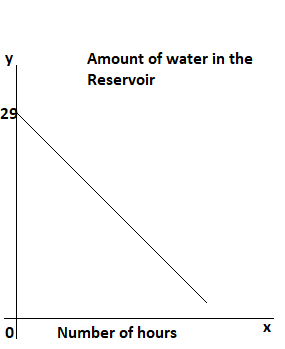
A large region has experienced heavy rains. Government officials decide to open a floodgate to release water from the reservoir at a constant rate of 1 cubic kilometer per hour. Before they open the gate, there are 29 cubic kilometers of water in the reservoir. The amount of water in the reservoir, y cubic kilometers, is a function of the number of hours the floodgate has been opened, x hours.
a) Give the least possible input value and the corresponding output value. Tell whether the function is linear or nonlinear. Then tell whether the function is increasing or decreasing. Explain.
Answer:
The least possible input value is the smallest value of x which is obtained at the initial moment:
x = 0
The corresponding output value y is the amount of water in the reservoir in the initial moment:
y = 29
b) Sketch a graph for the function. Identify the y-intercept of the graph.
Answer:
The graph passes through the point (0, 29), therefore the y-intercept is:
b = 29
In order to sketch a graph of the function, we use the slope m = -1 and the y-intercept 29:
Solve. Show your work.
Question 13.
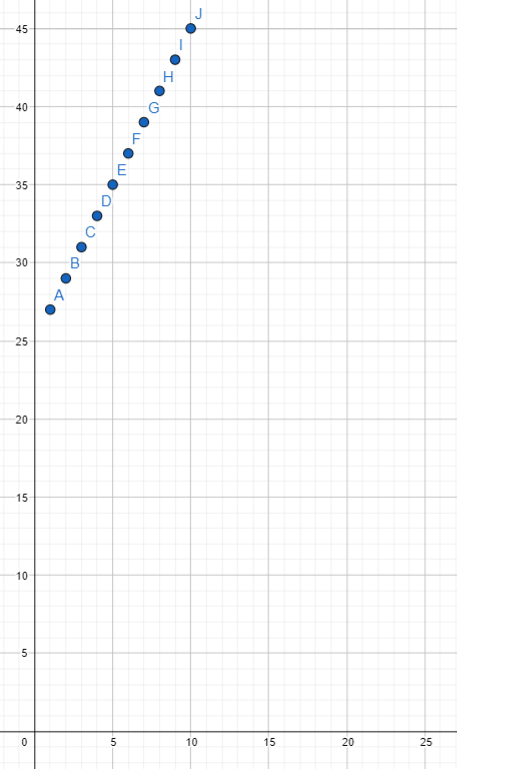
The student council orders T-shirts with the school logo from an online company. The cost for each T-shirt is $2, and the shipping charge for all the shirts is $25. The student council wants to find out the total amount of money they pay, y dollars, for the number of T-shirts they order, x.
a) Write an algebraic equation to represent the function.
Answer: y = 25 + 2x
b) Use graph paper. Graph the relationship between x and y. Use 1 unit on the horizontal axis to represent 1 T-shirt for the x interval from 0 to 10, and 1 unit on the vertical axis to represent $2 for the y interval from 25 to 45.
Answer:
c) Identify whether the function is linear or nonlinear.
Answer: It is linear
d) Identify whether the function is increasing or decreasing. Explain.
Answer: It is increasing because as the values of x increase, the corresponding values of y also increase.
Question 14.
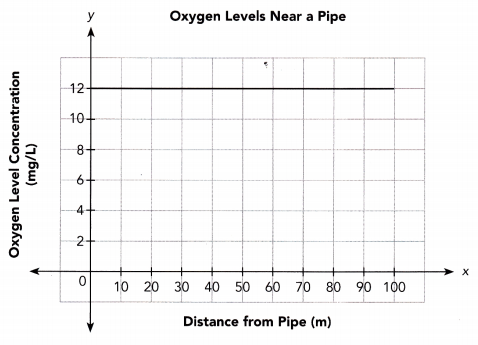
A scientist is checking to see whether pollutants are causing a decrease in oxygen levels in a river near a pipe that drains into the river. She notices that the distance downstream from the pipe, in meters, and the concentration of oxygen in the water, in milligrams per liter, can be described by the function y = 2 + 0.1x, where y is the concentration of oxygen and x is the distance from the pipe. The scientist also tested oxygen levels upstream from the pipe. The graph shows a function that represents this upstream oxygen level concentration.
a) Copy the graph shown. Then graph the function y = 2 + 0.1x on the same coordinate plane.
Answer:
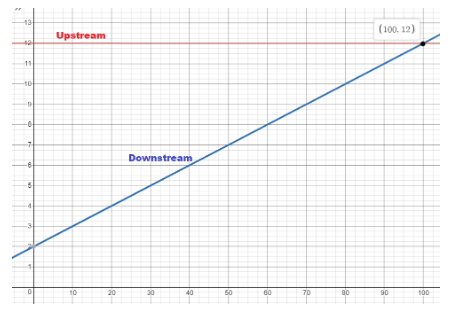
We are given the downstream function:
y = 2 + 0.1x
We graph both functions:
b) Use a verbal description to compare the two functions. Give a possible reason for the difference in oxygen levels upstream and downstream from the pipe.
Answer:
The oxygen level upstream from the pipe is always at 12mg/L regardless of the distance from the pipe.
However, the oxygen level in the river downstream from the pipe is 2mg/L when the distance from the pipe is 0 m and it increases as the distance from the pipe increases. Because the concentration of oxygen increases at a rate of 0.1mg/L, the rate of change of the function is constant. So, it is an increasing linear function; One possible reason is that the river is polluted downstream from the pipe.