Practice the problems of Math in Focus Grade 8 Workbook Answer Key Chapter 6 Lesson 6.1 Understanding Relations and Functions to score better marks in the exam.
Math in Focus Grade 8 Course 3 A Chapter 6 Lesson 6.1 Answer Key Understanding Relations and Functions
Math in Focus Grade 8 Chapter 6 Lesson 6.1 Guided Practice Answer Key
Complete.
Question 1.
Describe the relation between the inputs and the outputs.
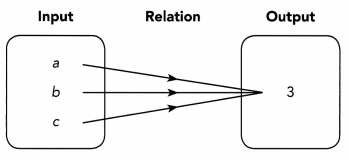
The relation between the inputs and the outputs is a ![]() -to-
-to- ![]() relation.
relation.
Answer:
The relation between the inputs and the outputs is a many to one relation.
Because all the inputs are connected to the single output.
Question 2.
Describe the relation between the inputs and the outputs.
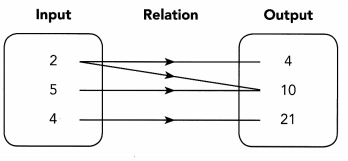
The relation between the inputs and the outputs is a ![]() -to-
-to- ![]() relation.
relation.
Answer:
The relation between the inputs and the outputs is a many to many relation.
Question 3.
The table shows the relation between the heights of five statues and their weights.

Copy and complete the mapping diagram to show the relation between the heights of the five statues and their weights. Then identify the type of relation between the heights and the weights.
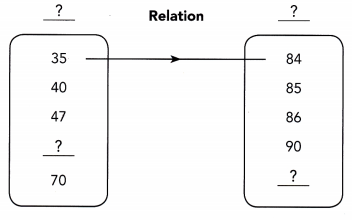
The relation between the heights and the weights is a ![]() -to-
-to- ![]() relation.
relation.
Answer:
The relation between the heights and the weights is a one -to- one relation.

Tell whether each relation is a function. Explain.
Question 4.
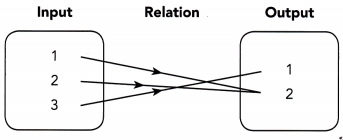
Because the mapping diagram shows a ![]() -to-
-to- ![]() relation, it
relation, it ![]() a function.
a function.
Answer:
Because the mapping diagram shows a one to many relation, it is a one to many function.
Question 5.
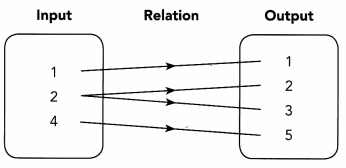
Because the mapping diagram shows a ![]() -to-
-to- ![]() relation, it
relation, it ![]() a function.
a function.
Answer:
Because the mapping diagram shows a one to many relation, it is a one to many function.
Question 6.
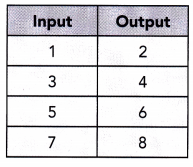
Because the table shows a ![]() -to-
-to- ![]() relation, it
relation, it ![]() a function.
a function.
Answer:
Because the table shows a one to one relation, it is a one to one function.
Tell whether the relation represented by each graph is a function. Explain.
Question 7.
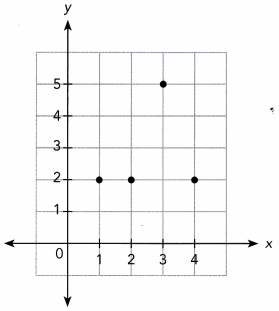
Answer:
You can graph relation by writing and graphing orders pairs.
ordered pairs (1, 2), (2, 2), (3, 5), (4, 2)
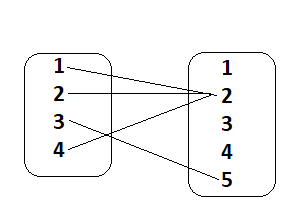
From the above graph, we can say that it is a many to one relation and it is a many to one function.
The above graph is not a function.
Question 8.
Answer:
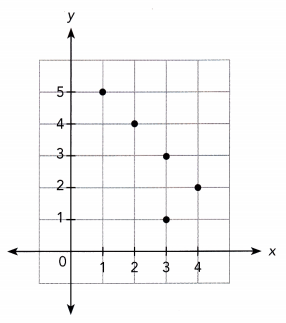
The ordered pairs are (1,5), (2,4), (3,1), (3,3), (4,2)
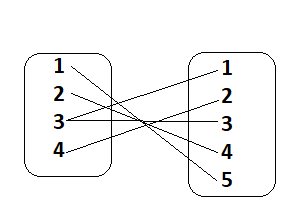
It is a many to one relation.
By seeing the above graph we can say that the relation is not a function.
Question 9.
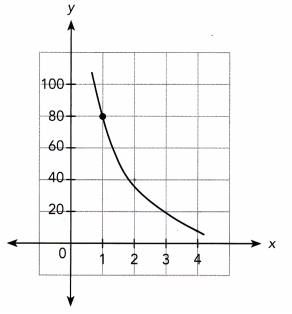
Answer: The above graph is a function.
Question 10.
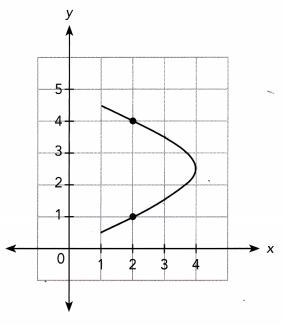
Answer: The above graph is not a function.
Math in Focus Course 3A Practice 6.1 Answer Key
Given the relation described, identify the input and the output.
Question 1.
Mrs. Thomas wants to find out the price charged for the same stereo speaker at different stores.
Answer:
Given
Mrs. Thomas wants to find out the price charged for the same stereo speaker at different stores.
the price of the stereo speaker is input and stores is the output.
Question 2.
Five students, Jessie, Patrick, Wayne, Colin, and Susie, have different heights. Their teacher wants to know their heights.
Answer:
the number of students is input and heights is the output.
Question 3.
Ginny wants to know what after-school activities each of her friends signed up for so she knows whether she shares the same interests.
Answer:
Ginny wants to know what after-school activities each of her friends signed up for so she knows whether she shares the same interests.
Friends is input and after-school activities is output.
Based on the mapping diagram, state the type of relation.
Question 4.
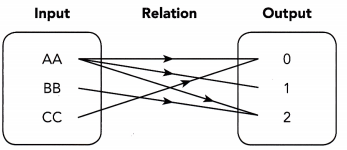
Answer:
It is a many to many relation.
Question 5.
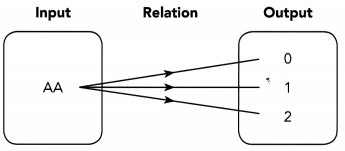
Answer:
It is a one to many relation.
Question 6.
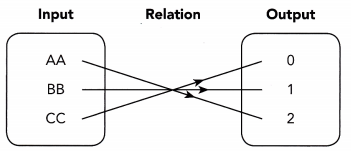
Answer:
It is a one to one relation.
Draw a mapping diagram to represent each relation. Then identify each type of relation.
Question 7.
The table shows the numbers of various types of fruit sold in a supermarket. Draw a mapping diagram to represent the relation between each fruit and the number sold by the supermarket. Identify the type of relation between the fruit and the number sold.

Answer:
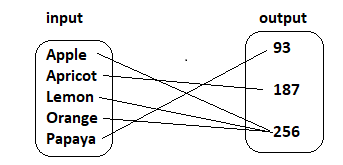
Its is Many to one relation.
Question 8.
The table shows the scores of a soccer team playing in eight different games. Each game is represented by a number.

Draw a mapping diagram to represent the relation between the score for each game and the game number. Identify the type of relation between the score and the game number.
Answer:
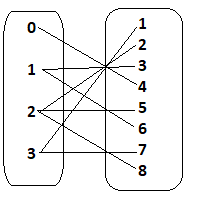
One to many relation
Tell whether each statement is True or False. Explain.
Question 9.
A function is a type of relation.
Answer: true
Explanation: A function is a correspondence between two sets called domain and range.
Question 10.
All relations are functions.
Answer: False
Question 11.
Only a many-to-one relation is a function.
Answer: False
Question 12.
A one-to-many relation is a function.
Answer: True
Identify the type of relation in each mapping diagram. Then tell whether the relation is a function. Explain.
Question 13.
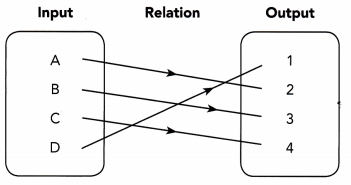
Answer: It is one to one relation. Thus the relation is a one to one function.
Question 14.
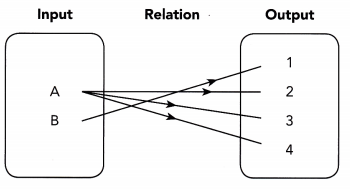
Answer: It is one to many relation. The relation is not a function.
Question 15.
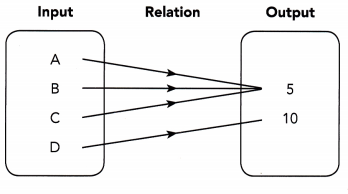
Answer: It is a many to one relation.
Tell whether the relation represented by each graph is a function. Explain.
Question 16.
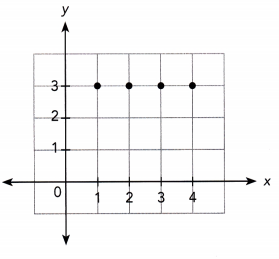
Answer: It is a many to one relation and it is not a function.
Question 17.
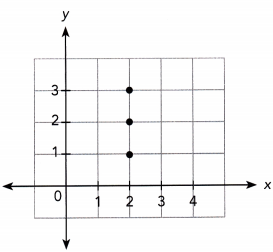
Answer: It is a one to many relation, it is not a function.
Question 18.
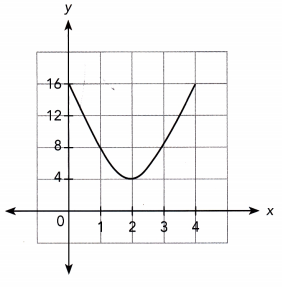
Answer: The above graph is a many to function.
Question 19.
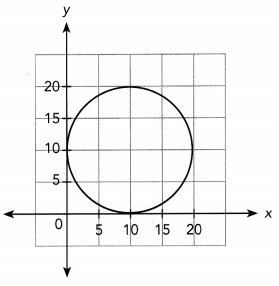
Answer: The above graph is a many to function.
Tell whether the relation described is a function. Use a graph to support your answer.
Question 20.
The cost, y dollars, of some cheese that costs $3 per pound varies directly with the weight, x pounds, of the cheese. Use 1 unit on the horizontal axis to represent 1 pound for the x interval from 0 to 6, and 1 unit on the vertical axis to represent $3 for the y interval from 0 to 18.
Answer:

We build a table of values
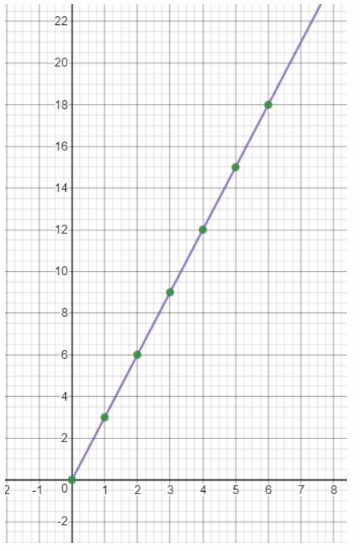
We draw the graph
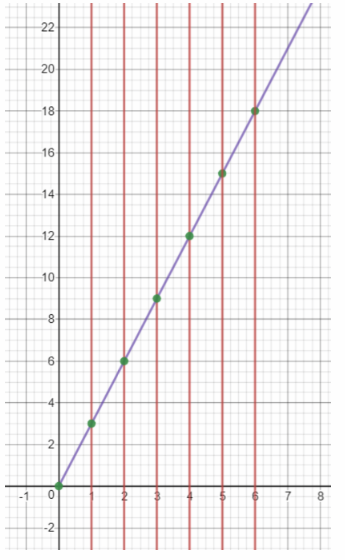
We apply the vertical test: as any vertical line intersects the graph in exactly one point, the relation is a function
Function
Question 21.
A tank contains 3 liters of water. The water in the tank is draining out at a rate of 0.5 liter per hour. Use 1 unit on the horizontal axis to represent 1 hour for the x interval from 0 to 6, and 1 unit on the vertical axis to represent 0.5 liter for the y interval from 0 to 3.0.
Answer:

We build a table of values
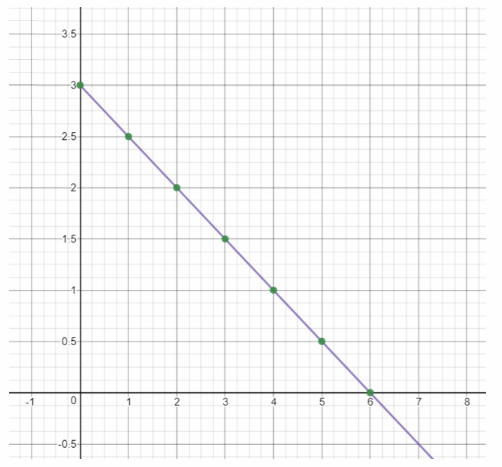
We draw the graph
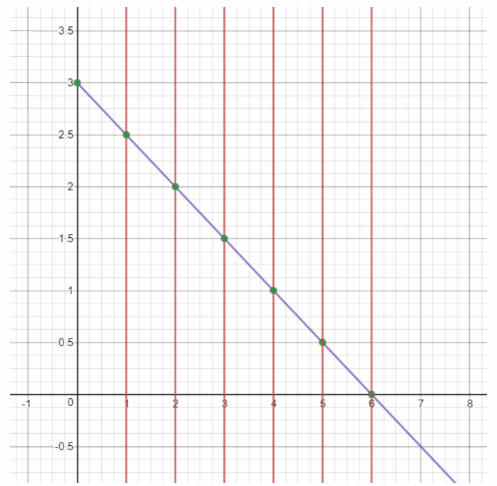
We apply the vertical test: as any vertical line intersects the graph in exactly one point, the relation is a function.
Function
Question 22.
A veterinarian weighed some puppies to see if weight depends on age. The table shows the ages, x months, and the weights, y pounds, of the puppies. Use 1 unit on the horizontal axis to represent 1 month for the x interval, and 1 unit on the vertical axis to represent 1 pound for the y interval.

Answer:

we are given the table of values
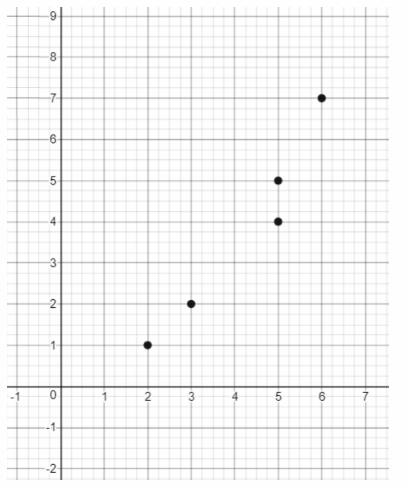
we draw the graph
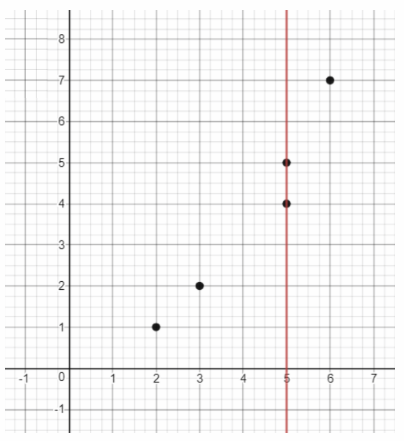
We apply the vertical test: as there is a vertical line which intersects the graph in more than one point, the relation is not a function.
Not a function
Solve. Show your work.
Question 23.
The table shows the number of computers the students have and the number of students in eight schools.

a) Draw a mapping diagram to represent the relation between the number of computers and the number of students.
Answer:
We draw a mapping diagram to represent the relation between the number of computers and the number of students:
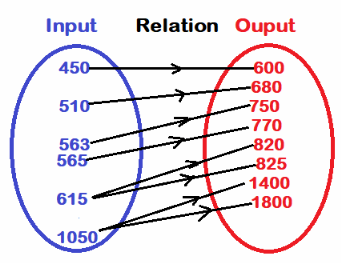
b) From the mapping diagram, identify the relation between the number of computers and the number of students.
Answer: One to many relation
c) Tell whether the relation represented by the mapping diagram is a function. Explain.
Answer: No, because two inputs have more than one output each, it is not a function.
Question 24.
Math Journal Is the relationship between the side length of a square and the area of the square an example of a function? Explain.
Answer:
The relation between the side length x of a square and the area of the square x2 is a one-to-one relation because to each value of x corresponds only one value of x2.
Therefore the relation is a function.
Function
The table below shows the number of books sold by each of six bookstores and the sales made by each store in a week. Use the table to answer questions 25 to 27.

Question 25.
Draw a mapping diagram to represent a relation between the bookstores and the number of books they sold in the week. Identify the type of relation between the bookstores and the number of books sold. Then tell whether the relation represented by the mapping diagram is a function. Explain.
Answer:
Many to one relation, it is a function, each input has only one output.
Question 26.
Draw a mapping diagram to represent the relation between the sales made by the bookstores and the number of books sold in the week. Identify the type of relation between the sales made by the bookstores and the number of books sold. Then tell whether the relation represented by the mapping diagram is a function. Explain.
Answer:
We draw a mapping diagram to represent a relation between the sales made by bookstores and the number of books sold each week:
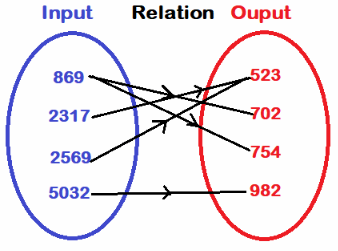
From the diagram we notice that the relation is one-to-many. Therefore the relation is not a function.
Not a function
Question 27.
Math Journal The store owners want to know if the relation between the number of books sold and the sales made by the bookstores is a function.
a) Draw a mapping diagram, with the number of books sold as the input, and the sales made by each bookstore as the output. Is the relation a function? Explain.
Answer:
No, One input, 523, more than one output, 2,317 and 2,569.
b) Why might one bookstore get more money for selling the same number of books as another bookstore?
Answer:
One bookstore could be selling books that are more expensive.