This handy Math in Focus Grade 8 Workbook Answer Key Chapter 10 Review Test detailed solutions for the textbook questions.
Math in Focus Grade 8 Course 3 B Chapter 10 Review Test Answer Key
Concepts and Skills
Draw scatter plot for each of the given table of bivariate data.
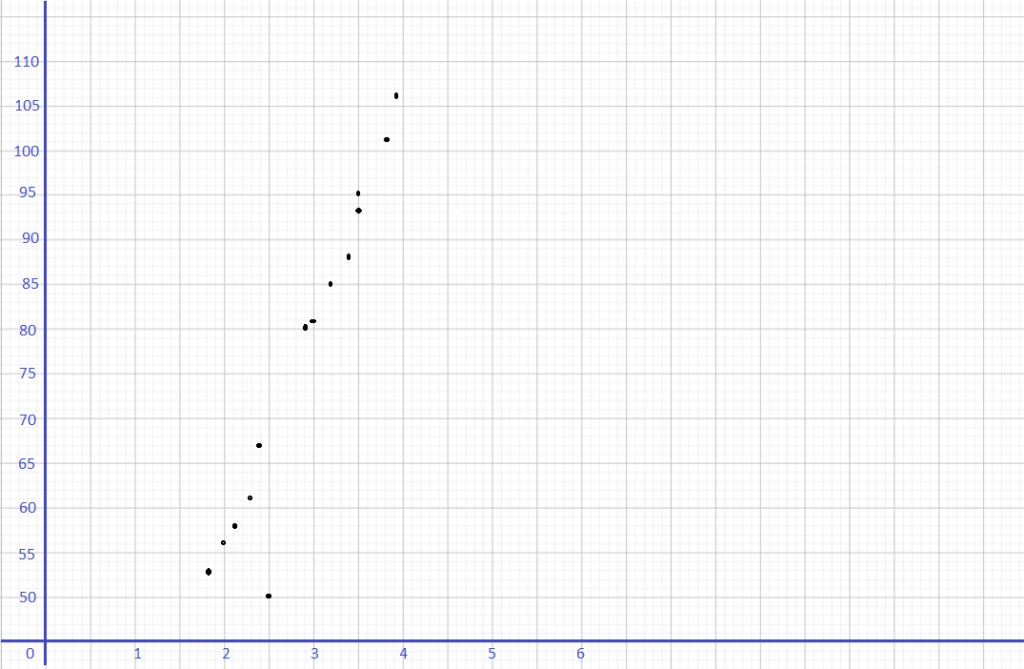
Question 1.
Use 2 centimeters on the horizontal axis to represent 1 unit. Use 1 centimeter on the vertical axis to represent 5 units for the y interval from 50 to 110.
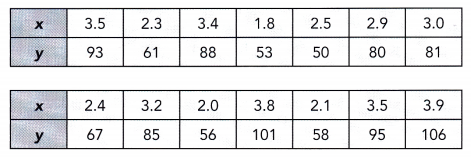
Answer:
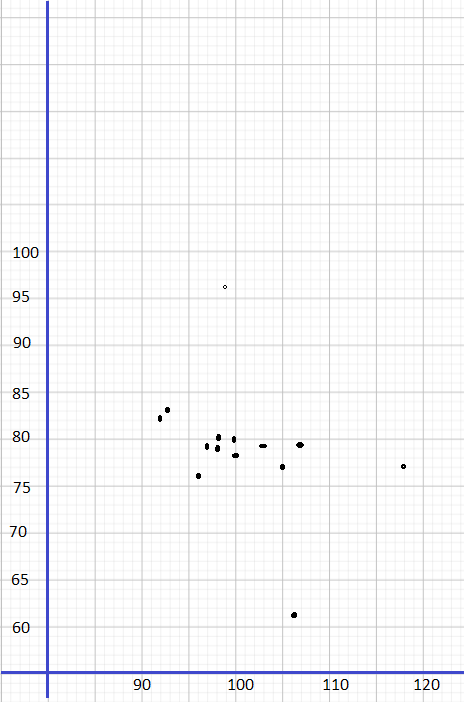
Question 2.
Use 2 centimeters on the horizontal axis to represent 10 units for the x interval from 90 to 120. Use 1 centimeter on the vertical axis to represent 5 units for the y interval from 60 to 100.
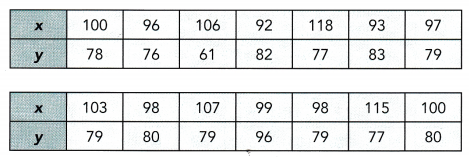
Answer:
Describe the association between the bivariate data shown in each scatter plot.
Question 3.
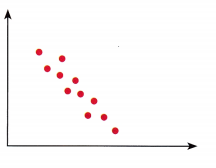
Answer:
The association between the bivariate data shown in the above scatter plot is strong, linear and negative.
Question 4.
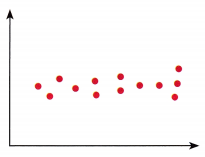
Answer: The association between the bivariate data shown in the above scatter plot is strong, non-linear, and negative.
State the line that represents the line of best fit for each scatter plot.
Question 5.
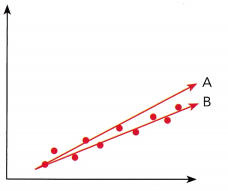
Answer: The best line fit from the above scatter plot is line B.
Question 6.
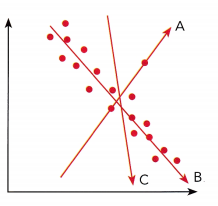
Answer: The best line fit from the above scatter plot is line B.
Identify the outlier(s) in each scatter plot.
Question 7.
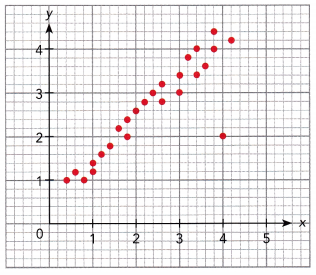
Answer: (4, 2) is the outlier.
Question 8.
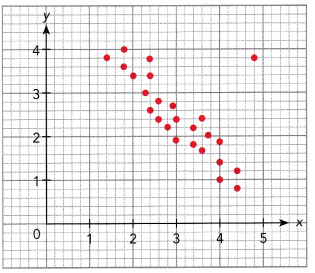
Answer: (4, 1) is the outlier
Construct each scatter plot and draw a line of best fit for the given table of bivariate data.
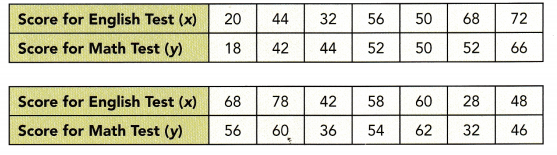
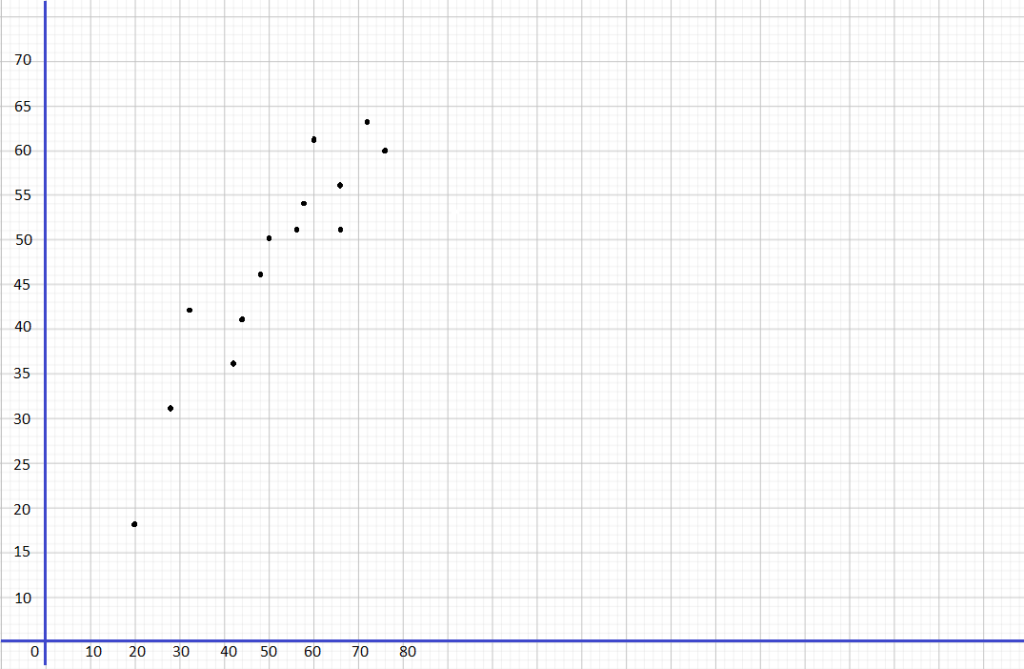
Question 9.
Use 1 centimeter on the horizontal axis to represent a score of 10. Use 1 centimeter on the vertical axis to represent a score of 5.
Answer:
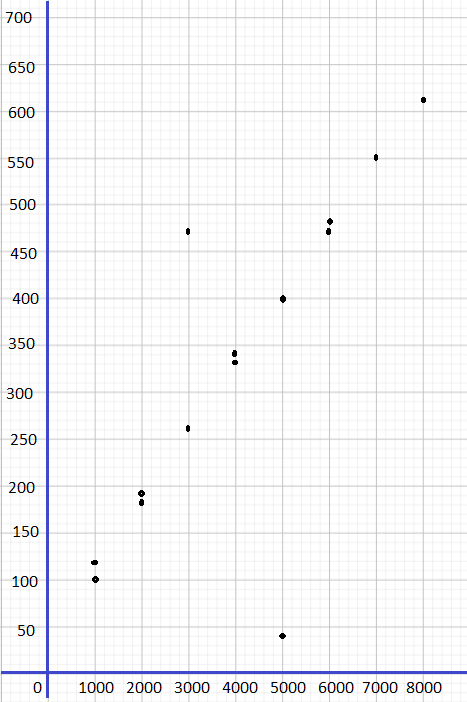
Question 10.
Use 1 centimeter on the horizontal axis to represent 1,000 products. Use 1 centimeter on the vertical axis to represent $50.
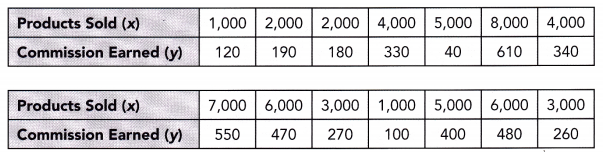
Answer:
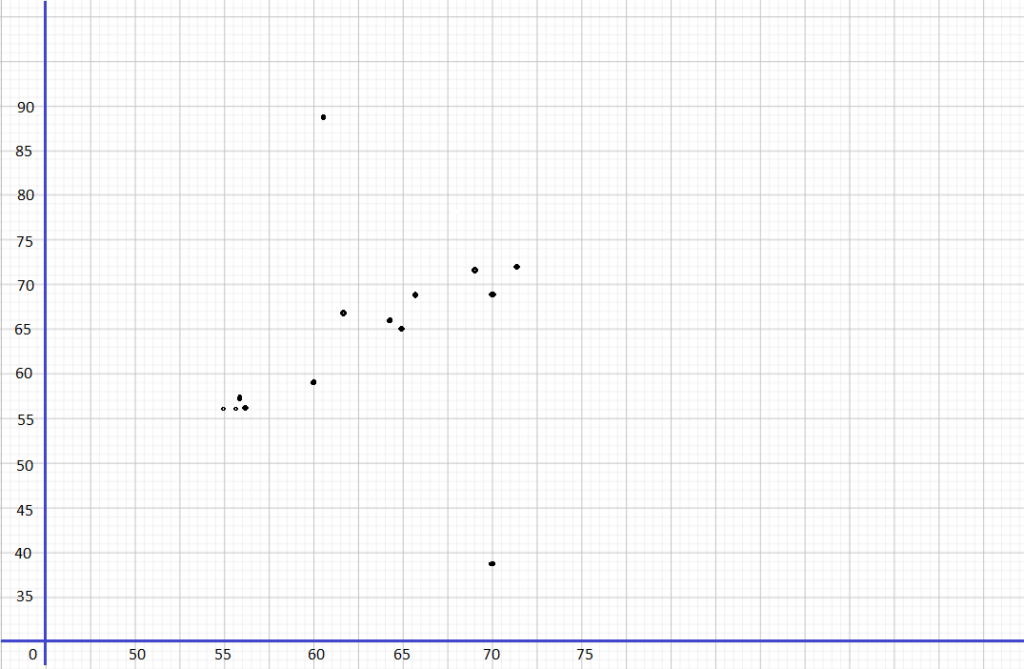
Question 11.
Use 2 centimeters on the horizontal axis to represent 5 inches. Use 1 centimeter on the vertical axis to represent 5 inches for the y interval from 35 to 90.
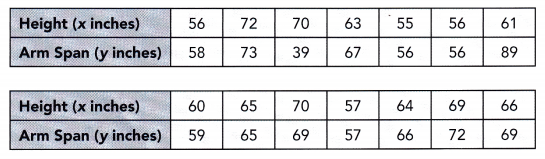
Answer:
Identify whether the given data is categorical or quantitative.
Question 12.
Brown, green, blue
Answer: categorical
Question 13.
$1, $2, $3, $4
Answer: quantitative
Question 13.
1 A.M., 2 A.M., 3 A.M.
Answer: categorical
Use the two-way table to answer questions 15 to 18.
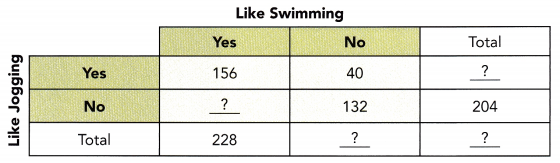
Question 15.
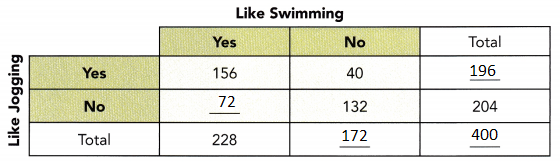
Copy and complete the two-way table.
Answer:
Question 16.
Describe the association between the two categorical data.
Answer: The association between the two categorial data describes number of people like and do not like jogging and the number of people like swimming and do not like swimming.
Question 17.
Find the relative frequencies among the rows, and interpret their meanings. Round your answer to the nearest hundredth where necessary.
Answer:
Jogging:
156/196 = 0.80
40/196 = 0.20
72/204 = 0.35
132/204 = 0.65
Question 18.
Find the relative frequencies among the columns, and interpret their meanings. Round your answer to the nearest hundredth where necessary.
Answer:
156/228 = 0.68
72/228 = 0.32
40/172 = 0.23
132/172 = 0.77
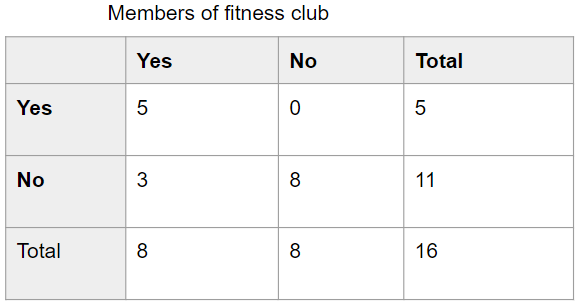
Question 19.
Construct a two-way table using the data below.
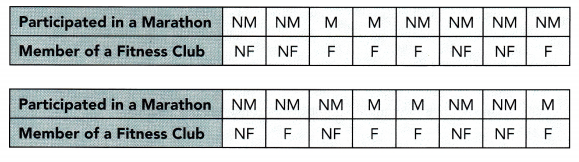
M represents participarted in a marathon
NM represents not participarted in a marathon
F represents member of a fitness club
NF represents non-member of a fitness club
Answer:
Problem Solving
Refer to the scenario below to answer questions 20 to 27.
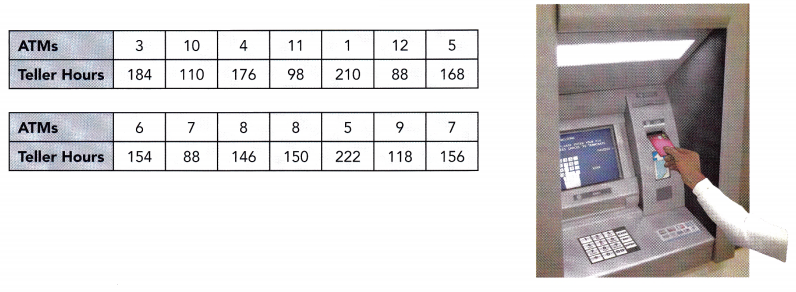
A bank wants to reduce the number of hours that its tellers work per month. To do this, more Automated Teller Machines (ATMs) are installed in the branch offices. The table below shows the number of ATMs, x, in the branch offices and the corresponding number of hours per month, y, that its tellers work.
Question 20.
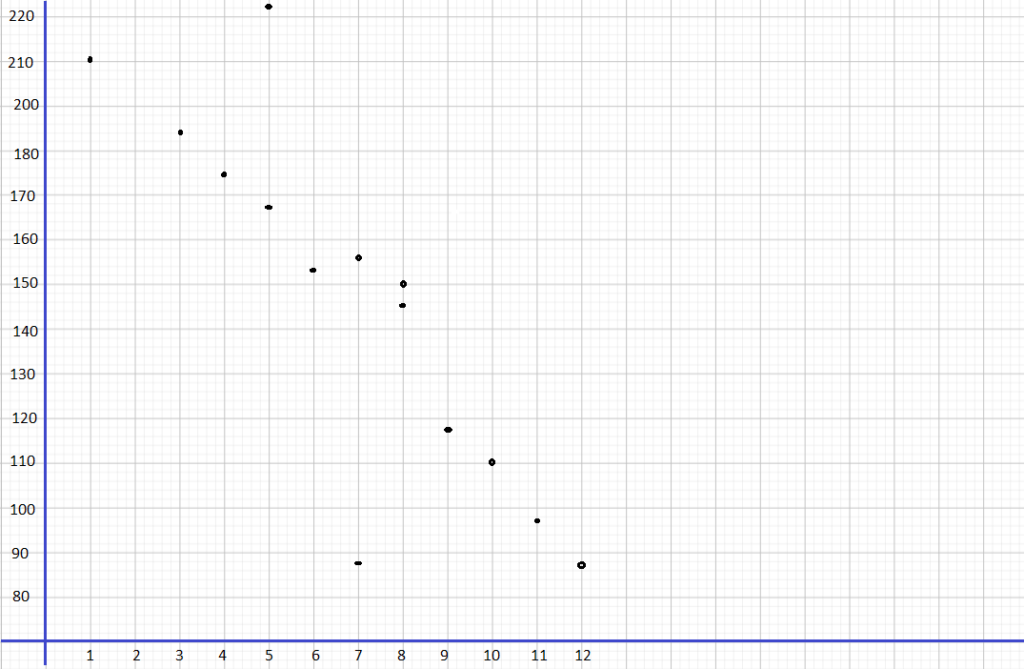
Use graph paper to construct the scatter plot for the above bivariate data. Use 1 centimeter on the horizontal axis to represent 1 ATM. Use 1 centimeter on the vertical axis to represent 10 hours for the y interval from 80 to 230.
Answer:
Question 21.
Describe the association between the number of hours that tellers work and the number of ATMs.
Answer: By seeing the above graph we can say that as the number of ATMs increases, the number of hours that tellers work decreases.
Question 22.
Identify the outlier(s).
Answer:(10,110)
Question 23.
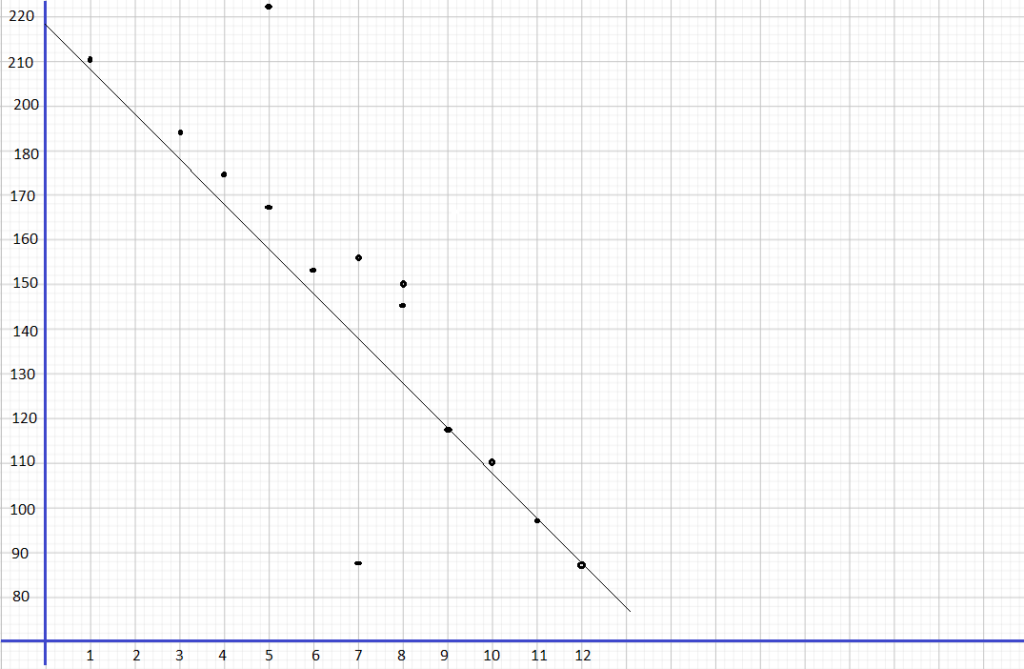
Draw a line of best fit.
Answer:
Question 24.
Write an equation for the line of best fit.
Answer:
The target of this task is to give the equation of the Line of best fit for the scatter pLot of the number of ATMs to the number of hours teller works.
For the equation of the line of best fit, use points that the best fit Une passes through, (7, 156) and (12, 88), to solve for the slope of the line. The slope of the line equates the difference of y2 to y1 over the difference of x2 to x1. Then, let m be the slope, (7, 156) be (x1, y1) and(12. 88) be (x2, y2) so
m = \(\frac{y_{2}-y_{1}}{x_{2}-x_{1}}\) Slope Formula
= \(\frac{88-156}{12-7}\) Subtraction
= \(\frac{-68}{5}\) Subtract
= -13.6 Simplify
Next, use the slope-intercept form to determine the equation of the straight Line given by y = mx ± b, where m is the slope, b is the y-intercept, and (7, 156) be (x, y) then
y = mx + b Slope-intercept Form.
156 = -13.6(7) + b Substitution.
156 = -95.2 + b Multiply.
156 + 95.2 = -95.2 + b + 95.2 Add 95.2 to both sides.
251.2 = b Simplify.
Lastly, using the slope-intercept form again, [et rn be the sLope equals to -13.6 and b equals to 251.2. thus
y = mx + b Slope-intercept Form.
y = -13.6x + 251.2 Substitution.
Therefore, the equation of the line of best fit is y = -13.6x + 251.2.
Question 25.
Using the equation in 24, predict the number of teller hours required per month when there are 2 ATMs.
Answer:
The goal of this task is to give the approximate hours the tellers wiLl work per month using the graph if there are 2 Automated Teller Machines.
To estimate the hours tellers work y given the number of ATMs x, study the graph then note at what point does x equals to 2 meets y. The point is on (2, 224). Therefore, if there only exist 2 Automated Teller Machines in the branch office, then telLers would have to work around 224 hours per month.
Question 26.
Using the equation in 24, predict the number of teller hours required per month when there are 15 ATMs.
Answer:
The objective of this task is to calculated using the equation of the Line y = -13.6x + 251.2 the total hours the tellers will work per month if there are 15 Automated Teller Machines.
To compute the tellers hours per month if there exist 15 ATMs in the office branch, note that the teller hours is denoted as y and the number of ATMs is denoted as x. Then when x is 15.
y = -13.6x + 251.2 Equation of the line.
= -13.6(15) + 251.2 Substitution.
= -204 + 251.2 Multiply.
= 47.2 Simplify.
Therefore, when using the equation y = -13.6z + 251.2. the total hours the tellers work would be 47.2 if there are 15 ATMs.
Question 27.
Math Journal Explain why the equation is 24 cannot be used to predict the number of teller hours required per month for more than 30 ATMs. Discuss the accuracy of the prediction.
Answer:
The goal of this task ¡sto prove that the equation y = -13.6x + 251.2 to make a prediction for the length of working hours when there are 20 Automated Teller Machines, then describe how accurate this kind of prediction is. If 20 is to be substituted to the equation,
y = -13.6(20) + 251.2 = -20.8
The negative value of time that the equation provided makes it impossible to utilize the equation. Next rote that the association of number of ATMs to the number of hours teller works is weak, negative and linear The weak association makes it hard to tell a relationship or pattern of the two variables. Therefore, the prediction is not very right.
Refer to the scenario below to answer questions 28 to 32.
A survey is conducted to find out if providing nutrition information on the menu affects whether patrons recommend the restaurant to others.
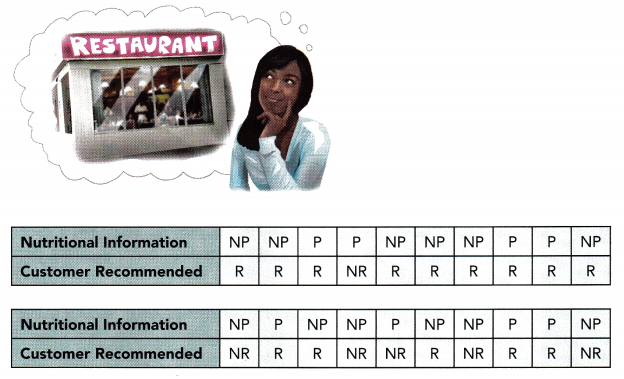
P represents provide nutritional information
NP represents do not provide nutritional information
R represents recommend
NR represents do not recommend
Question 28.
Construct a two-way table using the above data.
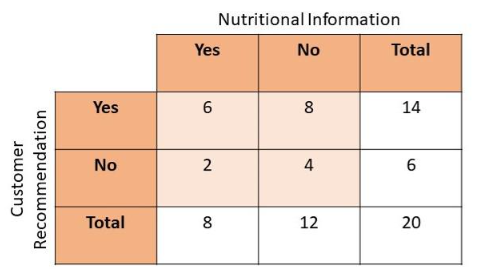
Answer:
The objective of this task ¡s to make a two-way table of the survey about being aware of the nutrition of the foods and the customer recommendation.
Since there are two categories in the survey, the information about the nutrients of the food and the customer recommendation, then the two-way table will. be divided into these categories. Observe that there are 6 who are provided with information and recommended the restaurant, S was not given an information about the nutrition but still recommends it, 2 who were provided with this info but did not recommend the place, and 1 are not given information and did not recommended the restaurant.
Question 29.
Are there greater or fewer people that are informed of the nutrition of the food they eat?
Answer:
The goal is to determine if there are bigger or smaller population of people who are aware of the nutrition of the food they consume. Notice that the total number of people who answered no” when asked whether they have the nutritional information is greater than those who answered ‘yes’ Therefore, the are lesser number of people who are conscious of the nutrition of food they are taking.
Question 30.
Find the relative frequencies among the rows, and interpret their meanings. Round your answer to the nearest hundredth where necessary.
Answer:
The objective is to solve for the relative frequencies from the survey about preferred sports among the girls and boys.
To determine the relative frequency, divide each of the frequency of those who are aware of the nutritional information to the total number of those who recommend and do not recommend the restaurant Also, divide the frequency of those who are not provided with the nutritional information to the total number of those who recommend and do not recommend the restaurant.
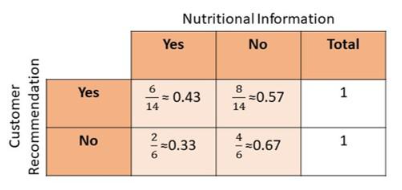
From the table, observe that the highest reLative frequency obtained is the one where nutritional facts are not provided so the customers did not recommend the shop.
Therefore, when the owners refuse to give the nutritional information, the number of people who do not recommend the restaurant increases.
Question 31.
Find the relative frequencies among the columns, and interpret their meanings. Round your answer to the nearest hundredth where necessary.
Answer:
The objective is to solve for the relative frequencies from the survey about preferred sports among the girLs and boys.
To determine the relative frequency, divide each of the frequency of those who recommend the restaurant to the total number of those who are provided by nutritional information and to the total number of those who are not given the nutritional information. Also, divide the frequency of those who does not recommend the restaurant to the total number of those who are aware of nutritionaL information and to the total number of those who are not aware of the nutritional information.
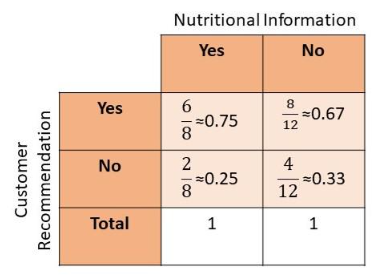
Observe that the highest relative frequency is obtained is the one where nutritional facts are provided so the customers recommend the shop. Therefore, as the nutritional information is lay out by the restaurant owner, the number people who recommend the restaurant increases.
Question 32.
Math Journal Would you recommend that restaurant owners provide nutrition information for the menu items to their customers? Explain.
Answer:
The objective of this task is to make a recommendation on whether owners of restaurant lay out the nutritional facts of the food they serve. Since when the nutritional information is given by the restaurant owner, the number people who recommend the restaurant increases. On the other hand, when the owners refuse to give the nutritional information, the number of people who do not recommend the restaurant increases. Therefore, it is a good suggestion to the owners to give information about the food they serve for their customers to also recommend their shop to others.