This handy Math in Focus Grade 8 Workbook Answer Key Chapter 10 Lesson 10.3 Two-Way Tables detailed solutions for the textbook questions.
Math in Focus Grade 8 Course 3 B Chapter 10 Lesson 10.3 Answer Key Two-Way Tables
Math in Focus Grade 8 Chapter 10 Lesson 10.3 Guided Practice Answer Key
Solve.
Question 1.
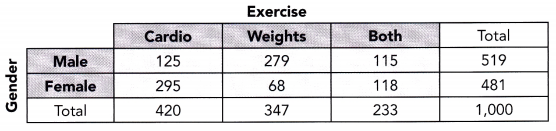
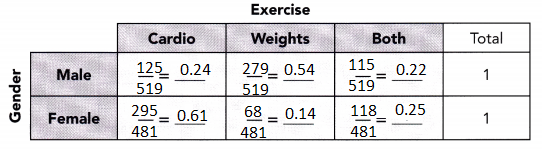
A survey asked 1,000 gym members what type of exercises they do when they visit the gym. The results are recorded in a two-way table as shown.
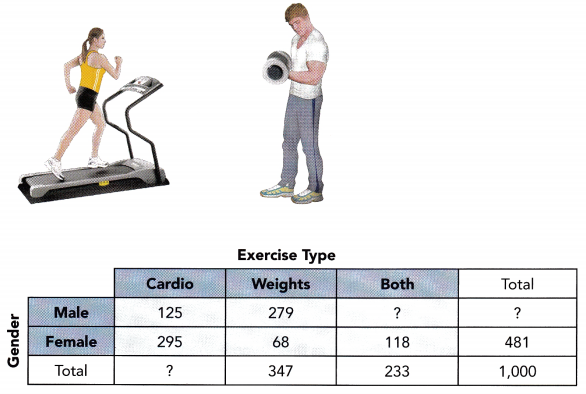
a) Find the total number of male gym members surveyed.
Total number of males = Total surveyed – Total number of females
= ![]() –
– ![]()
= ![]()
The total number of male gym members surveyed is ![]() .
.
Answer:
Total number of males = Total surveyed – Total number of females
= 1000 – 481
= 519
The total number of male gym members surveyed is 519.
b) Find the number of male gym members who chose both types of exercises.
Number of males who chose both
= Total number of males – Number of males who chose cardios – Number of males who chose weights
= ![]() –
– ![]() –
– ![]()
= ![]()
The number of male gym members who chose both types of exercises is ![]() .
.
Answer:
Number of males who chose both
= Total number of males – Number of males who chose cardios – Number of males who chose weights
= 519 – 125 – 279
= 115
The number of male gym members who chose both types of exercises is 115.
c) Find the total number of gym members who chose cardio exercises.
Total number of members who chose cardios
= Number of males who chose cardios + Number of female who chose cardios
= ___ +____
= __
The total number of gym members who chose cardio exercises is ___.
Answer:
Total number of members who chose cardios
= Number of males who chose cardios + Number of female who chose cardios
= 125 +295
= 420
The total number of gym members who chose cardio exercises is 420.

Question 2.
An athletic club owner wants to know which cardio exercise is most popular: cycling, running, or swimming. The owner is also interested in whether athletic club members read sports magazines. He surveys 20 randomly selected athletic club members. Results are shown below.
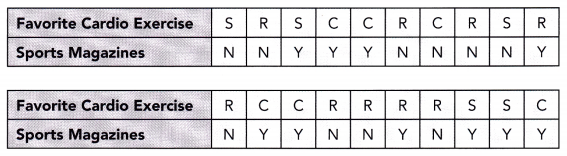
C represents cycling
R represents running
S represents swimming
Y represents read sports magazines
N represents do not read sports magazines
a) Summarize the data into a two-way table.
Answer:
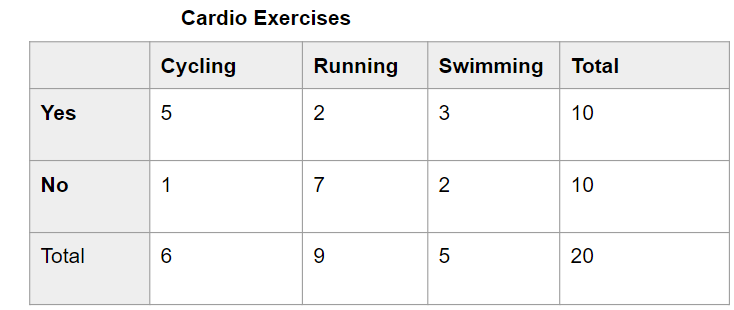
b) Which cardio exercise do club members prefer?
The total number of members who chose cycling, running, and swimming is ![]() ,
, ![]() , and
, and ![]() respectively. So members prefer
respectively. So members prefer ![]() .
.
Answer:
By seeing the above table we can know how many members prefer cardio exercise.
The total number of members who chose cycling, running, and swimming is 6, 9, and 5 respectively. So members prefer running.
c) What percent of club members read sports magazines?
The total number of club members surveyed is ![]() .
.
The number of people that read sports magazines is ![]() .
.
Percent of participants that read sports magazines is ![]() .
.
Answer:
The total number of club members surveyed is 20.
The number of people that read sports magazines is 10.
Percent of participants that read sports magazines is 50%.
d) Describe any association between the type of cardio exercise that the club members prefer and whether the members read sports magazines.
The number of cyclists, runners, and swimmers that read sports magazines is ![]() ,
, ![]() , and
, and ![]() . So, more
. So, more ![]() prefer to read sports magazines.
prefer to read sports magazines.
There is ![]() association between the type of cardio exercise that the club members prefer and whether the members read sports magazines.
association between the type of cardio exercise that the club members prefer and whether the members read sports magazines.
Answer:
The number of cyclists, runners, and swimmers that read sports magazines is 5, 2, and 3. So, more cyclists prefer to read sports magazines.
There is no association between the type of cardio exercise that the club members prefer and whether the members read sports magazines.
Copy the table. Solve. Round your answer to the nearest hundredth where necessary.
Question 3.
A survey asked 1,000 gym members what type of exercises they do when they visit the gym. The results are recorded into a two-way table as shown.
a) Find the relative frequencies to compare the distribution of genders among each type of exercises.
Answer:
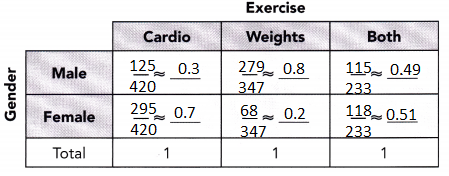
b) Describe the distribution of male and female gym members for each type of exercises.
More ![]() members do cardio exercises than
members do cardio exercises than ![]() members.
members.
More ![]() members do weight exercises than
members do weight exercises than ![]() members. Among those who do both types of exercises, it is
members. Among those who do both types of exercises, it is ![]() distributed between male and female gym members, with slightly more
distributed between male and female gym members, with slightly more ![]() members.
members.
Answer:
More female members do cardio exercises than male members.
More male members do weight exercises than female members. Among those who do both types of exercises, it is almost evenly distributed between male and female gym members, with slightly more female members.
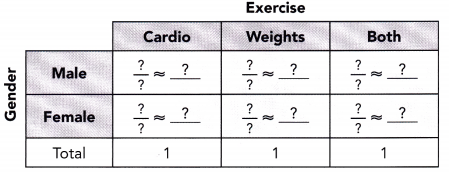
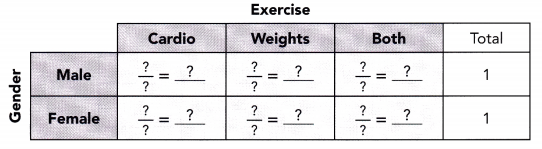
c) Find the relative frequencies to compare the distribution of the type of exercises among each gender.
Answer:
d) Describe the distribution of male and of female gym members for each type of exercises.
Among male members, most do ![]() exercises and least do
exercises and least do ![]() exercises.
exercises.
Among female members, most do ![]() exercises and least do
exercises and least do ![]() exercises.
exercises.
Answer:
Among male members, most do weight exercises and least do both exercises.
Among female members, most do cardio exercises and least do weight exercises.
Math in Focus Course 3B Practice 10.3 Answer Key
Identify the categorical data.
Question 1.
Temperature, Weight, Color
Answer: Color
Question 2.
Street name, Number of boxes. Time
Answer: Street name
Identify whether the given data is categorical or quantitative.
Question 3.
Large, medium, small
Answer: categorical
Question 4.
20 mi/h, 40 mi/h, 50 mi/h
Answer: quantitative
Use the two-way table to answer questions 5 to 9.
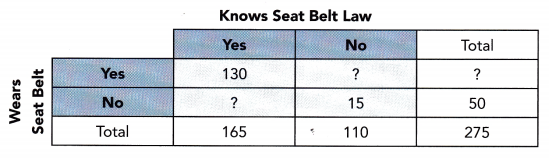
In some states, all passengers in a vehicle are required to wear a seat belt when the vehicle is on a public road. A poll of 275 randomly selected vehicle passengers was conducted in a state that has the seat belt law to determine the association between passengers who know the seat belt law and passengers who obey this law.
Question 5.
Find the number of passengers who wear seat belts.
Answer:
Number of passengers = Total randomly selected vehicle passengers – Number of passengers not wearing seat belts.
275 – 50 = 225
Question 6.
Find the number of passengers who wear seat belts and do not know the seat belt law.
Answer:

Question 7.
Find the number of passengers who do not wear seat belts and know the seat belt law.
Answer: 50 – 15 = 35
Question 8.
Describe what you can see in the data from the row totals and column totals.
Answer: From the table, we observe the number of passengers who wear seat belts and the number of passengers who know seat belt law.
Question 9.
Is there any association between the passengers who know the seat belt law and passengers who obey the seat belt law?
Answer: From the table, we observe the number of passengers who know the seat belt law and passengers who obey the seat belt law.
Use the data below to answer questions 10 to 12.
A survey of 24 households shows whether they save a portion of their income regularly and whether they have life insurance.
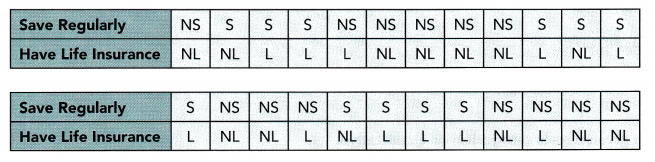
S represents save regularly
NS represents do not save regularly
L represents have life insurance
NL represents do not have life insurance
Question 10.
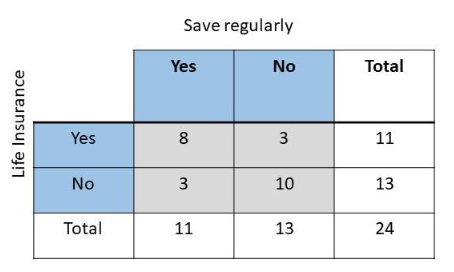
Arrange the above data into a two-way table.
Answer:
The objective of this task is to make a two-way table of the survey about whether the household has a life insurance and if they regularly save a part of their salary.
Since there are two categories in the survey, whether they save regularly a portion of their earnings and if they have life insurance, then the two-way table will be divided into this categories. Observe that there are 8 homes that has savings and insurance, 3 homes do not have savings but they have life insurance and another 3 have savings but do not have life insurance. Lastly, there are 10 households that do not have both savings and life insurance.
Question 11.
Do more or fewer households have life insurance than not? Support your answer with the given data.
Answer:
The target of this task is to compare the number of household that has a life insurance and to does who does not have.
Observe the two-way table. Notice that there are 11 houses that have life insurance and 13 who does not have. Therefore, there are fewer households that acquire life insurance than do not have.
Question 12.
Is there any association between households that save regularly and households that have life insurances? Justify your answer from the data.
Answer:
The goal is to verify the relation of the households that regularly save a portion of their income to the homes with life insurance.
Households with savings tend to have life insurance compared to households who do not save since there are 8 households who have savings and insurance, but only 3 households who do not have savings and possess a life insurance.
Use the table to answer questions 13 to 15.
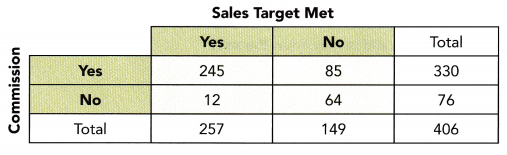
The table below shows whether the sales target of salesperson are met and whether they are paid on commission.
Question 13.
Find the relative frequencies among the rows, and interpret their,L meanings. Round your answer to the nearest hundredth where necessary.
Answer:
245/330 = 0.74
85/330 = 0.26
12/76 = 0.16
64/76 = 0.84
Question 14.
Find the relative frequencies among the columns, and interpret their meanings. Round your answer to the nearest hundredth where necessary.
Answer:
245/257 = 0.95
12/257 = 0.04
85/149 = 0.57
64/149 = 0.43
Question 15.
Describe the association between a salesperson meeting the sales target and whether the salesperson is paid on commission.
Answer:
Salesperson those who are not paid on commission tend not to meet the sales target, while salesperson who are paid on commission tend to meet the sales target.
Brain @Work
Question 1.
Mindy was shown two scatter plots.
a) The diagram below shows the first scatter plot.
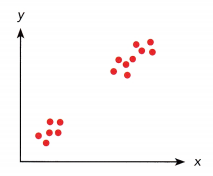
Mindy concluded that there is a linear association between the bivariate data. But her teacher told her she is wrong. Explain why her teacher says so.
Answer: We can see some data missing points in the above graph between the interval that has no data points, it may not be necessary to follow linear trend.
b) The diagram below shows the second scatter plot.
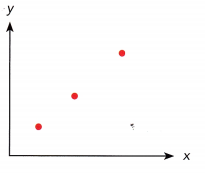
Mindy concluded that there is a linear association between the bivariate data. Her teacher disagree with her. Explain why.
Answer:
There are only 3 data points and that is an insufficient amount of data to conclude the association between the bivariate data.
Question 2.
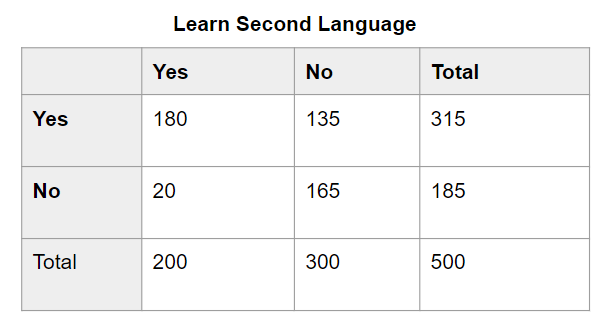
A school principal conducted research to find out about students learning a second language and students learning music. He surveyed 500 students, and the relative frequencies of the data are shown below.
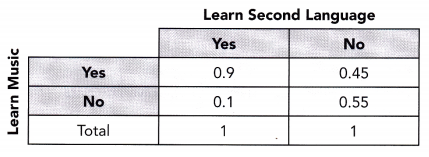
a) The total number of students who are learning second language is 200. Find the total number of students who are and who are not learning music.
Answer: 200 × 90/100 = 180
200 × 10/100 = 20
500 – 200 = 300
300 × 45/100 = 135
300 × 55/100 = 165
total number of students who are not learning music = 20 + 165 = 185
total number of students who are learning music = 180 + 135 = 315
b) Represent the actual data in a two-way table.
Answer: