Practice the problems of Math in Focus Grade 8 Workbook Answer Key Chapter 6 Lesson 6.3 Understanding Linear and Nonlinear Functions to score better marks in the exam.
Math in Focus Grade 8 Course 3 A Chapter 6 Lesson 6.3 Answer Key Understanding Linear and Nonlinear Functions
Math in Focus Grade 8 Chapter 6 Lesson 6.3 Guided Practice Answer Key
Tell whether each table of values represents a linear or nonlinear function. Explain.
Question 1.
Because the rate of change for the function is ![]() , the table represents a
, the table represents a ![]() function.
function.
Answer:
Because the rate of change for the function is constant, the table represents a linear function.
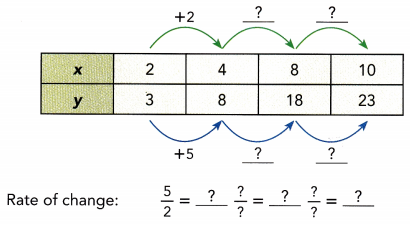
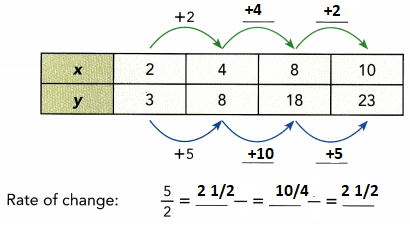
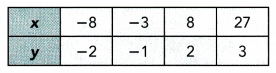
Question 2.
Because the rate of change for the function is ![]() , the table represents a
, the table represents a ![]() function.
function.
Answer:
Because the rate of change for the function is non-constant, the table represents a non-linear function.
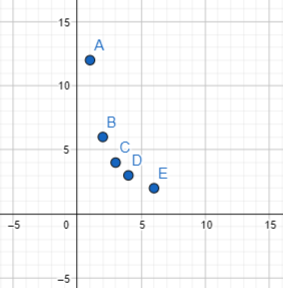
Tell whether each graph represents a linear function. If so, find the rate of change.
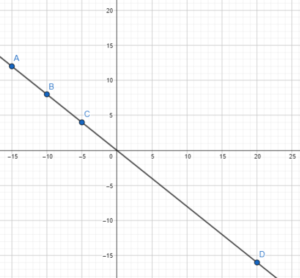
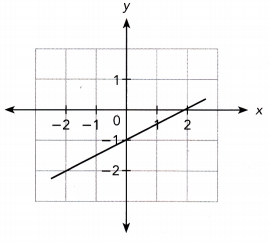
Question 3.
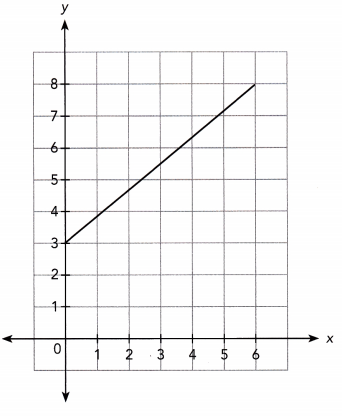
Because the graph is a ![]() , it represents a
, it represents a ![]() function.
function.
The line passes through (![]() ,
, ![]() ) and (
) and (![]() ,
, ![]() ).
).
Rate of change = \(\frac{?-?}{?-?}\)
= ![]()
So, the rate of change of the graph is ![]() .
.
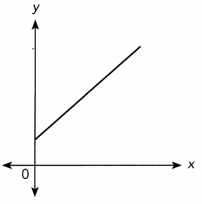
Answer:
Because the graph is a straight line, it represents a linear function.
The line passes through (0, 3) and (6, 8).
Rate of change = \(\frac{8-3}{6-0}\)
= 5/6
So, the rate of change of the graph is constant.
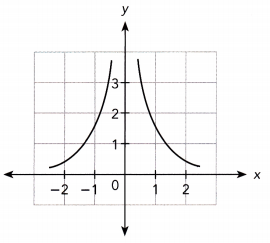
Question 4.
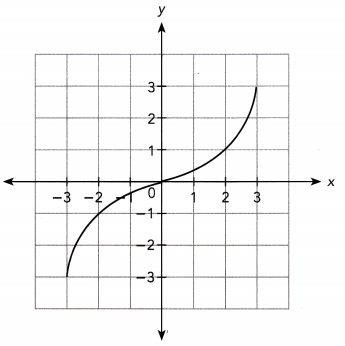
Because the graph is a ![]() , it represents a
, it represents a ![]() function.
function.
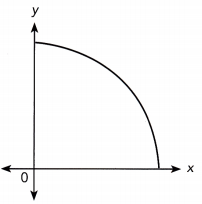
Answer:
Because the graph is a curve, it represents a non-linear function.
Describe the function. Sketch a graph for the function.
Question 5.
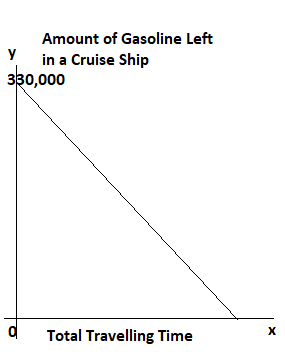
A cruise ship traveling at a constant speed consumes 4,000 gallons of gasoline per hour. When fully filled, it has a fuel capacity of 330,000 gallons. The amount of gasoline consumed, y gallons, is a function of the total traveling time, x hours.
a) Give the least possible input value and the corresponding output value. Tell whether the function is linear or nonlinear. Then tell whether the function is increasing or decreasing. Explain.
Answer:
At the beginning of the trip, the cruise ship has 330,000 gallons of gasoline.
So, the least possible input value is 0 and the corresponding output value is 330,000.
For every hour of traveling time, the cruise ship consumes 4,000 gallons of gasoline.
So, the rate of change of the function is constant.
As the total traveling time increases, the amount of gasoline left decreases.
Thus the function is a linear and decreasing function.
b) Sketch a graph for the function.
Answer:
Hands-On Activity
Materials:
number cards (from -5 to 5)
SKETCH LINEAR FUNCTIONS
Work in pairs.
STEP 1: Shuffle the cards and place them face down on the table.
STEP 2: Each player draws two cards. Use your cards to write an equation in slope-intercept form. Use one of the cards for the slope and one for the y-intercept of the equation.
For example:
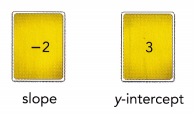
Slope-intercept form: y = -2x + 3
STEP 3: Graph the equation you wrote.
STEP 4: Copy and complete the table. For each equation that you and your partner write, record the slope, the y-intercept, and whether the function is increasing or decreasing.
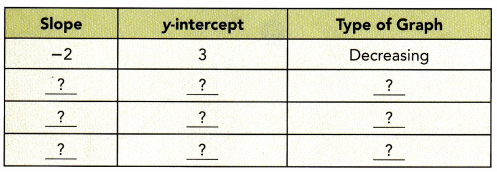
STEP 5: Repeat STEP 2 to STEP 4 until a player has written two equations that represent increasing functions and two equations that represent decreasing functions. If no player has done this, reshuffle the cards and repeat STEP 2 to STEP 4. The player who reaches this goal first wins the game.
Math Journal What can you conclude about the slope of the graph of an increasing function and the slope of the graph of a decreasing function? Explain.
Answer:
Math in Focus Course 3A Practice 6.3 Answer Key
Tell whether each table of values represents a linear or nonlinear function.
Question 1.
Answer: Linear function
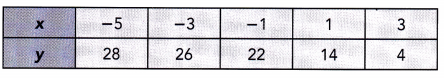
Question 2.
Answer:
Linear Function
Question 3.
Answer:
Non-linear function
Question 4.

Answer:
Tell whether each graph represents a linear function. If so, find the rate of change.
Question 5.
Answer:
Yes, 1/2
Question 6.
Answer: Non-linear and decreasing
Tell whether each function is linear or nonlinear. Then tell whether the function is increasing or decreasing.
Question 7.
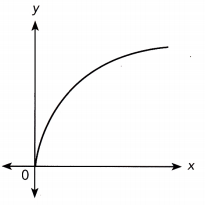
Answer:
Non-linear and increasing function
Question 8.
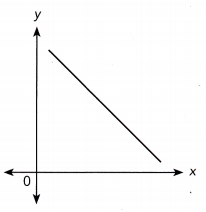
Answer: straight line and linear function
Question 9.
Answer: Non-linear and decreasing function
Question 10.
Answer: Straight line and linear function
Describe the function. Sketch a graph for the function.
Question 11.
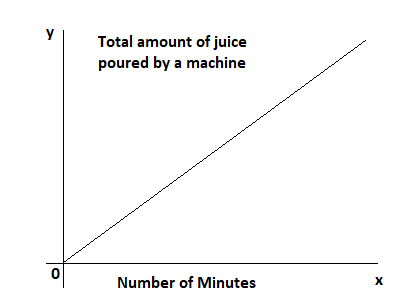
A machine at a factory pours juice into bottles at a constant rate of 6 liters per minute. The total amount of juice poured, y liters is a function of the number of minutes that the juice is poured, x.
a) Give the least possible input value and the corresponding output value. Tell whether the function is linear or nonlinear. Then tell whether the function is increasing or decreasing. Explain.
Answer:
If the time taken for the machine to pour juice into bottles is 0 min, the amount of juice poured will be 0L.
So, the least possible input value is 0 and the corresponding output value is 0.
Because the machine pours juice at 6L/min, the rate of change of the function is constant. As the time taken for the machine to pour juice into bottles increases, the amount of juice poured also increases.
Hence the function is a linear and increasing function.
b) Sketch a graph for the function.
Answer:
Question 12.
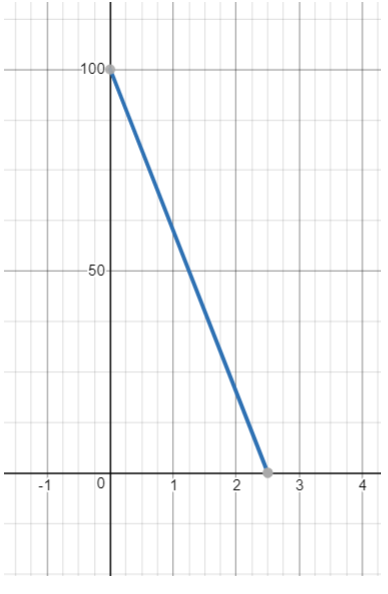
Aidan was 100 miles from Town P. He traveled to Town P by car at a constant speed. The distance from Town P, y miles, is a function of the traveling time, x hours.
a) Give the least possible input value and the corresponding output value. Tell whether the function is linear or nonlinear. Then tell whether the function is increasing or decreasing. Explain.
Answer:
When Aidan [eaves to Town P, the corresponding distance from his position to Town P is 100, therefore the least possible input value is 0 and the corresponding output is 100.
Because each hour he is driving by the same speed, the rate of change of the function is constant.
As time passes (the input increases), the distance to Town P (the output) decreases, so the function is decreasing.
Therefore the function is linear and decreasing.
b) Sketch a graph for the function.
Answer:
The distance to Town P starts at (0, 100) and falls from left to right The slope of the line, which is constant, is the distance traveLed each hour (the speed):
Solve. Use graph paper.
Question 13.
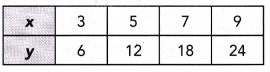
The table shows the number of students, y, as a function of the number of teachers, x.
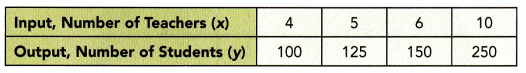
a) Tell whether the function is linear or nonlinear. Then tell whether the function is increasing or decreasing. Explain.
Answer:
The function has a constant rate of change, 25.
Thus it is a linear and increasing function.
As the number of students increases, the number of teachers also increases.
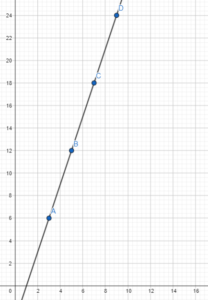
b) Graph the table of values and draw a line through the points. Use 1 unit on the horizontal axis to represent 1 teacher for the x interval, and 1 unit on the vertical axis to represent 25 students for the y interval from 100 to 250. Do the coordinates of every point on the line make sense for the function? Explain.
Answer:
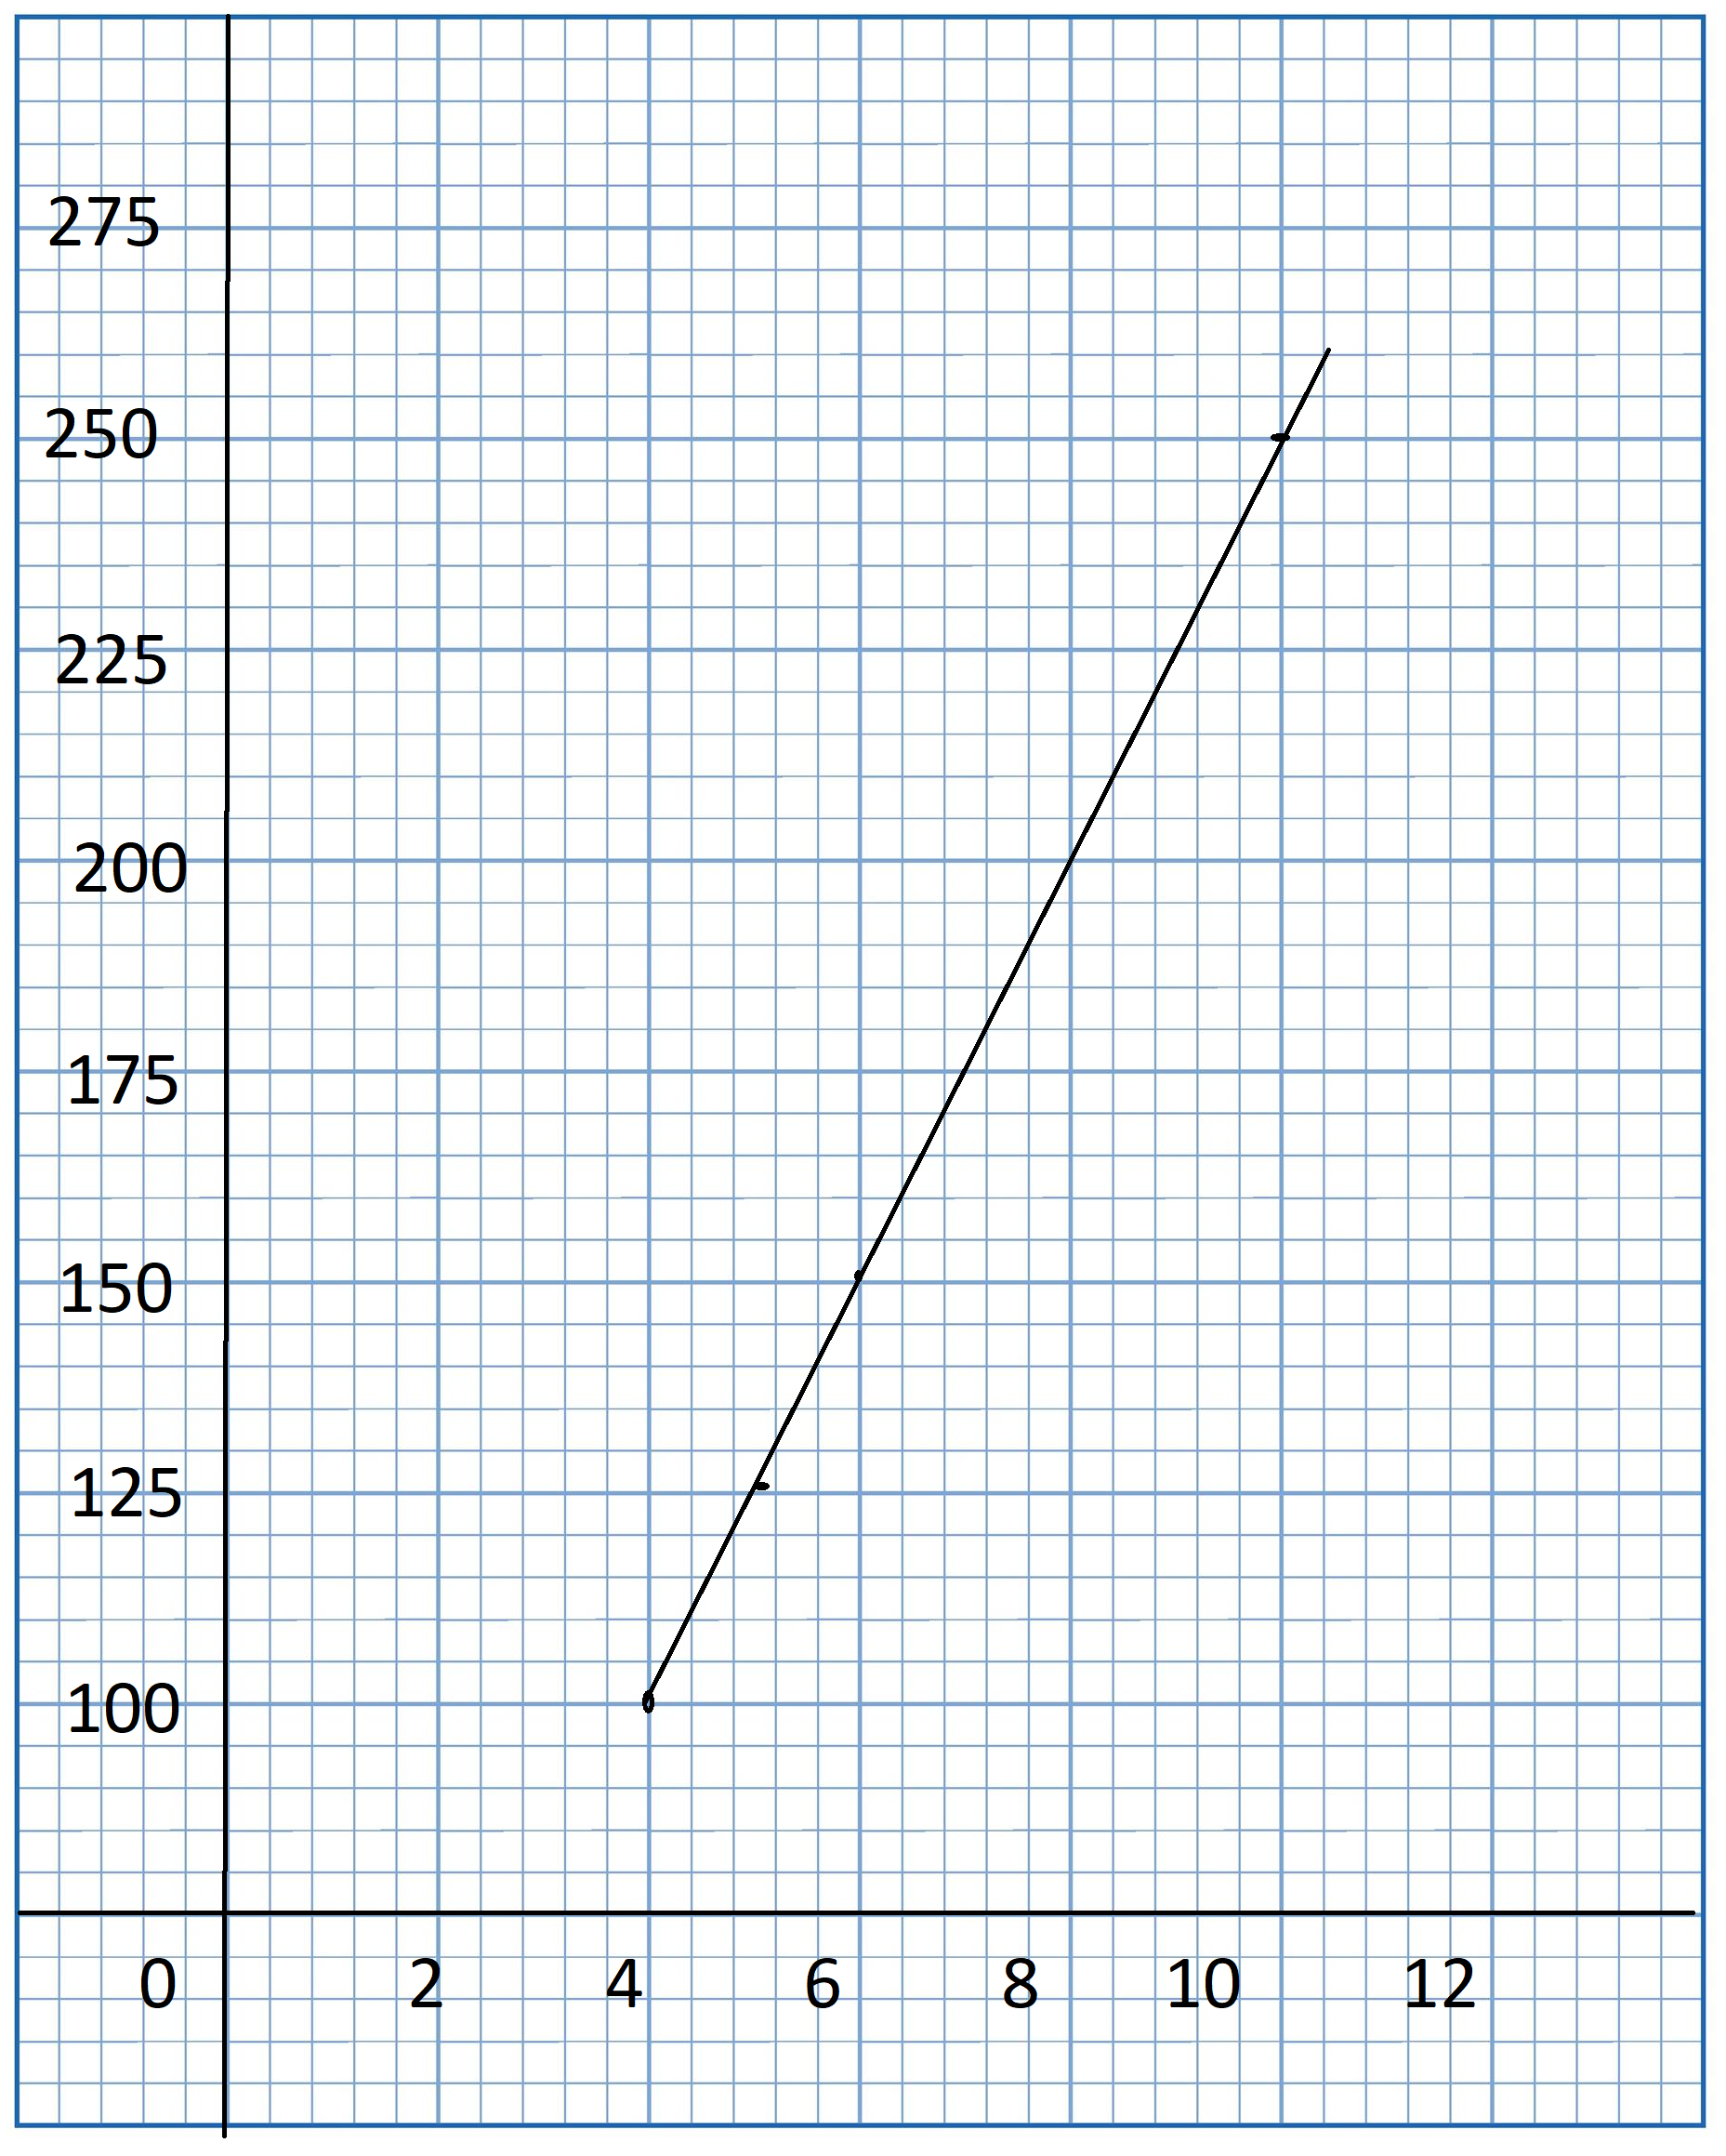
No, because the number of teachers and students must be whole numbers.
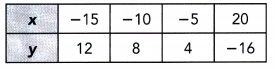
Question 14.
A cyclist starts riding from home to another town. His cycling speed, y miles per hour, is a function of the amount of time he takes to cycle, x hours.
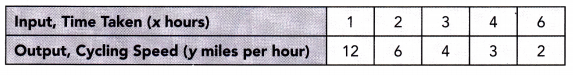
a) Tell whether the function is linear or nonlinear. Then tell whether the function is increasing or decreasing. Explain.
Answer:
Non-linear function and decreasing
b) Graph the table of values and draw a curve through the points. Use 1 unit on the horizontal axis to represent 1 hour for the x interval, and 1 unit on the vertical axis to represent 1 mile per hour for the y interval. Do the coordinates of every point on the curve make sense for the function? Explain.
Answer: