This handy Math in Focus Grade 8 Workbook Answer Key Chapter 10 Lesson 10.2 Modeling Linear Associations detailed solutions for the textbook questions.
Math in Focus Grade 8 Course 3 B Chapter 10 Lesson 10.2 Answer Key Modeling Linear Associations
Hands-On Activity
Materials:
measuring tape
CONSTRUCT AND INTERPRET SCATTER PLOTS
Work in groups of 5.
Background
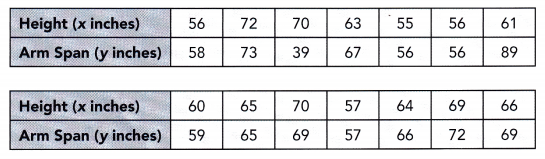
A person’s height is closely associated with their arm span. In a medical context, this association can be used to estimate realistic lengths for prosthetic limbs. In this activity, you will collect data on the heights and arm spans of classmates.
STEP 1: Measure the arm span of one group member while he or she is standing straight up against a wall with arms stretched out from the body and with all the fingers extended fully. Measure the arm span from the tip of the middle finger of one hand all the way to the other middle finger on the other hand.
STEP 2: While in the same position, use a ruler to mark the member’s height on the wall. While holding the ruler, ask the member to step away so you can measure the height.
STEP 3: Repeat STEP 1 and STEP 2 with the other group members.
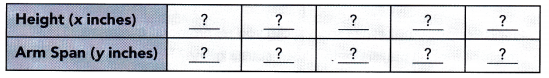
STEP 4: Organize the data in a table like the one shown below.
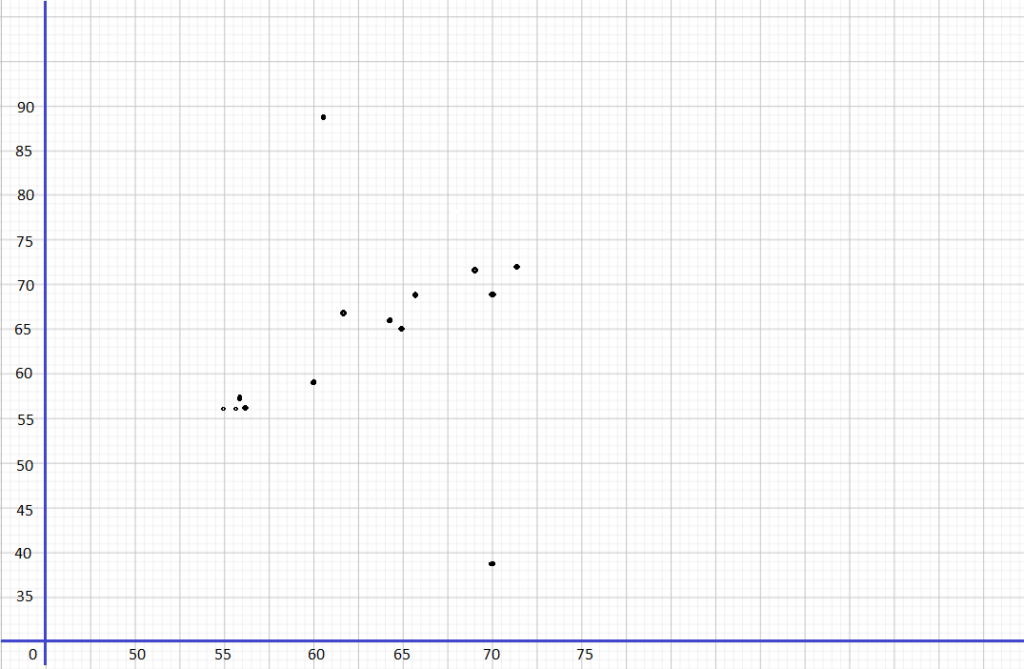
STEP 5: Collect data from all the groups. Construct a scatter plot with the collected data.
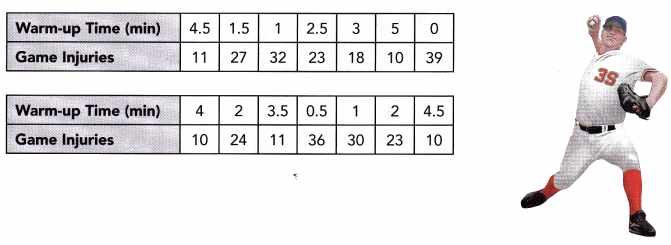
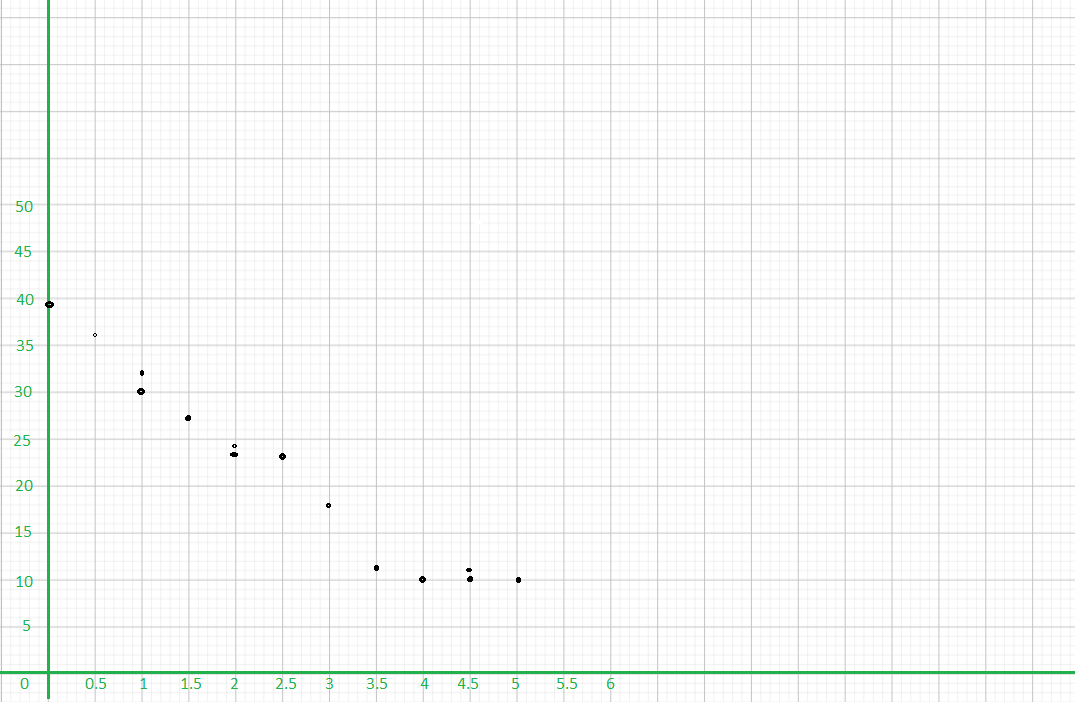
Math Journal From the scatter plot drawn, describe any association you see between the height and arms span.
Using the collected data, obtain a measure for the arm span of a schoolmate. Use the scatter plot to predict his or her height. Compare your estimations with the actual measurements to find how accurate the estimate is.
Answer:
Math in Focus Grade 8 Chapter 10 Lesson 10.2 Guided Practice Answer Key
Use graph paper. Solve.
Question 1.
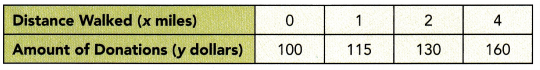
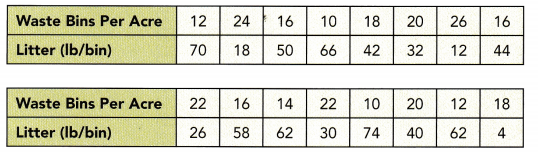
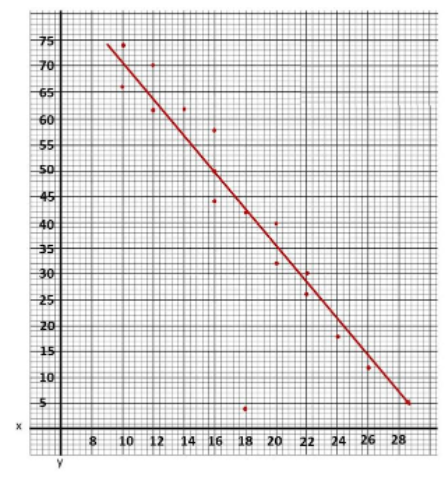
A city collected data over the course of a week to find the association between the number of waste bins per acre, x, in their parks and the pounds of litter collected, y pounds, in each bin. The data is shown below.
a) Construct a scatter plot for this data. Use 1 centimeter on the horizontal axis to represent 2 waste bins per acre for x interval from 8 to 26. Use 1 centimeter on the vertical axis to represent 5 pounds of litter per week. Sketch a line of best fit for the given table of data.
Answer:
Observe that
- 12 bins per acre corresponds to 70 lbs of litter,
- 24 waste bins has 18 pounds of trash,
- 16 waste bins per acre means 50 Lbs. of garbage,
- 10 bins per acre, 66 pounds of litter are coLlected,
- 18 bins per acre corresponds to 42 lbs. of Litter,
- 20 waste bins has 32 pounds of trash,
- 26 waste bins per acre means 12 lbs. of garbage,
- 16 bins per acre, 44 pounds of litter are collected,
- 22 bins per acre corresponds to 26 lbs. of Litter,
- 16 waste bins has 58 pounds of trash,
- 14 waste bins per acre means 62 Lbs. of garbage,
- 22 bins per acre, 30 pounds of litter are collected,
- 10 bins per acre corresponds to 74 lbs. of litter,
- 20 waste bins has 40 pounds of trash,
- 12 waste bins per acre means 62 Lbs. of garbage, and
- 18 bins per acre, 4 pounds of Utter are coLLected.
Note that the Line of best fit is a straight line that best shows the data on a scatter plot Therefore, the scatter plot would be as depicted below.
b) Identify the association and describe the meaning of the association in context.
There is a  , , and association between the number of waste bins per acre and the pounds of litter collected per bin.
Answer:
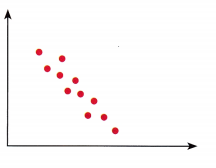
The scatter plot shows a strong, negative and linear association which indicates that the more waste bins per acre in the city the lesser the pounds of litter collected.
c) Identify the outlier and describe the outlier in context.
The data point (, ) is an outlier representing only pounds of litter collected per bin when there are waste bins per acre in the park.
Answer:
The outlier is the data that is very different from the rest in a set Notice the outlier is the point that is away from then line, in this case, observe the best-fit line, then the point isolated to it is at (18, 4). The outlier represents 18 waste bins per acre and a litter of 4 pounds.
Question 2.
A city collected data to find the association between the daily high temperature, x °F, and the number of pool visitors, y, that day. The data is shown below.
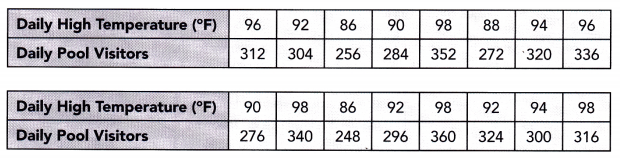
Construct a scatter plot for this data. Use 1 centimeter on the horizontal axis to represent 2°F on the x interval from 84 to 98. Use 1 centimeter on the vertical axis to represent 10 pool visitors on the y interval from 220 to 360. Sketch a line that appears to best fit the data and write its equation.
Answer:
The objective is to make a scatter plot daily high temperature and daily pool visitor, give the line of best fit for the scatter plot and the equation for it
Observe that when the temperature is 96 F the pool visitors are 312. a 92° F temperature in the city makes 304 visitors, the city has 256 pool visitors when the temperature is at 86°F, when the temperature is 90° the pool visitors are 284, a 98°F temperature in the city makes 332 visitors, the city has 88 pool visitors when the temperature is at 272°F, when the temperature is 94°F the pool visitors are 320. a 96°F temperature in the city makes 336 visitors, the city has 276 pool visitors when The temperature is at 90°F, when the temperature is 98°F the pool visitors are 340, a 86 F temperature in the city makes 248 visitors, the city has 296 pool visitors when The temperature is at 92°F, when the temperature is 98°F the pool visitors are 360, a 92°F temperature in the city makes 324 visitors, the city has 300 pool visitors when The temperature is at 94°F, and when the temperature is 9W F the pool visitors are 316. Also, note that the line of best fit is the most possibLe straight line that best shows The data on a scatter plot Thus, the scatter plot will be as depicted below.
For the equation of the Line of best fit, first, use points that the best fit line passes through, (86, 248) and (92, 296), to solve for the slope of the line. The slope of the line equates the difference of y2 to y1 over the difference of x2 to x1. Then, Let in be the slope, (86, 248) be (x1, y1) and (92, 296) be (x2, y2) so
m = \(\frac{y_{2}-y_{1}}{x_{2}-x_{1}}\) Slope Formula.
= \(\frac{296-248}{92-86}\) Substitution.
= \(\frac{48}{6}\) Subtract.
= 8 Simplify.
Next, use the slope-intercept form to determine the equation of the straight line given by y = mx + b, where in is the slope, b is the y-intercept, and (86, 248) be (x, y) then
y = mx + b Slope-intercept Form.
248 = 8(86) + b Substitution.
248 = 688 + b Multiply.
248 – 688 = 688 + b – 688 Subtract both sides by 688
-440 = b Simplify.
Lastly, using the slope-intercept form again, let m be the sLope equals to 8 and b equals to -440, thus
y = mx + b Slope-intercept Form.
y = 8x – 440 Substitution.
Therefore, the equation of the line of best fit is y = 8x – 440.
Question 3.
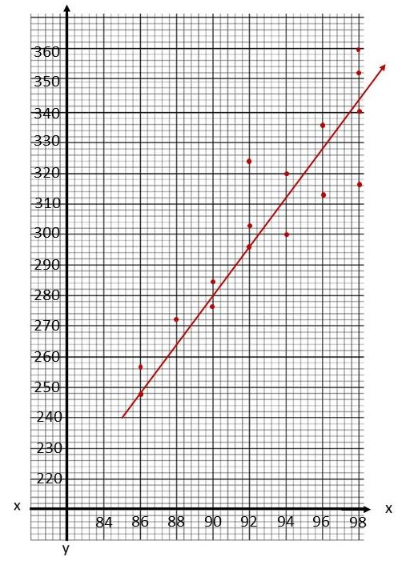
The scatter plot below shows the number of eggs hatched, y, per 100 eggs in an incubator with varying temperatures, x°F.
a) Given that the line of best fit passes through (80, 41) and (95, 68), find the equation of the line of best fit.
First find the slope of the line of best fit that passes through the points (80, 41) and (95, 68).
m = \(\frac{?-?}{?-?}\) = \(\frac{?}{?}\) =
Next find the y-intercept using the equation in slope-intercept form
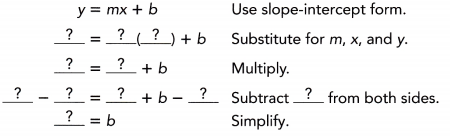
Finally, write an equation,
y = mx + b
y = x + Substitute for m and for b.
The equation of the line of best fit is .
Answer:
a. To find the equation of the Line, compute for the slope of the Line then substitute it in the slope-intercept form together with one of the points that the line of best fit passes through. From here, b wilL be solved then use the slope-intercept form again substituting only the slope m and y-intercept b.
Determining the slope of the line, let (80. 41) be x1 and y1 while (95, 68) be x2 and y2. Then,
m = \(\frac{y_{2}-y_{1}}{x_{2}-x_{1}}\) Formula.
= \(\frac{68-41}{95-80}\) Substitution.
= \(\frac{27}{15}\) Subtract.
= 1.8 Simplify.
Now, let (80, 41) be (x, y), and since the slope is equal to 1.8, then,
y = mx + b Formula.
41 = 1.8(80) + b Substitution.
41 = 144 + b Multiply.
41 – 144 = 144 – 144 + b Subtract 144 From Both Sides.
103 = b Evaluate.
Since m is equal to 1.8 and b is equal to -103, then
y = mx + b Slope-Intercept Form.
y = 1.8x + (-103) Substitution.
y = 1.8x – 103 Simplify.
Therefore, the equation of the line is y = 1.8x – 103.
b) Use the graph to estimate the number of eggs that would hatch per 100 eggs if the temperature of the incubator is kept at 86°F.
About eggs could be predicated to hatch if the incubator is kept at a temperature of .
Answer:
To estimate the number of hatched eggs x and the temperature of the incubator y, study the graph then note at what point does y at 86°F meets x. The point is on (52, 86). Therefore, there are 52 eggs wilt be hatched at 81°F
c) Use the equation to estimate the number of eggs that would hatch per 100 eggs if the temperature of the incubator is kept at 65°F.
Using the equation , substitute for x.
y = • – =
About eggs could be expeced to hatch when the temperature of the incubator is kept at 65°F.
Answer:
To compute the number of eggs hatched at 65°F, note that the equation of the line is y = 1.8x + b, the number of hatched eggs is denoted as y, and temperature of The incubator denoted as x. So let x be 65°F.
y = 1.8x – 103 Formula.
y = 1.8(65) – 103 Substitution.
y = 117 – 103 Multiply.
y = 14 Subtract.
Therefore, there will be 14 hatched eggs at 65°F.
Technology Activity
Materials:
graphing calculator
USE A GRAPHING CALCULATOR TO GRAPH A LINE OF BEST FIT FOR A SCATTER PLOT
Background
In the Hands-On Activity on page 186, you drew a scatter plot for the data on the heights and arm spans of all the groups. In this activity, you will learn how to construct a scatter plot and graph the line of best fit using a graphing calculator.
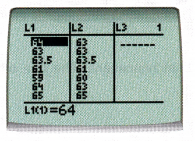
STEP 1: Press  and select 1 : Edit to choose the edit function. Input the data for arm spans in column L1 and the data for heights in column L2. You should have at least 20 data points to interpret the data accurately.
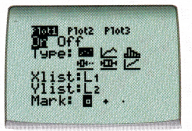
STEP 2: Press  , and select 1 to go to the scatter plot setting screen. Under Type, select the scatter plot options as shown.
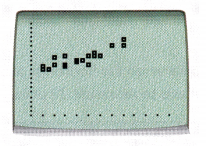
STEP 3: Press  to see the scatter plot.
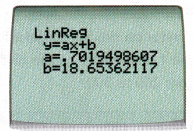
STEP 4: Press and select CALC, 4: LinReg(ax+b). Press  select Y-VARS, 1 : Function and 1 :Y1. Press This step is to find the values of m and b for the line of best fit. In the graphing calculator, the value of m is denoted by a.
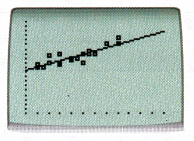
STEP 5: Press to see the scatter plot and the line of best fit. Press  and select 9: ZoomStat to zoom in the graph.
Math Journal Compare the hand drawn scatter plot and the one drawn using graphing calculator. Is there any difference between the line of best fit drawn by hand and by the graphing calculator? Compare both sets of m and b values. Discuss how you can plot a better line of best fit based on the m and b values obtained using the graphing calculator.
Answer:
Math in Focus Course 3B Practice 10.2 Answer Key
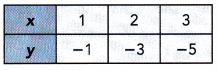
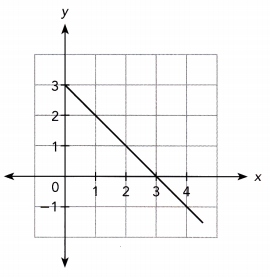
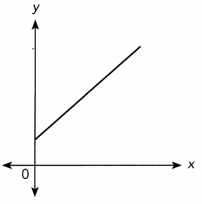
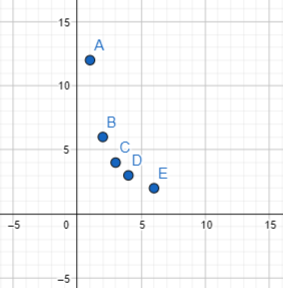
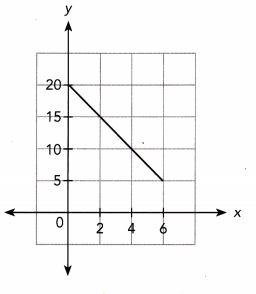
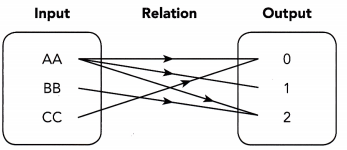
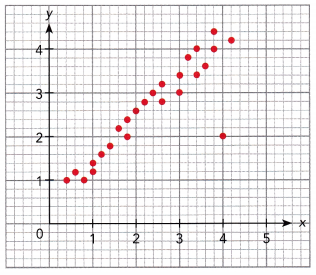
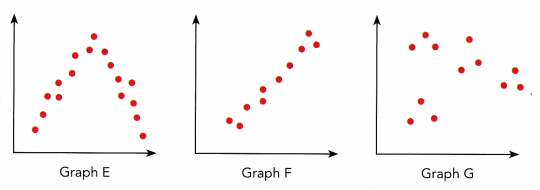
State the line that represents the line of best fit for each scatter plot.
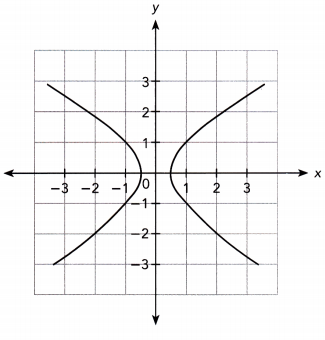
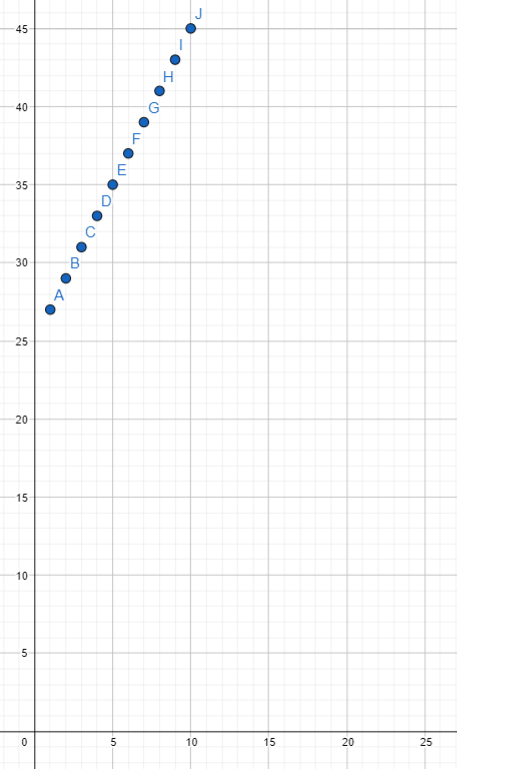
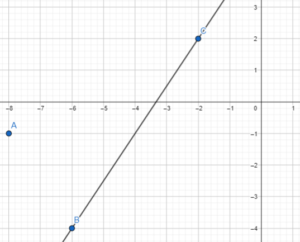
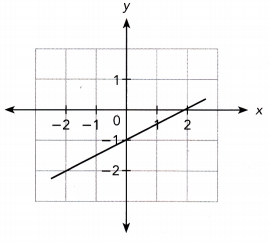
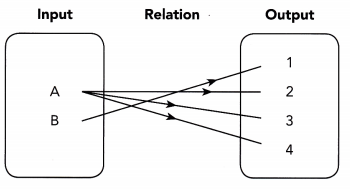
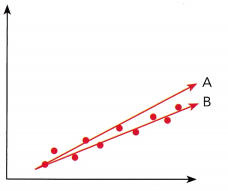
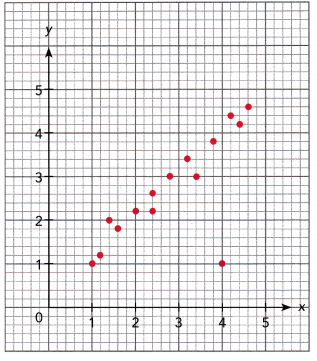
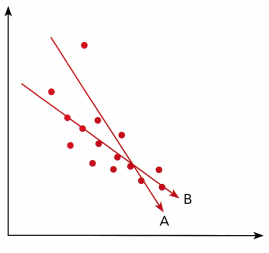
Question 1.
Answer:
The goal of this task is to determine the Line of best fit for the scatter plot.
Line B best fits the scatter plot It is the more possible straight line that best shows the data on a scatter plot compared to Line .4.
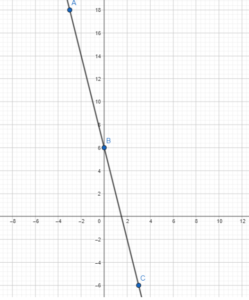
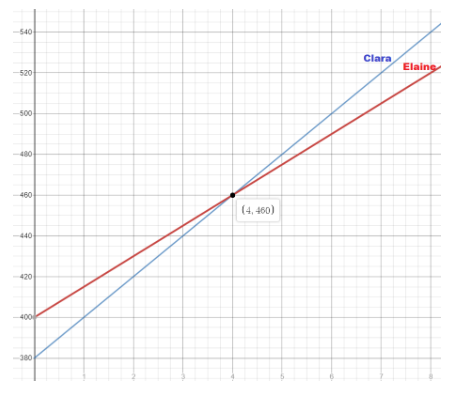
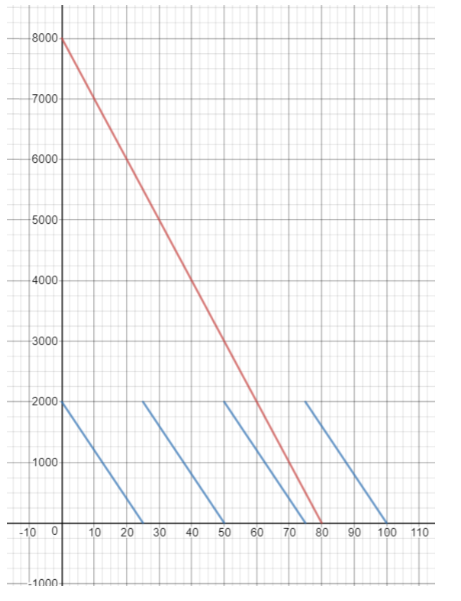
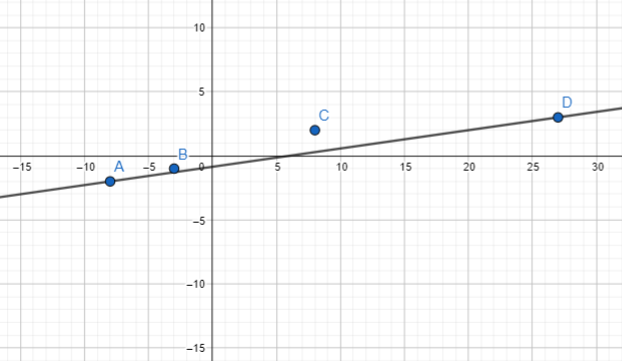
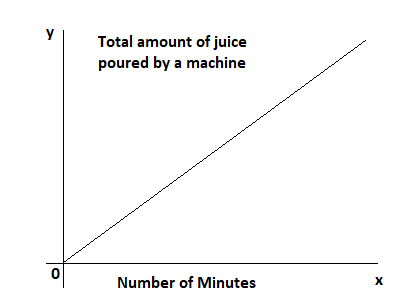
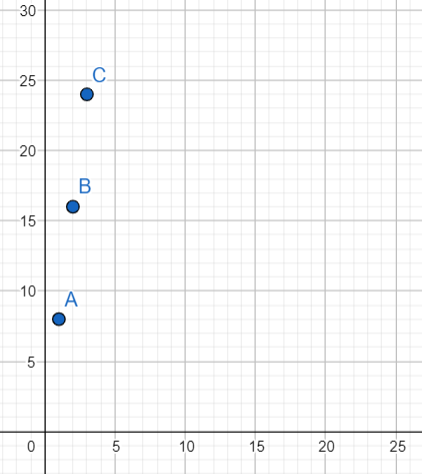
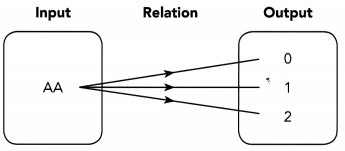
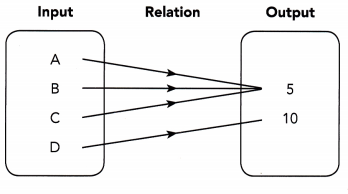
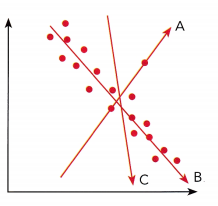
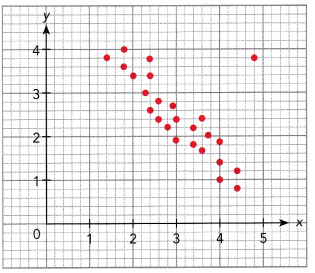
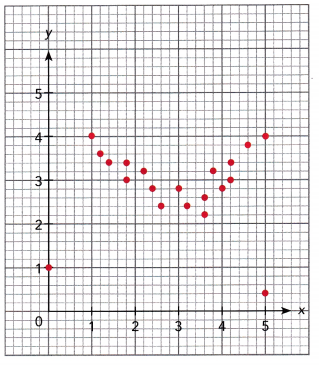
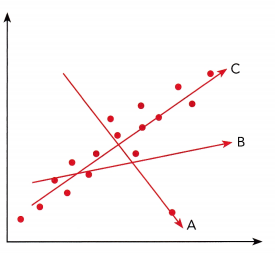
Question 2.
Answer:
The objective of this task is to determine the tine of best fit for the scatter plot.
Line C best fits the given scatter plot It is the most possible straight line that best shows the data on a scatter plot in comparison to line 4 and line B.
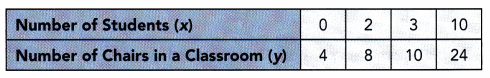
Construct each scatter plot and draw a line of best fit for each table of bivariate data.
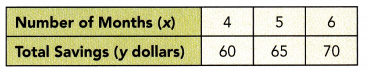
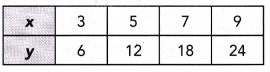
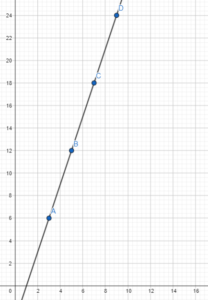
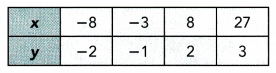
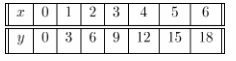
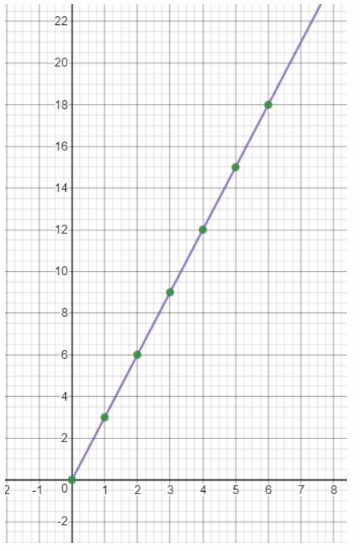
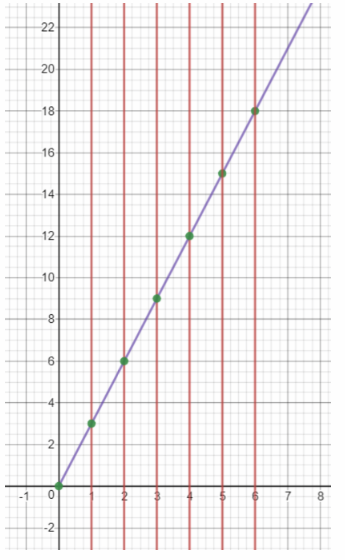
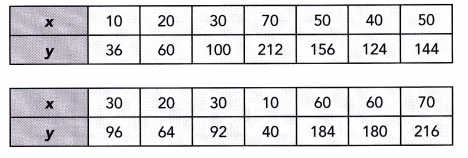
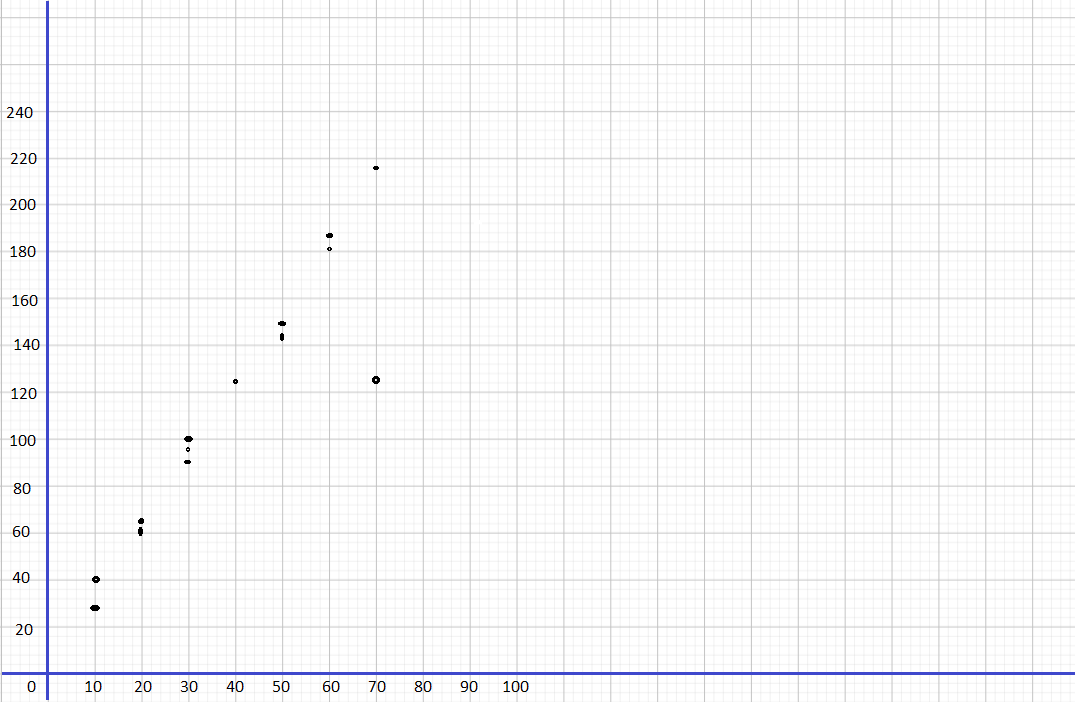
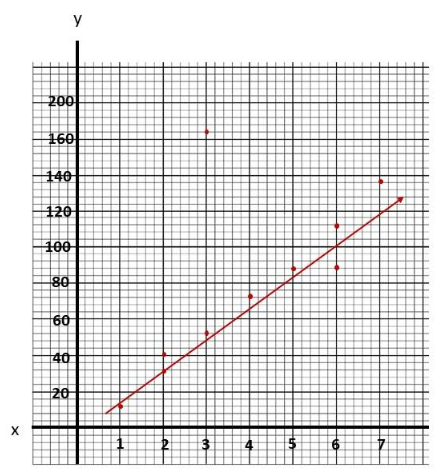
Question 3.
Use 1 centimeter on the horizontal axis to represent 1 unit. Use 1 centimeter on the vertical axis to represent 20 units.
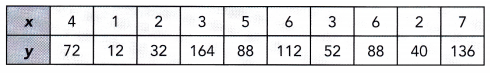
Answer:
The target of this task ¡s to make a scatter plot from the given values of r and y and the tine of best fit for the scatter plot.
Notice that when x is 4 y is 72, if x is equal to 1 y is equal to 12, when is equal to 2 y is 32, if z is 3 y is equal to 164, the value of y is 88 when z is 5. when z is 6 y is 112, if z is equal to 3 y is equal to 52, when z is equal to 6 y is 88, if z is 2 y is equal to 40, and the vaLue of y is 136 when z is 7. Also, the line of best fit is the most a possible straight line that best shows the data on a scatter plot Thus, the scatter plot will be as depicted below.
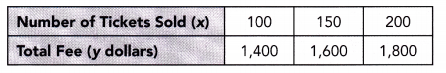
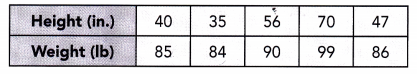
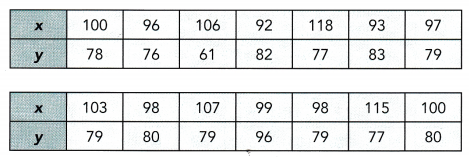
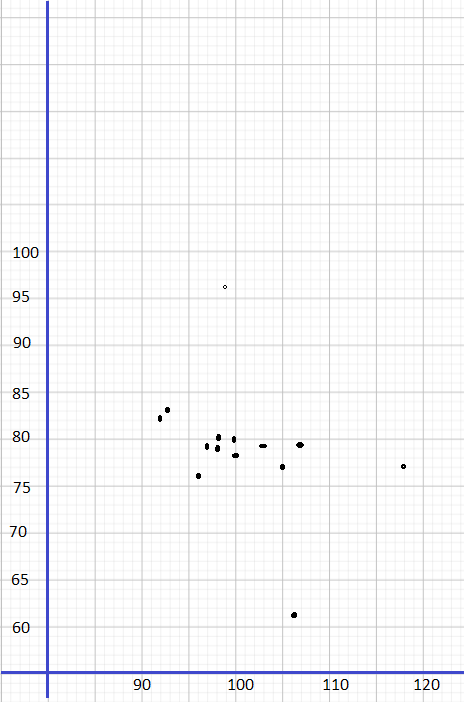
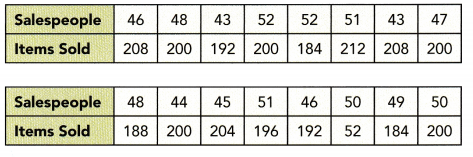
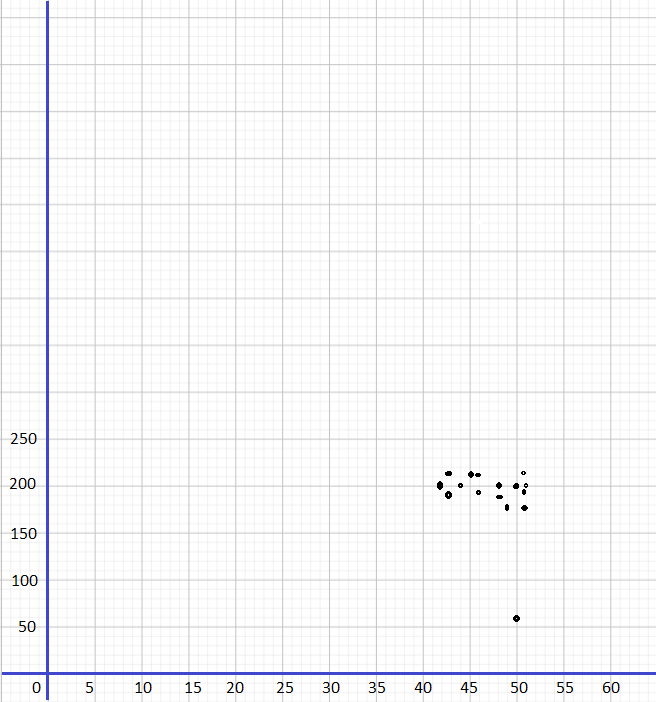
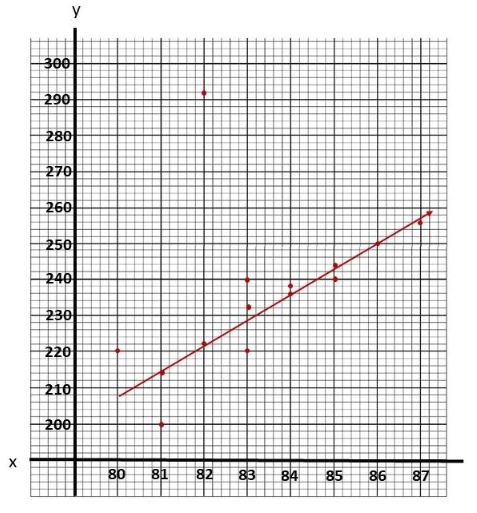
Question 4.
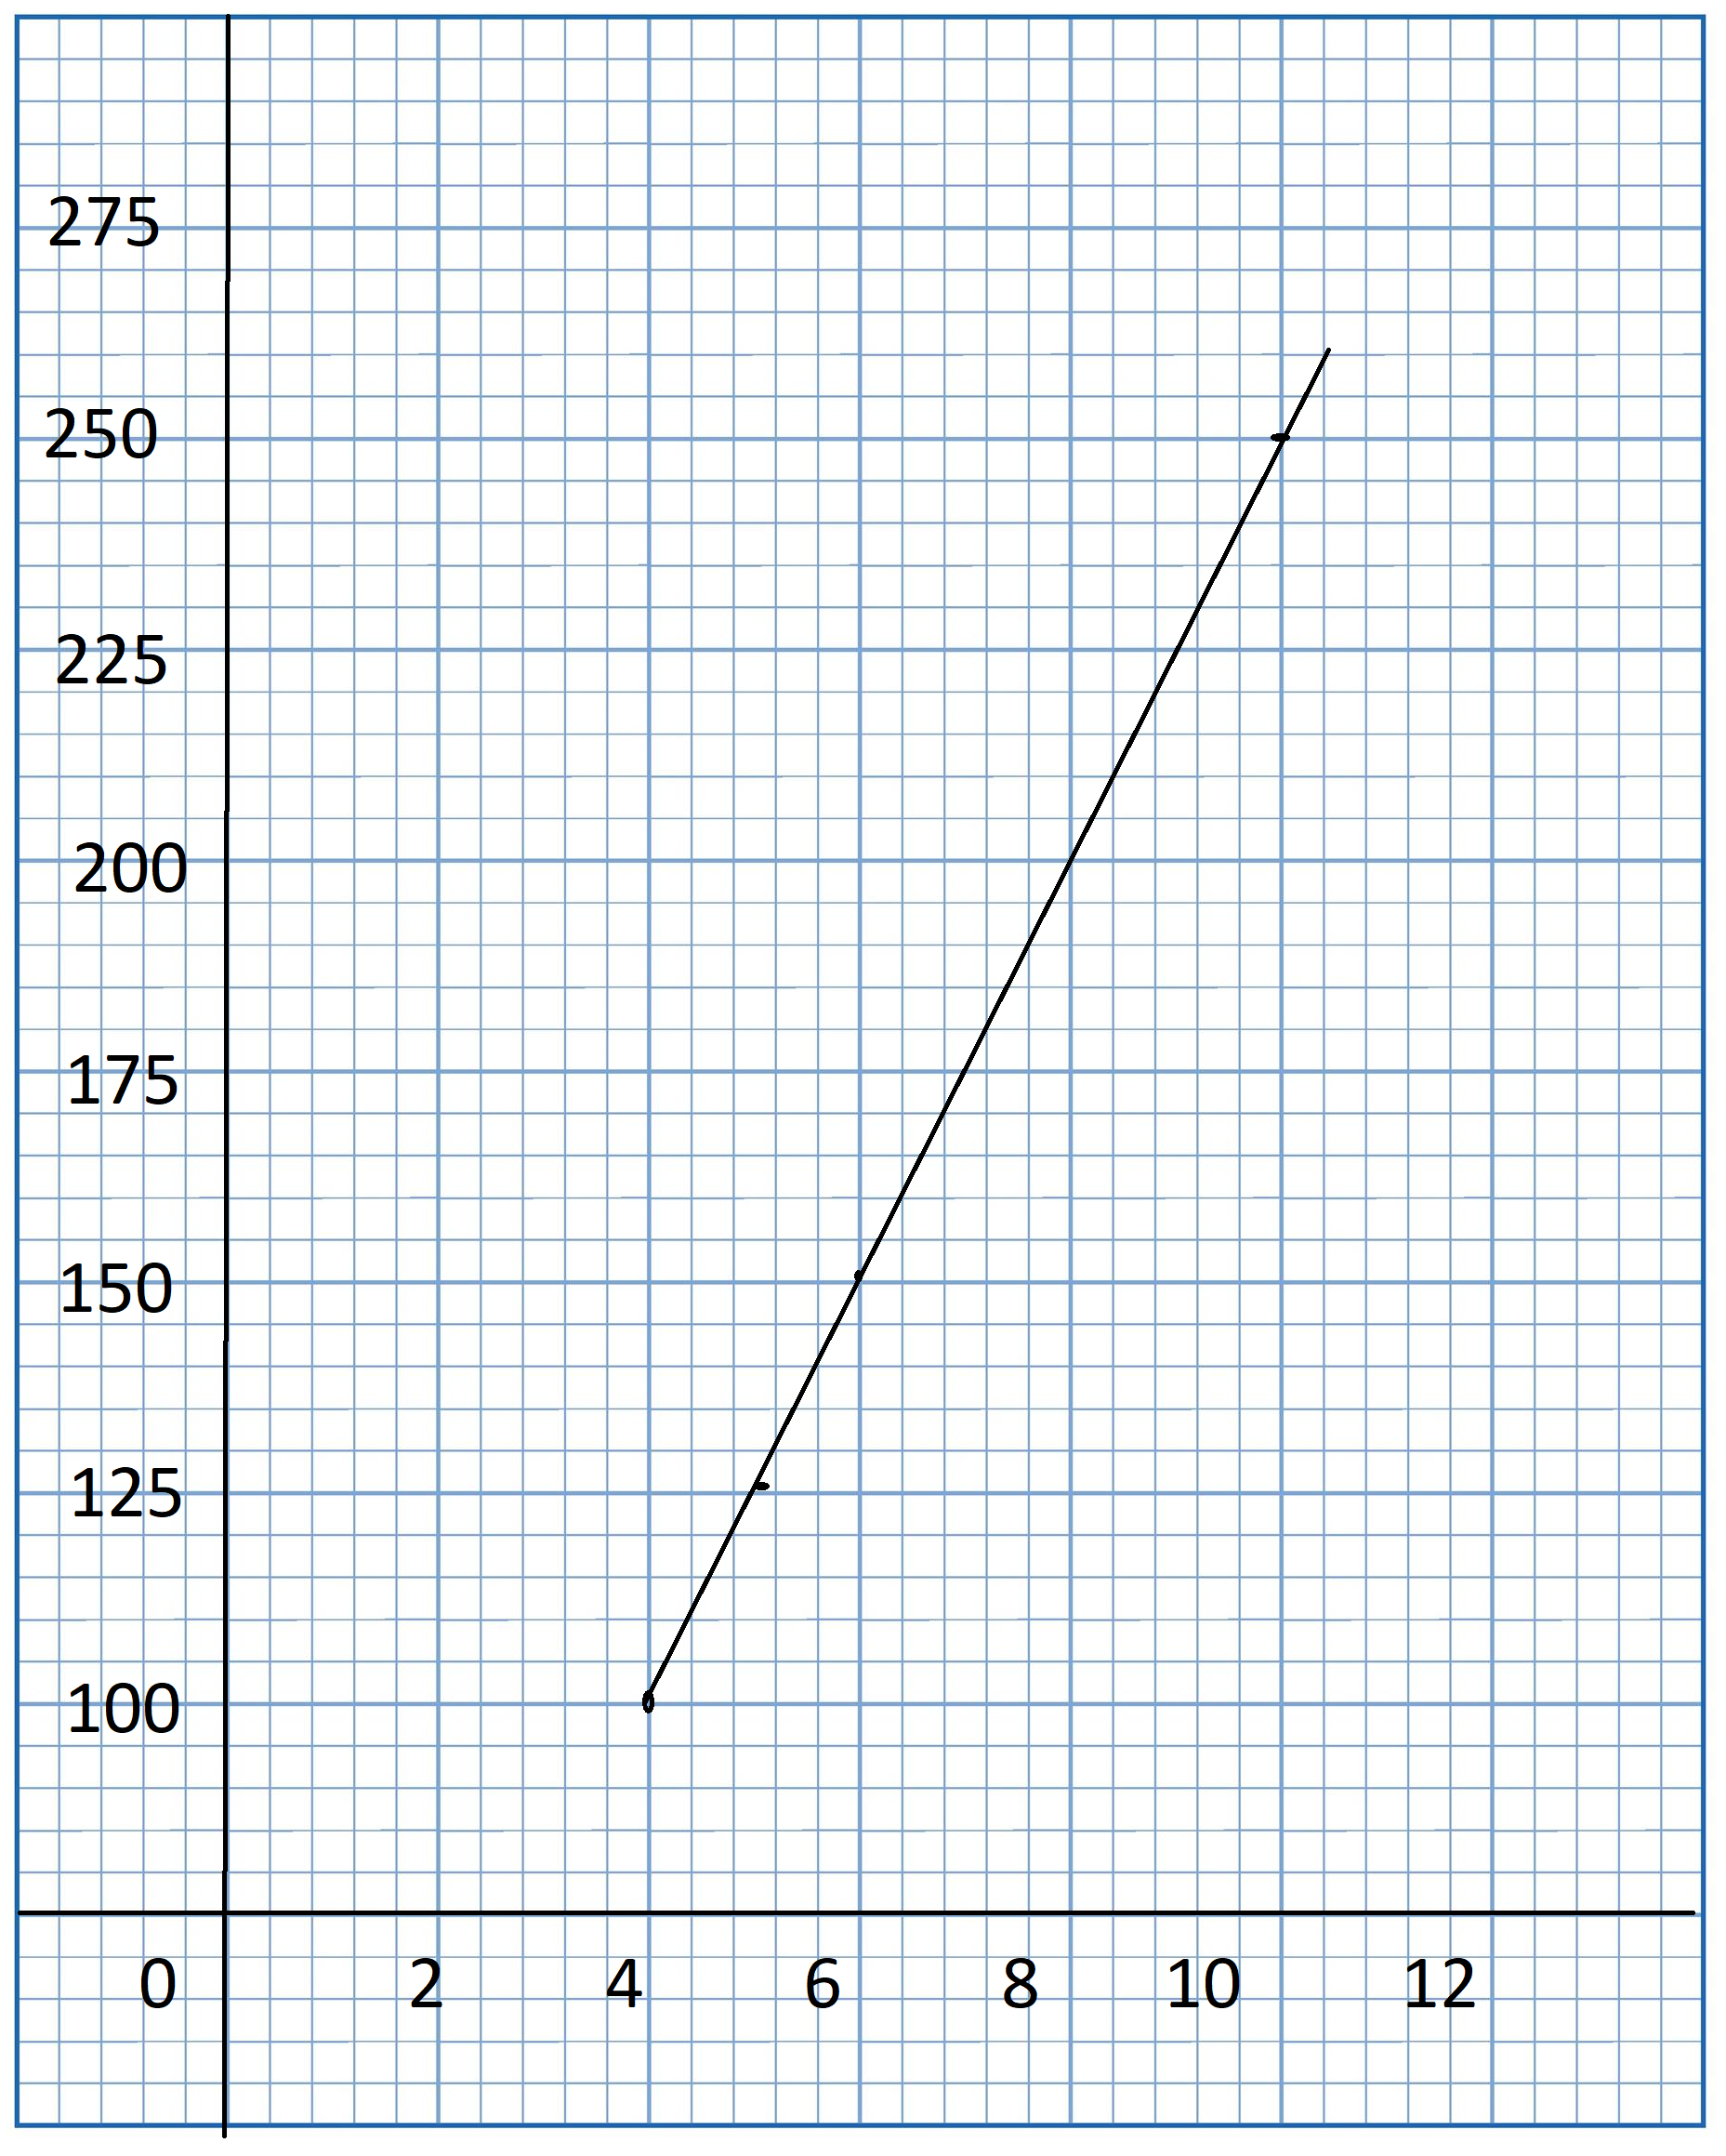
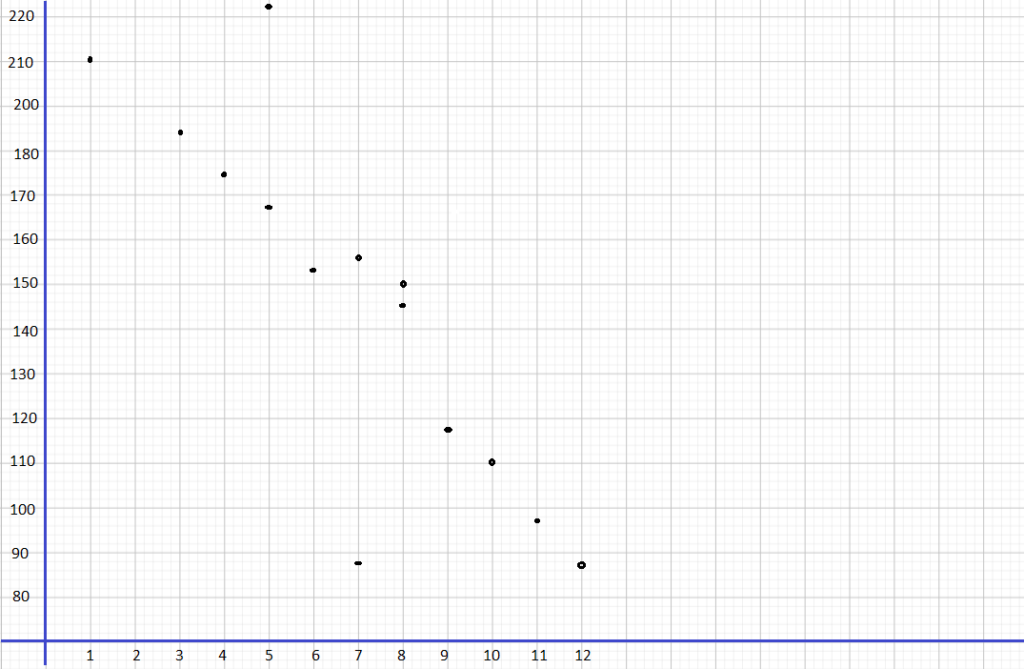
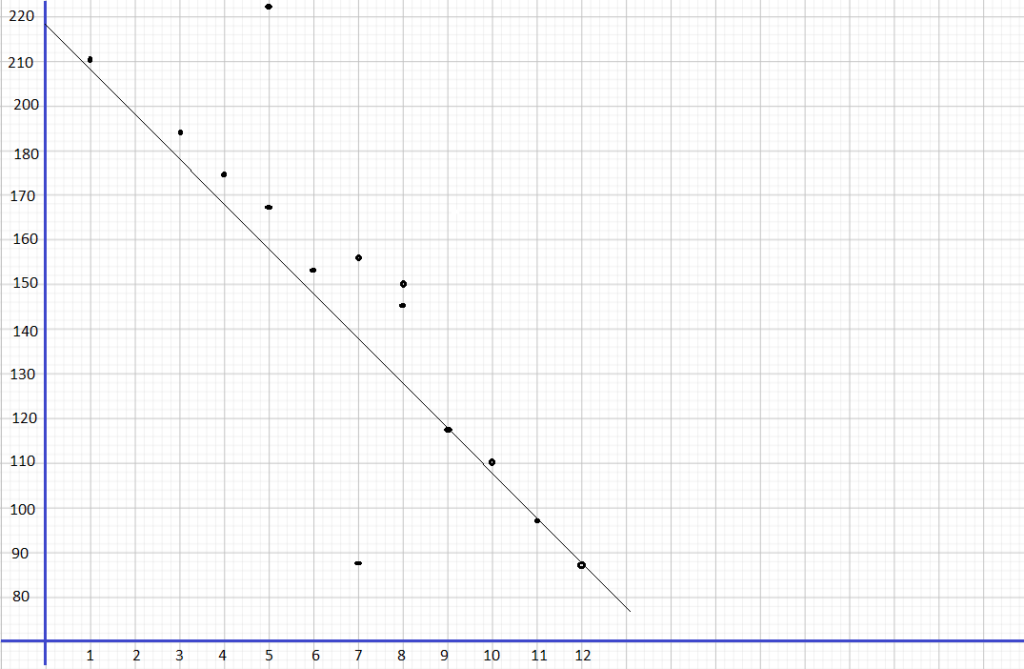
Use 1 centimeter on the horizontal axis to represent 1 unit for the x interval from 80 to 87. Use 1 centimeter on the vertical axis to represent 10 units for the y interval from 200 to 300.
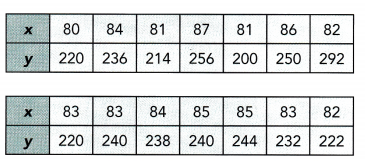
Answer:
The goal is to make a scatter plot from the given values of z and y and the line of best fit for the scatter plot.
Notice that when z is 80 y is 220, if z is equal to 84 y is equal to 236, when z is equal to 81 y is 214, if z is 87 y is equal to 256, the value of y is 200 when z is 81, when z is 86 y is 250, if z is equal to 82 y is equal to 292, when z is equal to 83 y is 220, if z is 83 y is equal to 240, the value of y is 238 when z is 84. when z is 85 y is 240, x is equal to 85 y is equal to 244, when z is equal to 83 y is 232 and if z is equal to 82 y is equal to 222. Also, the line of best fit is the most possible straight line that best shows the data on a scatter plot Thus, the scatter plot wilt be as depicted below.
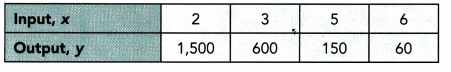
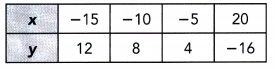
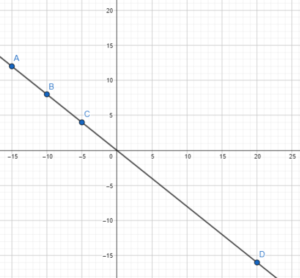
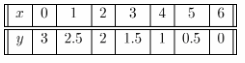
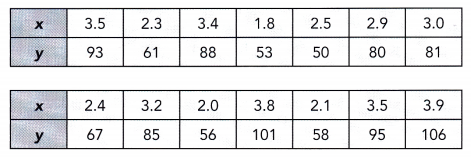
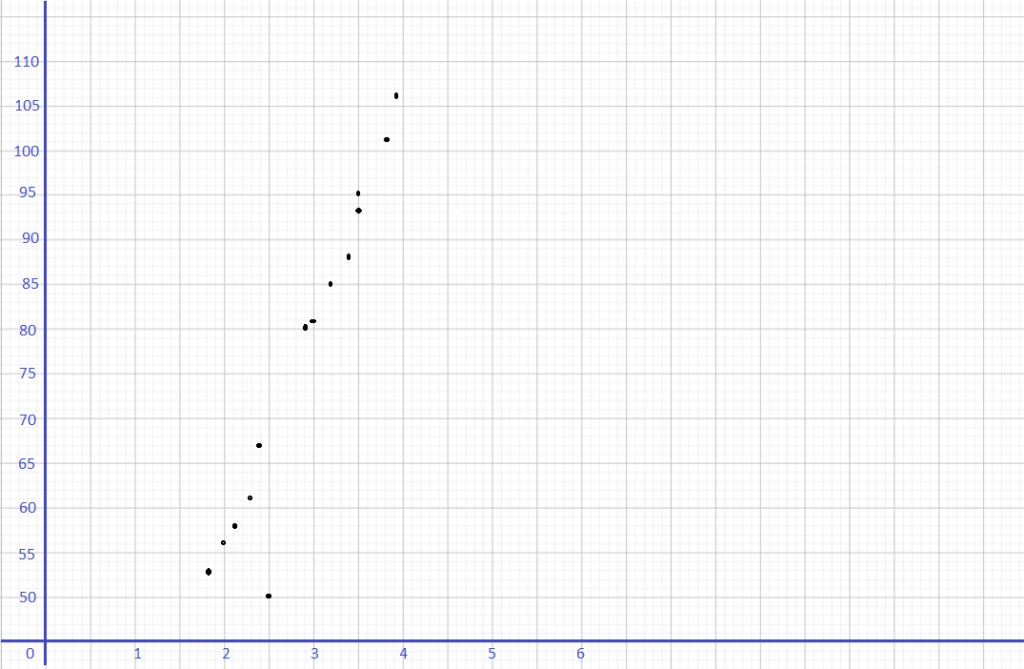
Question 5.
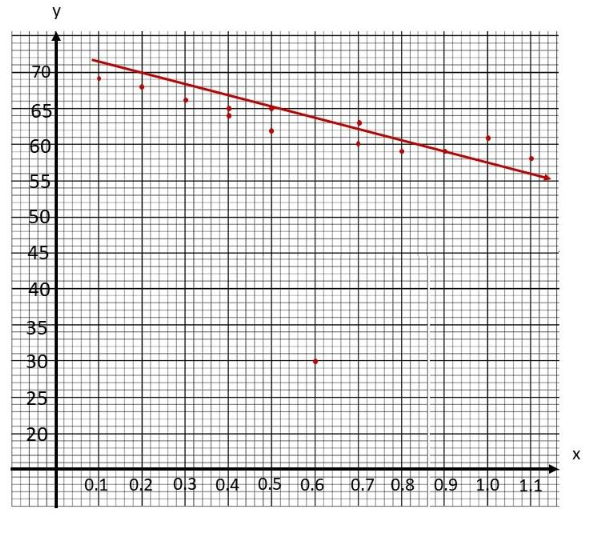
Use 1 centimeter on the horizontal axis to represent 0.1 unit. Use 1 centimeter on the vertical axis to represent 5 units for the y interval from 20 to 70.
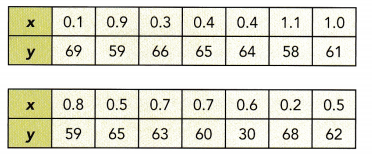
Answer:
The objective is to make a scatter plot from the given values of x and y and the line of best fît for the scatter plot
Notice that when r is 0.1 y is 69, if x is equal to 0.9 y is equal to 59, when x is equal to 0.3 y is 66, if x is 0.4 y is equal to 65, the value of y is 64 when x is 0.4, when x is 1.1 y is 58, if z is equal to 1.0 y is equal to 61, when x is equal.to 0.8 y is 59, if x is 0.5 y is equal to 65, the value of y is 63 when x is 0.7, when x is 0.7 y is 60, if x is equal to 0.6 y is equal to 30, when x is equal to 0.2 y is 68 and if x is equal to 0.5 y is equal to 62. Also, the line of best fit is the most possible straight line that best shows the data on a scatter plot Thus, the scatter plot will be as depicted below.
Construct a scatter plot and draw a line of best fit for each table of bivariate data. Find an equation of the line of best fit.
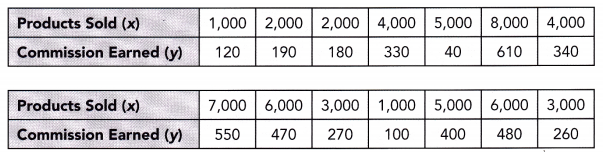
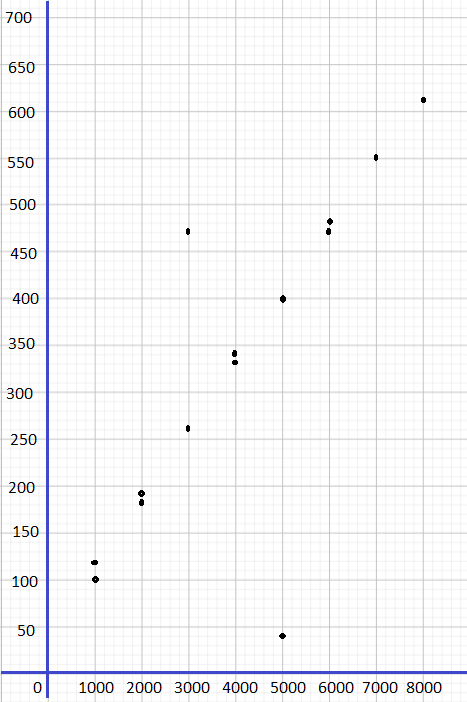
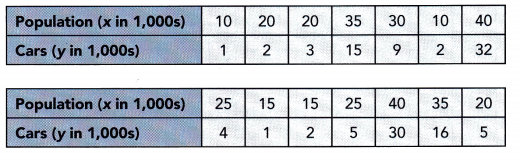
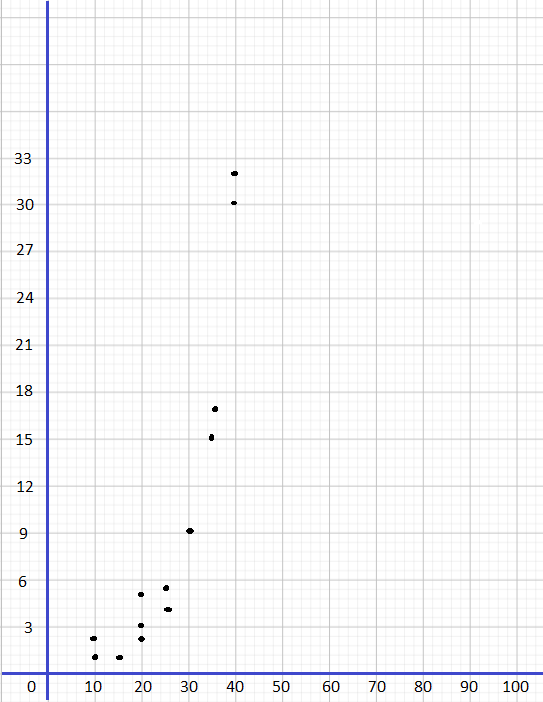
Question 6.
Use 2 centimeters on the horizontal axis to represent 1 tree for the x interval from 13 to 18. Use 1 centimeter on the vertical axis to represent 20 squirrels for the y interval from 260 to 480.
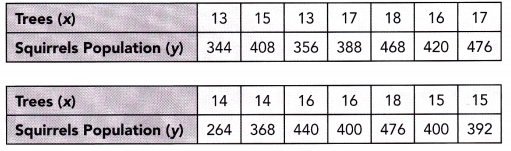
Answer:
The task is to make a scatter plot and give the tine of best fit for the number of trees and the population of squirrels then determine the equation of the line.
For the scatter plot determine at which point does the number of trees x meets its corresponding population of the squirrel y according to the table. For the tine of best fit, note that it is the most possible straight line that best shows the data on a scatter plot Thus, the scatter plot will be as depicted below.
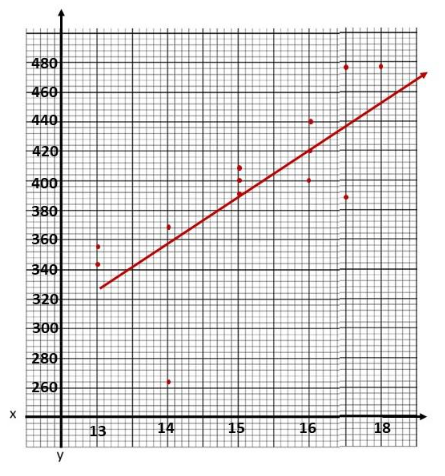
For the equation of the line of best fit, use points that the best fit Une passes through, (15. 392) and (16, 420). to solve for the slope of the line. The slope of the line equates the difference of y2 to y1 over the difference of x2 to x1. Then, let m be the slope, (15, 392) be (x1, y1) and (16, 420) be (x2, y2) so
m = \(\frac{y_{2}-y_{1}}{x_{2}-x_{1}}\) Formula.
= \(\frac{420-392}{16-15}\) Substitution.
= \(\frac{28}{1}\) Subtract.
= 28 Simplify.
Next use the slope-intercept form to determine the equation of the straight line given by y = mx + b, where ni is the slope, b is the y-intercept, and (15, 392) be (x, y) then
y = mx + b Slope-intercept Form.
392 = 28(15) + b Substitution.
392 = 420 + b Multiply.
392 – 420 = 420 + b – 420 Subtract both sides by 420
-28 = b Simplify.
Lastly, using the slope-intercept form again, let rn be the slope equals to 28 and b equals to -28. thus
y = mx + b Slope-intercept Form.
y = 28x – 28 Substitution.
Therefore, the equation of the Une of best fit is y = 28x – 28.
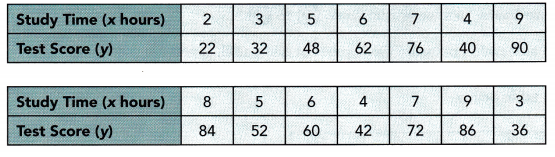
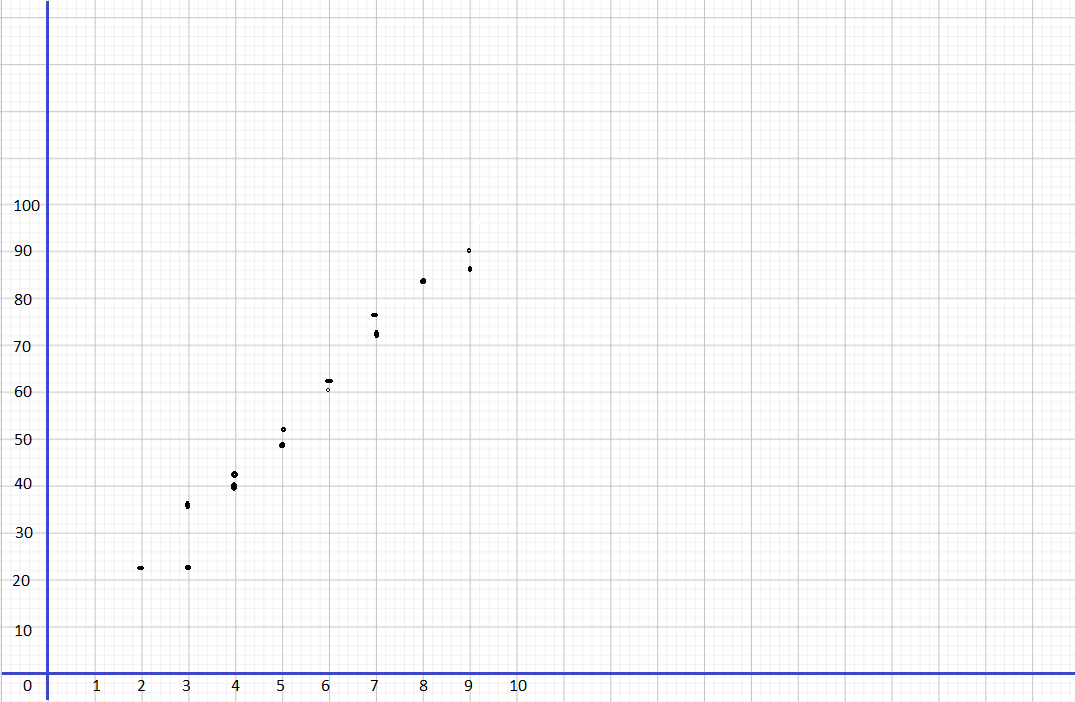
Question 7.
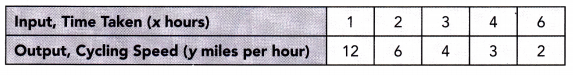
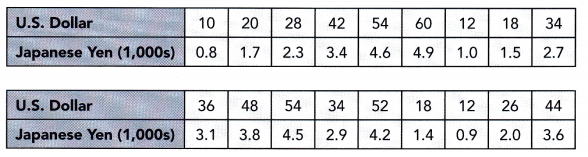
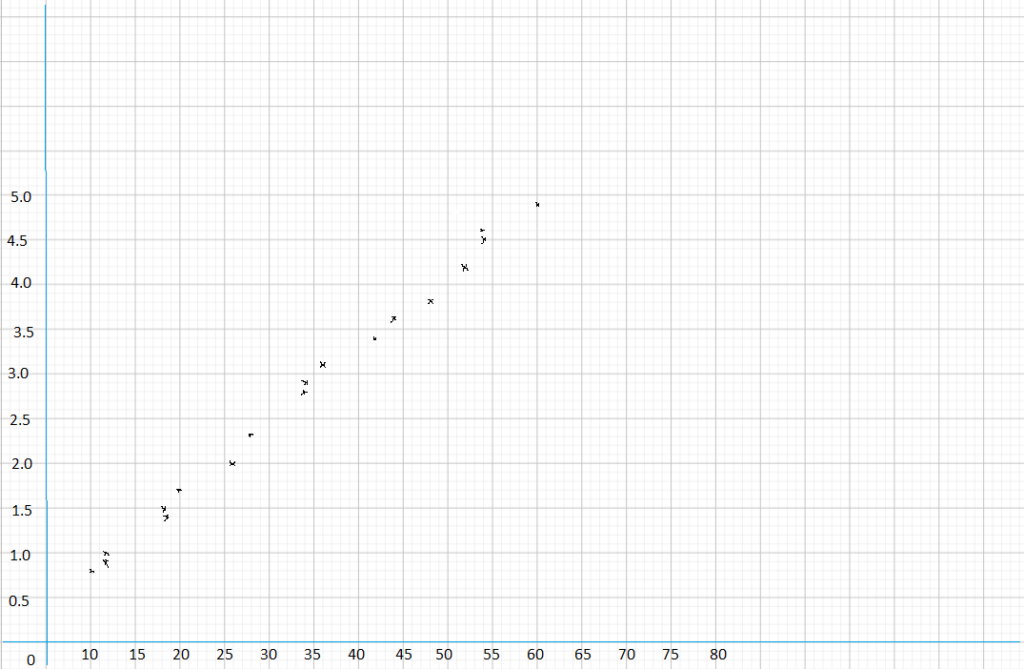
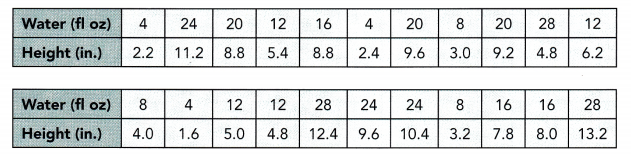
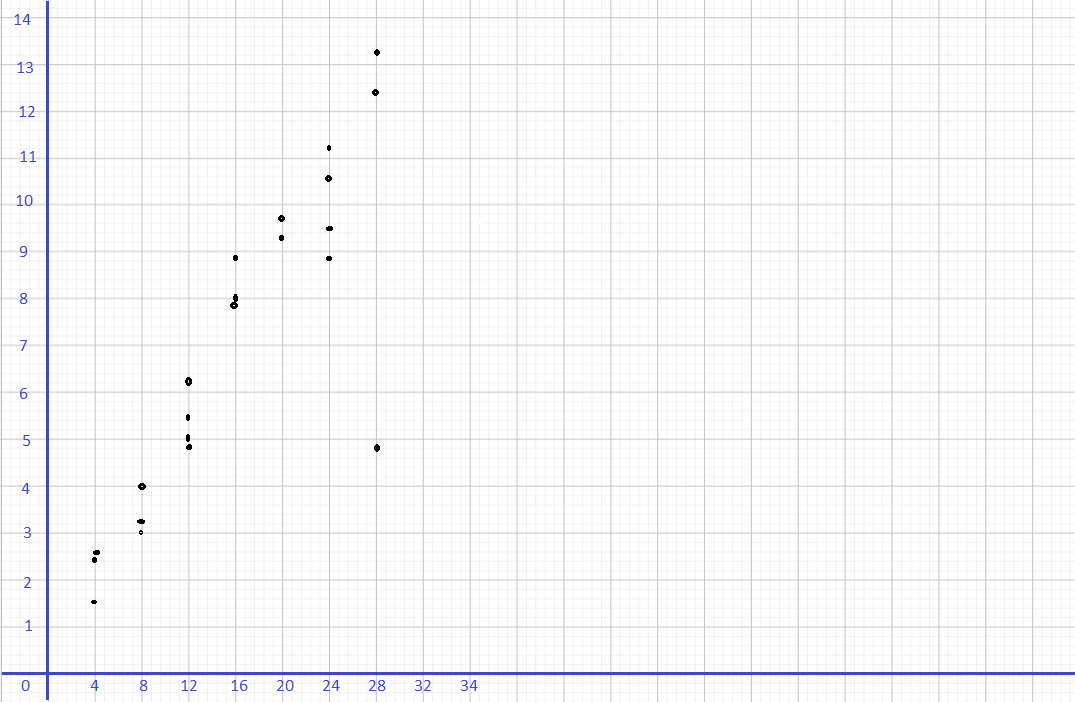
Use 1 centimeter on the horizontal axis to represent 5 kilometers. Use 1 centimeter on the vertical axis to represent 1 liter for the y interval from 5 to 16.
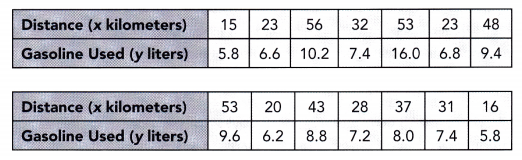
Answer:
The task is to make a scatter plot and give the line of best fit for the distance traveLled and the gasoline used then to determine the equation of the line.
For the scatter plot, determine at which point does the distance x meets the corresponding gasoline used y according to the table. For the tine of best fit, note that it is the most possible straight line that best shows the data on a scatter plot Thus, the scatter plot will be as depicted below.
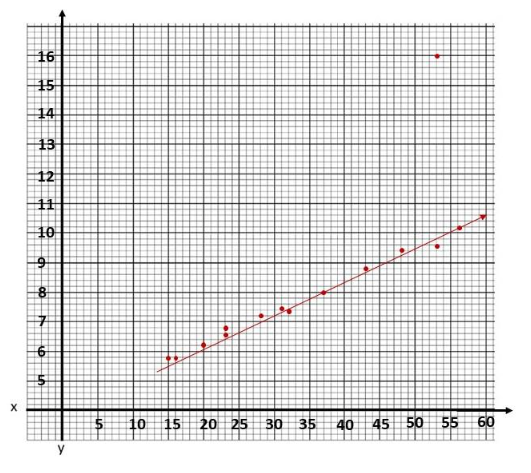
For the equation of the line of best fit, use points that the best fit line passes through, (37, 8) and (56, 10.2), to solve for the slope of the Line. The slope of the line equates the difference of y2 to y1 over the difference of x2 to x1. Then, let m be the sLope, (37, 8) be (x1, y1) and (56, 10.2) be (x2. y2) so
m = \(\frac{y_{2}-y_{1}}{x_{2}-x_{1}}\) Formula.
= \(\frac{10.2-8}{56-37}\) Substitution.
= \(\frac{2.2}{19}\) Subtract.
Next, use the slope-intercept form to determine the equation of the straight line given by y = mx + b, where m is the sLope, b is the y-intercept, and (37, 8) be (x, y) then
y = mx + b Slope-intercept Form.
8 = (\(\frac{2.2}{19}\))37 + b Substitution.
8 = (\(\frac{407}{95}\)) + b Multiply.
(\(\frac{353}{95}\)) = b Subtract (\(\frac{407}{95}\)) to both sides.
Lastly, using the slope-intercept form again, let m be the slope equals to (\(\frac{2.2}{19}\)) and b equals to (\(\frac{353}{95}\)), thus
y = mx + b Slope-intercept Form.
y = \(\frac{2.2 x}{19}\) – \(\frac{353}{95}\) Substitution.
Therefore, the equation of the tine of best fit is y = \(\frac{2.2 x}{19}\) – \(\frac{353}{95}\).
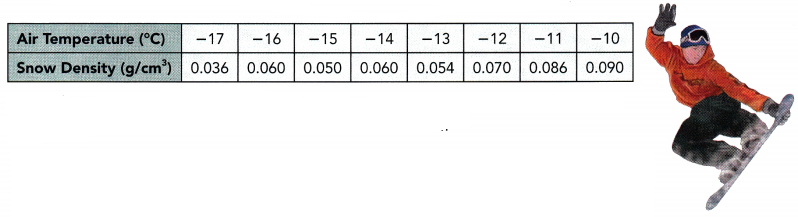
Use the scatter plot below to answer questions 8 to 13.
Snow density is an important factor affecting the speed and control in snow boarding. To understand the relationship between snow density, y grams per cubic centimeters, and air temperature, x°C, data are collected and shown below.
Question 8.
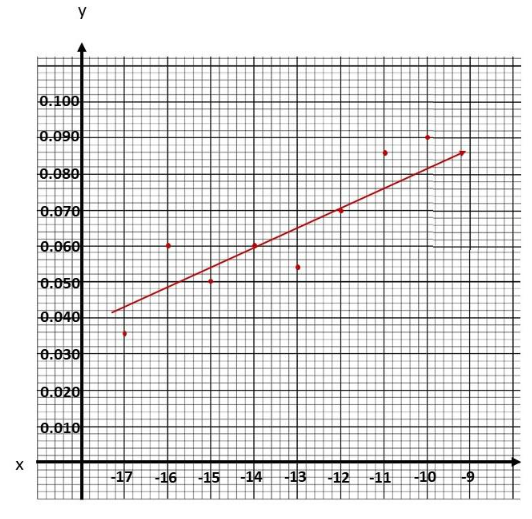
Use graph paper to construct the scatter plot. Use 1 centimeter on the horizontal axis to represent 1°C for the x interval from -17 to -9. Use 1 centimeter on the vertical axis to represent 0.010 grams per cubic centimeter.
Answer:
The objective is to make a scatter plot for the snow density and air temperature.
Observe that when the air temperature is at -17°C the snow density is 0.036g/cm3, at -16° the density is 0.060g/cm3, the air temperature is at -15°C the snow density is 0.050g/cm3, at -14° the density is 0.60g/cm3, the air temperature is at -13°C the snow density is 0.054g/cm3, at -12° the density is 0.070g/cm3. the air temperature is at -11°C the snow density is 0.086g/cm3, and at -10° the density is 0.090g/cm3. Thus, the scatter plot will be as depicted below.
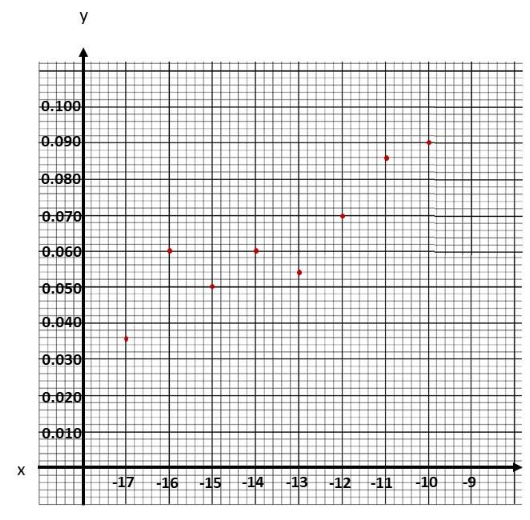
Question 9.
Describe the association between air temperature and snow density.
Answer:
The target is to determine the association in bivariate data then explain the relationship between the two.
The scatter plot shows a weak, positive and linear association. This relationship indicates that the greater the temperature, the higher the snow density.
Question 10.
Sketch a line of best fit.
Answer:
The goal of this task is to determine the line of best fit in the scatter plot of the snow density and air temperature.
Observe that when the air temperature is at -17°C the snow density is 0.036g/cm3, at 16 the density is 0.060g/cm3. the air temperature is at -15°C the snow density is 0.050g/cm3, at -14° the density is 0.060g/cm3, the air temperature is at -13°C the snow density is 0.054g/cm3, at -12° the density is 0.070g/cm3. the air temperature is at -11°C the snow density is 0.086g/cm3, and at -10° the density is 0.090g/cm3. Also, the line of best fit is the most possible straight line that best shows the data on a scatter plot Thus, the line of best fit for scatter plot will be as depicted below.
Question 11.
Find an equation for the line of best fit.
Answer:
The objective of this task is to determine the equation of the Line of best fit for the air temperature and snow density.
Notice that the best fit Une passes through (-14, 0.060) and (- 12.0.070). Use these points to solve for the slope of the line which equates the difference of y2 to y1 over the difference of x2 to x1. Then, let m be the slope, (-14,0.060) be (x1, y1) and (-12,0.070) be (x2. y2) so
m = \(\frac{y_{2}-y_{1}}{x_{2}-x_{1}}\) Slope Formula.
= \(\frac{0.070-0.060}{(-12)-(-14)}\) Substitution.
= \(\frac{0.01}{2}\) Subtract.
= 0.005 Simplify.
Next use the slope-intercept form to determine the equation of the straight line given by y = mx + b, where w is the slope, b is the y-intercept, and (-14,0.060) be (x, y) then
y = mx + b Slope-intercept Form.
0.060 = (0.005)(-14) + b Substitution.
0.060 = -0.07 + b Multiply.
0.060 + 0.07 = -0.07 + b + 0.07 Add 0.07 to both sides.
b = 0.13 Simplify.
Lastly, using the slope-intercept form again, let w be the slope equals to 0.005 and b equals to 0.13. thus
y = mx + b Slope-intercept Form.
y = 0.005x + 0.13 Substitution
Therefore, the equation of the line of best fit is y = 0.005x + 0.13.
Question 12.
Predict the density when the temperature is at -14.5°C.
Answer:
The target of this task is to give the approximate snow density using the graph if the temperature is at -14.6°C.
To estimate the snow density x given the air temperature y, study the graph and the tine of best fit then note at what point does y at -14°C meets x. The point is on (-14.6, 0.062).
Therefore, at an air temperature of -14°C, the snow density is around 0.062g/cm3.
Question 13.
Predict the density when the temperature is at -9°C.
Answer:
The goal is to calculate using the equation of the Line y = 0.005x + 0.13 the snow density if the air temperature is at -9°C.
To compute the snow density at -9°C, note that snow density is denoted as y and the air temperature is denoted as x. Then when x is -9,
y = 0.005x + 0.13 Equation of the line.
= 0.005(-9) + 0.13 Substitution.
= -0.045 + 0.13 Multiply.
= 0.085 Simplify.
Therefore, when using the equation y = 0.005x + 0.13 the snow density is about 0.085 at a temperature of -9°C.