This handy Math in Focus Grade 7 Workbook Answer Key Chapter 9 Lesson 9.2 Stem-and-Leaf Plots detailed solutions for the textbook questions.
Math in Focus Grade 7 Course 2 B Chapter 9 Lesson 9.2 Answer Key Stem-and-Leaf Plots
Math in Focus Grade 7 Chapter 9 Lesson 9.2 Guided Practice Answer Key
Display data in a stem-and-leaf plot.
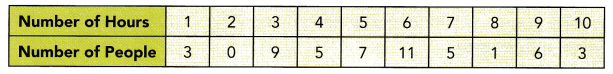
Question 1.
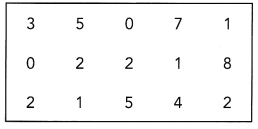
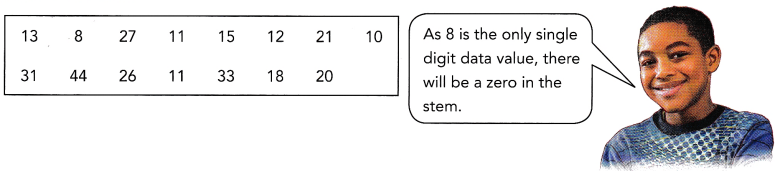
The data show the math quiz scores for 15 students. Display the data in a stem-and-leaf plot.
STEP 1: Identify the least and greatest values, and identify the stems.
STEP 2: Place a leaf on the plot for each item of data.
STEP 3: Arrange the leaves in ascending order for each number on the stem.
STEP 4: Write a title and a key for the stem-and-leaf plot.
Answer:
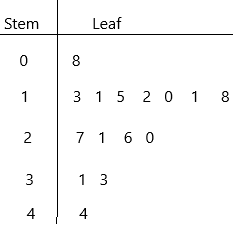
Step 1: Least value:8; greatest value:44; stems:0, 1, 2, 3, 4
Step 2: Constructing leaf for item of data
Step 3: Now arrange in ascending order
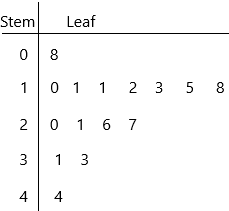
Step 4: Write the title, Remember, a Stem and Leaf plot can have multiple sets of leaves.
0|8 represents 8
1|0 represents 10
1|1 represents 11
1|1 represents 11
1|2 represents 12
1|3 represents 13
1|5 represents 15
1|8 represents 18 and so on… likewise, we represent upto
4|4 represents 44.
Solve.
Question 2.
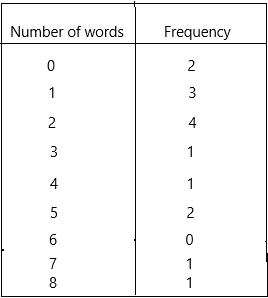
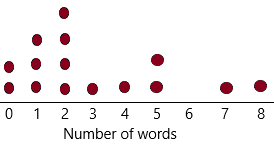
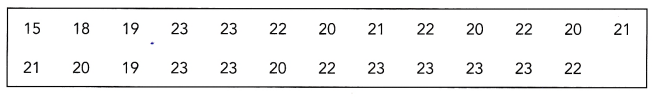
The data below show the attendance, in the number of days, for some students during the first month of school.
a) Display the data in a stem-and-leaf plot.
Answer:
The Stem and Leaf plot is a way of organizing data into a form that makes it easy to see the frequency of different values. In other words, we can say that a Stem and Leaf Plot is a table in which each data value is split into a “stem” and a “leaf.” The “stem” is the left-hand column that has the tens of digits. The “leaves” are listed in the right-hand column, showing all the ones digit for each of the tens, the twenties, thirties, and forties.
Remember that Stem and Leaf plots are a pictorial representation of grouped data, but they can also be called a modal representation. Because, by quick visual inspection at the Stem and Leaf plot, we can determine the mode.
Steps for making Stem-and-Leaf plot:
– First, determine the smallest and largest number in the data.
– Identify the stems.
– Draw a with two columns and name them as “Stem” and “Leaf”.
– Fill in the leaf data.
– Remember, a Stem and Leaf plot can have multiple sets of leaves.
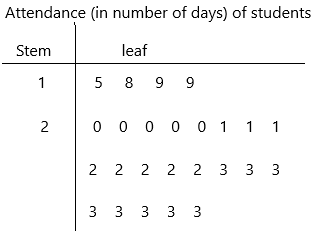
1|5 represents 15 days
1|8 represents 18 days
1|9 represents 19 days
1|9 represents 19 days
2|0 represents 20 days
2|0 represents 20 days
Likewise, we have to write all the representations.
b) How many students are represented by the data?
Answer: 25
Count the number of leaves present in the Stem-and-leaf plot
5, 8, 9, 9, 0, 0, 0, 0, 0, 1, 1, 1, 2, 2, 2, 2, 2, 3, 3, 3, 3, 3, 3, 3, 3.
1|5 represents 15 days
1|8 represents 18 days
1|9 represents 19 days
1|9 represents 19 days
2|0 represents 20 days
2|0 represents 20 days
2|0 represents 20 days
2|0 represents 20 days
2|0 represents 20 days
2|1 represents 21 days
2|1 represents 21 days
2|1 represents 21 days
2|2 represents 22 days
2|2 represents 22 days and so on… up to
2|3 represents 23 days.
Total 25.
c) What is the most common attendance, or mode?
Answer: 23
Mode definition: A mode is defined as the value that has a higher frequency in a given set of values. It is the value that appears the most number of times.
according to the definition:
23 has the highest frequency. It occurs more time.
d) What is the mean attendance?
Answer:
Mean: Mean is the average of the given numbers and is calculated by dividing the sum of given numbers by the total number of numbers.
Mean = (Sum of all the observations/Total number of observations)
The given data:
15, 18, 19, 19, 20, 20, 20, 20, 20, 21, 21, 21, 22, 22, 22, 22, 22, 23, 23, 23, 23, 23, 23, 23, 23.
Mean=15+18+19+19+20+20+20+20+20+21+21+21+22+22+22+22+22+23+23+23+23+23+23+23+23/25
Mean=528/25
Mean=21.12 days
e) What is the median attendance?
Answer:
The median of a set of data is the middlemost number or centre value in the set. The median is also the number that is halfway into the set.
To find the median, the data should be arranged, first, in order of least to greatest or greatest to the least value. A median is a number that is separated by the higher half of a data sample, a population or a probability distribution, from the lower half. The median is different for different types of distribution.
The given data:
15, 18, 19, 19, 20, 20, 20, 20, 20, 21, 21, 21, 22, 22, 22, 22, 22, 23, 23, 23, 23, 23, 23, 23, 23.
The middlemost number is 22, so the median is 22.
Solve. Round your answer to the nearest tenth if necessary.
Question 3.
The stem-and-leaf plot shows the heights, in inches, of the players on two football teams.
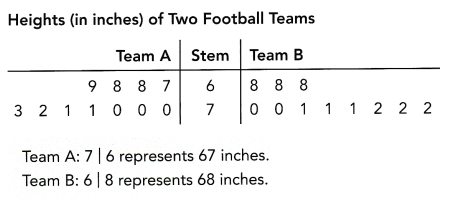
a) How many players are on each team?
Answer:
Observe the above-given stem-and-leaf plot.
There are two teams: Team A and Team B
In Team A, count the number of leaves:
The given data in the team A is 67, 68, 68, 69, 70, 70, 70, 71, 71, 72, 73.
There are 11 players in Team A.
Now coming to Team B:
The given data is 68, 68, 68, 70, 70, 71, 71, 71, 72, 72, 72
There are 11 players in Team B.
b) What is the median height for each team?
Answer:
The median of a set of data is the middlemost number or centre value in the set. The median is also the number that is halfway into the set.
To find the median, the data should be arranged, first, in order of least to greatest or greatest to the least value. A median is a number that is separated by the higher half of a data sample, a population or a probability distribution, from the lower half. The median is different for different types of distribution.
The given data in the team A is 67, 68, 68, 69, 70, 70, 70, 71, 71, 72, 73.
Median for Team A:
The middlemost number is 70
Median for Team B:
The given data is 68, 68, 68, 70, 70, 71, 71, 71, 72, 72, 72
The middlemost number is 71
c) What is the mean height for each team?
Answer:
Mean: Mean is the average of the given numbers and is calculated by dividing the sum of given numbers by the total number of numbers.
Mean = (Sum of all the observations/Total number of observations)
Finding Mean for Team A:
The given data in the team A is 67, 68, 68, 69, 70, 70, 70, 71, 71, 72, 73.
Mean for Team A= 67+68+68+69+70+70+70+71+71+72+73/11
Mean for Team A= 769/11
Mean for Team A=69.9
Finding mean for Team B:
The given data is 68, 68, 68, 70, 70, 71, 71, 71, 72, 72, 72
Mean for Team B=68+68+68+70+70+71+71+71+72+72+72/11
Mean for Team B=773/11
Mean for Team B=70.3
d) On average, which team has taller players?
Answer:
Median of Team A:70
Mean of Team A:69.9
Median of Team B:71
Mean of Team B:70.3
According to the above observations, we can write which team has taller players.
On average Team B has taller players because both it’s mean and median are greater. But the means and the medians for both teams are very close, so the players on Team B are not much taller on average.
Solve.
Question 4.
The weights, in pounds, of some newborn babies at a hospital are shown in the stem-and-leaf plot.
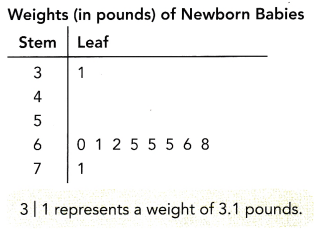
a) Find the median weight.
Answer:
The median of a set of data is the middlemost number or centre value in the set. The median is also the number that is halfway into the set.
To find the median, the data should be arranged, first, in order of least to greatest or greatest to the least value. A median is a number that is separated by the higher half of a data sample, a population or a probability distribution, from the lower half. The median is different for different types of distribution.
The given data:
3.1, 6.0, 6.1, 6.2, 6.5, 6.5, 6.5, 6.6, 6.8, 7.
Median=6.5+6.5/2
Median=13/2
Median=6.5lb
b) Find the mean weight.
Answer:
Mean: Mean is the average of the given numbers and is calculated by dividing the sum of given numbers by the total number of numbers.
Mean = (Sum of all the observations/Total number of observations)
The given data:
3.1, 6.0, 6.1, 6.2, 6.5, 6.5, 6.5, 6.6, 6.8, 7.
Mean=3.1+6.0+6.1+6.2+6.5+6.5+6.5+6.6+6.8+7/10
Mean=61.3/10
Mean=6.13lb
c) Compare the median and mean. Explain the differences.
Answer:
The median is 6.5lb while the mean is 6.13lb. The value of the median is much greater due to the presence of an outlier with the value of 3.1lb
d) What is the range of the data?
Answer:
In statistics, the range is the spread of your data from the lowest to the highest value in the distribution. It is a commonly used measure of variability.
– The range is calculated by subtracting the lowest value from the highest value. While a large range means high variability, a small range means low variability in a distribution.
The formula to calculate the range is:
R=H-L
– R = range
– H = highest value
– L = lowest value
The range is the easiest measure of variability to calculate. To find the range, follow these steps:
1. Order all values in your data set from low to high.
2. Subtract the lowest value from the highest value.
The given data:
3.1, 6.0, 6.1, 6.2, 6.5, 6.5, 6.5, 6.6, 6.8, 7.
Range=7-3.1
Range=3.9
Range=4 (rounded to the nearest 10)
e) Explain how the outlier 3.1 pounds affects the range of the data. How does the outlier affect the mean of the data?
Answer:
The range is the difference between the least and the greatest values in the data set. So, the range is greater because of the outlier. The mean is also smaller because of the outlier.
Math in Focus Course 2B Practice 9.2 Answer Key
Display the data using a stem-and-leaf plot. Indicate the range and median of each data set.
Question 1.
The masses, in grams, of russet potatoes, are 89, 110, 81, 92, 100, 96, 101, 109, 105, and 112.
Answer:
The given data: 89, 110, 81, 92, 100, 96, 101, 109, 105, and 112.
Steps for making Stem-and-Leaf plot:
– First, determine the smallest and largest number in the data.
– Identify the stems.
– Draw a with two columns and name them as “Stem” and “Leaf”.
– Fill in the leaf data.
– Remember, a Stem and Leaf plot can have multiple sets of leaves.
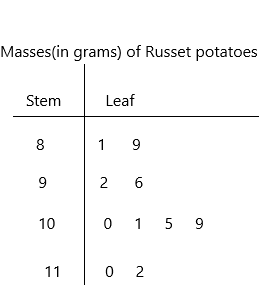
8|1 represents 81 grams.
Range: The range is calculated by subtracting the lowest value from the highest value. While a large range means high variability, a small range means low variability in a distribution.
The formula to calculate the range is:
The given data: 81, 89, 92, 96, 100, 101, 105, 109, 110, 112.
R=H-L
– R = range
– H = highest value
– L = lowest value
The range is the easiest measure of variability to calculate. To find the range, follow these steps:
1. Order all values in your data set from low to high.
2. Subtract the lowest value from the highest value.
Highest value:112
Lowest value:81
Range=112-81
Range=31 grams.
Median:
The given data: 81, 89, 92, 96, 100, 101, 105, 109, 110, 112.
The median of a set of data is the middlemost number or centre value in the set. The median is also the number that is halfway into the set.
To find the median, the data should be arranged, first, in order of least to greatest or greatest to the least value. A median is a number that is separated by the higher half of a data sample, a population or a probability distribution, from the lower half. The median is different for different types of distribution.
Median=100+101/2
Median=201/2
Median=100.5grams.
Question 2.
The lengths of salmon, in inches, are 28, 31, 32, 29, 26, 33, 29, 28, 30, and 31.

Answer:
Steps for making Stem-and-Leaf plot:
– First, determine the smallest and largest number in the data.
– Identify the stems.
– Draw a with two columns and name them as “Stem” and “Leaf”.
– Fill in the leaf data.
– Remember, a Stem and Leaf plot can have multiple sets of leaves.
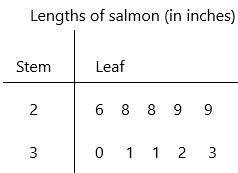
2|6 represents 26 inches.
Range: The range is calculated by subtracting the lowest value from the highest value. While a large range means high variability, a small range means low variability in a distribution.
The formula to calculate the range is:
The given data: 26, 28, 28, 29, 29, 30, 31, 31, 32, 33
R=H-L
– R = range
– H = highest value
– L = lowest value
The range is the easiest measure of variability to calculate. To find the range, follow these steps:
1. Order all values in your data set from low to high.
2. Subtract the lowest value from the highest value.
Highest value:33
Lowest value:26
Range=33-26
Range=7 inches
Median:
The given data: 26, 28, 28, 29, 29, 30, 31, 31, 32, 33
The median of a set of data is the middlemost number or centre value in the set. The median is also the number that is halfway into the set.
To find the median, the data should be arranged, first, in order of least to greatest or greatest to the least value. A median is a number that is separated by the higher half of a data sample, a population or a probability distribution, from the lower half. The median is different for different types of distribution.
Median=29+30/2
Median=59/2
Median=29.5 inches
Question 3.
The average hourly rate, in dollars, of workers in 8 professions are 26, 13, 10, 17, 12, 15, 14, and 15.
Answer:
Steps for making Stem-and-Leaf plot:
– First, determine the smallest and largest number in the data.
– Identify the stems.
– Draw a with two columns and name them as “Stem” and “Leaf”.
– Fill in the leaf data.
– Remember, a Stem and Leaf plot can have multiple sets of leaves.
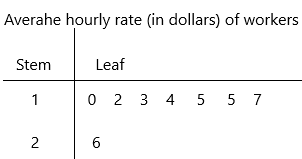
1|0 represents 10$
the given data: 10, 12, 13, 14, 15, 15, 17, 26
range=maximum value-minimum value
maximum value=26
minimum value=10
range=26-10
range=16$
Median: The median of a set of data is the middlemost number or centre value in the set. The median is also the number that is halfway into the set.
To find the median, the data should be arranged, first, in order of least to greatest or greatest to the least value. A median is a number that is separated by the higher half of a data sample, a population or a probability distribution, from the lower half. The median is different for different types of distribution.
the given data: 10, 12, 13, 14, 15, 15, 17, 26
Median=14+15/2
Median=29/2
Median=14.5$
Mean = (Sum of all the observations/Total number of observations)
The given data: 26, 13, 10, 17, 12, 15, 14, and 15
Mean=26+13+10+17+12+15+14+15/8
Mean=122/8
Mean=15.25
Question 4.
The scores of a basketball competition are 70, 56, 93, 92, 72, 74, 76, 72, 78, and 59.
Answer:
Steps for making Stem-and-Leaf plot:
– First, determine the smallest and largest number in the data.
– Identify the stems.
– Draw a with two columns and name them as “Stem” and “Leaf”.
– Fill in the leaf data.
– Remember, a Stem and Leaf plot can have multiple sets of leaves.
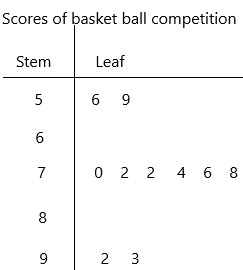
5|6 represents 56 points
The given data: 56, 59, 70, 72, 72, 74, 76, 78, 92, 93
range=maximum value-minimum value
range=93-56
range=37 points
Median: The median of a set of data is the middlemost number or centre value in the set. The median is also the number that is halfway into the set.
To find the median, the data should be arranged, first, in order of least to greatest or greatest to the least value. A median is a number that is separated by the higher half of a data sample, a population or a probability distribution, from the lower half. The median is different for different types of distribution.
The given data: 56, 59, 70, 72, 72, 74, 76, 78, 92, 93
Median=72+74/2
Median=146/2
Median=73 points.
Question 5.
The ages of passengers on board a bus are 33, 37, 5, 11, 63, 55, 56, 13, 15, and 19.
Answer:
Steps for making Stem-and-Leaf plot:
– First, determine the smallest and largest number in the data.
– Identify the stems.
– Draw a with two columns and name them as “Stem” and “Leaf”.
– Fill in the leaf data.
– Remember, a Stem and Leaf plot can have multiple sets of leaves.
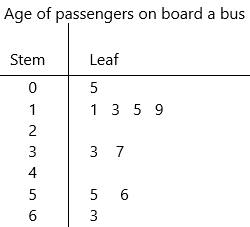
0|5 represents 5 years
the given data: 5, 11, 13, 15, 19, 33, 37, 55, 56, 63
Range=maximim value-minimum value
Range=63-5
range=58 years.
Median: The median of a set of data is the middlemost number or centre value in the set. The median is also the number that is halfway into the set.
To find the median, the data should be arranged, first, in order of least to greatest or greatest to the least value. A median is a number that is separated by the higher half of a data sample, a population or a probability distribution, from the lower half. The median is different for different types of distribution.
the given data: 5, 11, 13, 15, 19, 33, 37, 55, 56, 63
Median=19+33/2
Median=52/2
Median=26 years.
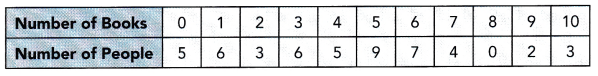
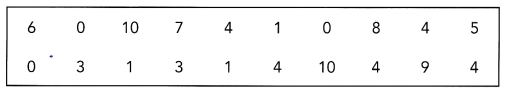
Use the data in the table to answer the following.
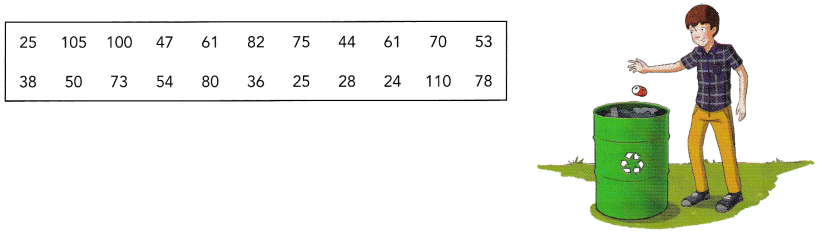
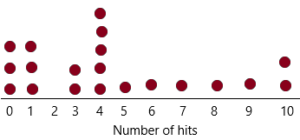
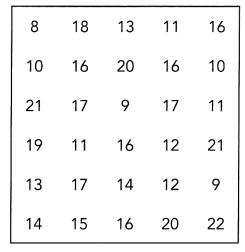
The table shows the weights, in pounds, of 30 pumpkins.
Question 6.
Draw the stem-and-leaf plot of the data.
Answer:
The Stem and Leaf plot is a way of organizing data into a form that makes it easy to see the frequency of different values. In other words, we can say that a Stem and Leaf Plot is a table in which each data value is split into a “stem” and a “leaf.” The “stem” is the left-hand column that has the tens of digits. The “leaves” are listed in the right-hand column, showing all the ones digit for each of the tens, the twenties, thirties, and forties.
Remember that Stem and Leaf plots are a pictorial representation of grouped data, but they can also be called a modal representation. Because, by quick visual inspection at the Stem and Leaf plot, we can determine the mode.
Steps for making Stem-and-Leaf plot:
– First, determine the smallest and largest number in the data.
– Identify the stems.
– Draw a with two columns and name them as “Stem” and “Leaf”.
– Fill in the leaf data.
– Remember, a Stem and Leaf plot can have multiple sets of leaves.
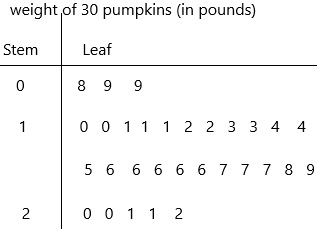
0|8 represents 8 lb
Question 7.
What is the range of the data?
Answer:
The given data: 8, 9, 9, 10, 10, 11, 11, 11, 12, 12, 13, 13, 14, 14, 15, 16, 16, 16, 16, 16, 17, 17, 17, 18, 19, 20, 20, 21, 21, 22
In statistics, the range is the spread of your data from the lowest to the highest value in the distribution. It is a commonly used measure of variability.
– The range is calculated by subtracting the lowest value from the highest value. While a large range means high variability, a small range means low variability in a distribution.
The formula to calculate the range is:
R=H-L
– R = range
– H = highest value
– L = lowest value
The range is the easiest measure of variability to calculate. To find the range, follow these steps:
1. Order all values in your data set from low to high.
2. Subtract the lowest value from the highest value.
Range=22-8
Range=14 lb
Question 8.
What is the mode?
Answer:
The given data: 8, 9, 9, 10, 10, 11, 11, 11, 12, 12, 13, 13, 14, 14, 15, 16, 16, 16, 16, 16, 17, 17, 17, 18, 19, 20, 20, 21, 21, 22
Mode definition: A mode is defined as the value that has a higher frequency in a given set of values. It is the value that appears the most number of times.
according to the definition:
16 has the highest frequency. It occurs more time.
Question 9.
What is the median?
Answer:
Median: The median of a set of data is the middlemost number or centre value in the set. The median is also the number that is halfway into the set.
To find the median, the data should be arranged, first, in order of least to greatest or greatest to the least value. A median is a number that is separated by the higher half of a data sample, a population or a probability distribution, from the lower half. The median is different for different types of distribution.
The given data: 8, 9, 9, 10, 10, 11, 11, 11, 12, 12, 13, 13, 14, 14, 15, 16, 16, 16, 16, 16, 17, 17, 17, 18, 19, 20, 20, 21, 21, 22
Median=15+16/2
Median=31/2
Median=15.5 lb
The median is nothing but Q2. Now we have to find Q1(lower quartile), Q3 (upper quartile)
Q1 data set: 8, 9, 9, 10, 10, 11, 11, 11, 12, 12, 13, 13, 14, 14, 15
Q1=11
Q1 is the median of lower quartile
Q3 data set: 16, 16, 16, 16, 16, 17, 17, 17, 18, 19, 20, 20, 21, 21, 22
Q3=18
Q2 is the median of upper quartile.
Question 10.
What is the interquartile range?
Answer:
The interquartile range defines the difference between the third and the first quartile. Quartiles are the partitioned values that divide the whole series into 4 equal parts. So, there are 3 quartiles. First Quartile is denoted by Q1 known as the lower quartile, the second Quartile is denoted by Q2 and the third Quartile is denoted by Q3 known as the upper quartile. Therefore, the interquartile range is equal to the upper quartile minus lower quartile.
Formula:
The difference between the upper and lower quartile is known as the interquartile range. The formula for the interquartile range is given below
Interquartile range = Upper Quartile – Lower Quartile = Q3 – Q1
where Q1 is the first quartile and Q3 is the third quartile of the series.
IQR=Q3-Q1
IQR=18-11
IQR=7 lb
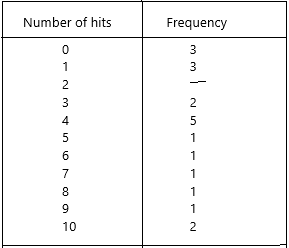
Use the data in the table to answer the following.
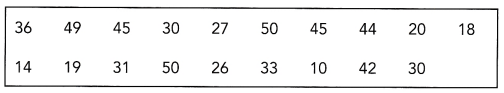
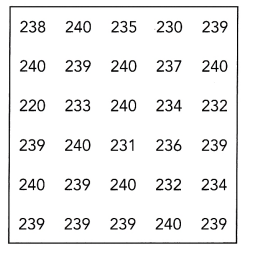
The table shows the attendance, in working days, of workers in a manufacturing plant over a period of one year.
Question 11.
Draw a stem-and-leaf plot.
Answer:
The Stem and Leaf plot is a way of organizing data into a form that makes it easy to see the frequency of different values. In other words, we can say that a Stem and Leaf Plot is a table in which each data value is split into a “stem” and a “leaf.” The “stem” is the left-hand column that has the tens of digits. The “leaves” are listed in the right-hand column, showing all the ones digit for each of the tens, the twenties, thirties, and forties.
Remember that Stem and Leaf plots are a pictorial representation of grouped data, but they can also be called a modal representation. Because, by quick visual inspection at the Stem and Leaf plot, we can determine the mode.
Steps for making Stem-and-Leaf plot:
– First, determine the smallest and largest number in the data.
– Identify the stems.
– Draw a with two columns and name them as “Stem” and “Leaf”.
– Fill in the leaf data.
– Remember, a Stem and Leaf plot can have multiple sets of leaves
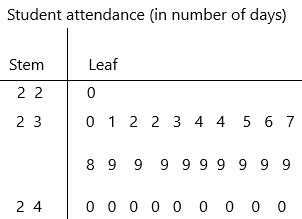
2 2|0 represents 220 days
Question 12.
What is the mean number of working days in for this particular year?
Answer:
Mean: Mean is the average of the given numbers and is calculated by dividing the sum of given numbers by the total number of numbers.
Mean = (Sum of all the observations/Total number of observations)
The given data: 220, 230, 231, 232, 232, 233, 234, 234, 235, 236, 237, 238, 239, 239, 239, 239, 239, 239, 239, 239, 239, 240, 240, 240, 240, 240, 240, 240, 240, 240.
Mean=7103/30
Mean=236.7
Mean=237 (rounded to near number)
Question 13.
What is the mode?
Answer:
Mode definition: A mode is defined as the value that has a higher frequency in a given set of values. It is the value that appears the most number of times.
according to the definition:
The given data: 220, 230, 231, 232, 232, 233, 234, 234, 235, 236, 237, 238, 239, 239, 239, 239, 239, 239, 239, 239, 239, 240, 240, 240, 240, 240, 240, 240, 240, 240.
239 days and 240 days have the highest frequency. It occurs more time.
Question 14.
What is the median?
Answer:
Median: The median of a set of data is the middlemost number or centre value in the set. The median is also the number that is halfway into the set.
To find the median, the data should be arranged, first, in order of least to greatest or greatest to the least value. A median is a number that is separated by the higher half of a data sample, a population or a probability distribution, from the lower half. The median is different for different types of distribution.
The given data: 220, 230, 231, 232, 232, 233, 234, 234, 235, 236, 237, 238, 239, 239, 239, 239, 239, 239, 239, 239, 239, 240, 240, 240, 240, 240, 240, 240, 240, 240.
Median=239+239/2
Median=478/2
Median=239 days.
Solve. Show your work.
Question 15.
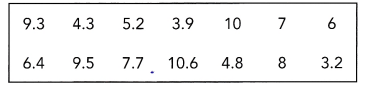
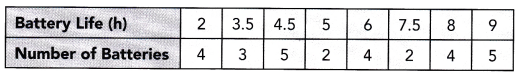
The weights of 10 pumpkins, in pounds, harvested at a farm is shown in the stem-and-leaf plot.
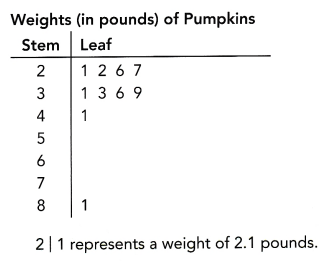
Compare the median and mean. Explain the difference in the values.
Answer:
Median: The median of a set of data is the middlemost number or centre value in the set. The median is also the number that is halfway into the set.
To find the median, the data should be arranged, first, in order of least to greatest or greatest to the least value. A median is a number that is separated by the higher half of a data sample, a population or a probability distribution, from the lower half. The median is different for different types of distribution.
The given data: 2.1, 2.2, 2.6, 2.7, 3.1, 3.3, 3.6, 3.9, 4.1, 8.1
Median=3.1+3.3/2
Median=6.4/2
Median=3.2 lb
Mean: Mean is the average of the given numbers and is calculated by dividing the sum of given numbers by the total number of numbers.
Mean = (Sum of all the observations/Total number of observations)
Mean=2.1+2.2+2.6+2.7+3.1+3.3+3.6+3.9+4.1+8.1/10
Mean=35.7/10
Mean=3.57 lb
The median is 3.2 pounds while the mean is 3.57 pounds; the value of the mean is greater due to the presence of the outlier with the value of 8.1 pounds.
Question 16.
The speeds, in miles per hour, tracked by a police patrol car along a certain highway, are shown in the stem-and-leaf plot.
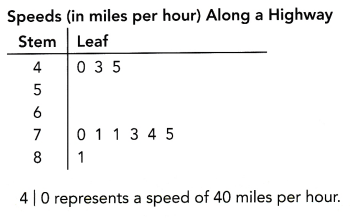
Explain how the outliers 40, 43, and 45 miles per hour affect the range of the data. How do these outliers affect the mean of the data?
Answer:
The range is calculated by subtracting the lowest value from the highest value. While a large range means high variability, a small range means low variability in a distribution.
The formula to calculate the range is:
R=H-L
– R = range
– H = highest value
– L = lowest value
Range=maximum value- minimum value
maximum value=81
minimum value=40
Range=41
The range is the difference between the least and the greatest values in the data set. So, the range is greater because of the outlier.
Question 17.
Math Journal The waiting time, in minutes, at a certain bus interchange for two bus routes on a particular day are recorded in the plot.
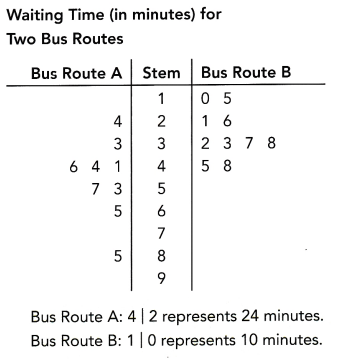
With the data shown, discuss some advantages and disadvantages of the stem-and-leaf plot.
Answer:
Advantages:
– It is easy to identify the minimum and maximum values from the data set.
– The range, median, and mode can be identified easily from a stem-and-leaf plot.
– The individual data values are preserved, unlike in a histogram.
Disadvantages:
– When the range is too narrow, there would be too many leaves.
– When the range is wide, there would be some stems that have no leaf, especially when outliers cause the range to widen.
– Bus route B has a relatively small range, with data concentrated within a few stems. Bus route A has a range that is much wider. So, when both bus routes are plotted in a double stem-and-leaf plot, bus route A has many stems without any leaf and the stem is much longer.
Question 18.
Math Journal Describe a data set that could be represented by a stem-and-leaf plot. Explain how using a stem-and-leaf plot could help you analyze the data set.
Answer:
The Stem and Leaf plot is a way of organizing data into a form that makes it easy to see the frequency of different values. In other words, we can say that a Stem and Leaf Plot is a table in which each data value is split into a “stem” and a “leaf.” The “stem” is the left-hand column that has the tens of digits. The “leaves” are listed in the right-hand column, showing all the ones digit for each of the tens, the twenties, thirties, and forties.
Remember that Stem and Leaf plots are a pictorial representation of grouped data, but they can also be called a modal representation. Because, by quick visual inspection at the Stem and Leaf plot, we can determine the mode.
Steps for making Stem-and-Leaf plot:
– First, determine the smallest and largest number in the data.
– Identify the stems.
– Draw a with two columns and name them as “Stem” and “Leaf”.
– Fill in the leaf data.
– Remember, a Stem and Leaf plot can have multiple sets of leaves.
Stem-and-leaf plot graphs are usually used when there are large amounts of numbers to analyze.
To compare two sets of data, you can use a back-to-back stem-and-leaf plot. For instance, if you want to compare the scores of two sports teams, you can use the stem-and-leaf plot.