This handy Math in Focus Grade 7 Workbook Answer Key Chapter 9 Statistics detailed solutions for the textbook questions.
Math in Focus Grade 7 Course 2 B Chapter 9 Answer Key Statistics
Math in Focus Grade 7 Chapter 9 Quick Check Answer Key
Find the mean of each set of data. Round your answer to 2 decimal places if it is not exact.
Question 1.
9, 11, 6, 29, 5
Answer:
Definition of mean: The most common measure of central tendency is the arithmetic mean. In layman’s terms, the mean of data indicates an average of the given collection of data. It is equal to the sum of all the values in the group of data divided by the total number of values.
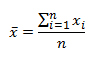
For n values in a set of data namely as x1, x2, x3, … xn, the mean of data is given as:
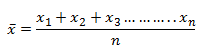
It can also be denoted as:
The above-given data: 9, 11, 6, 29, 5
Mean=9+11+6+29+5/5
Mean=60/5
Mean=12.
Question 2.
43, 88, 39, 10, 26, 17, 35
Answer:
Definition of mean: The most common measure of central tendency is the arithmetic mean. In layman’s terms, the mean of data indicates an average of the given collection of data. It is equal to the sum of all the values in the group of data divided by the total number of values.
For n values in a set of data namely as x1, x2, x3, … xn, the mean of data is given as:
It can also be denoted as:
The above-given data: 43, 88, 39, 10, 26, 17, 35
Mean=43+88+39+10+26+17+35/7
Mean=258/7
Mean=36.85 (round to nearest number)
Mean=37.
Question 3.
53.6, 36.7, 88.5, 90.6
Answer:
Definition of mean: The most common measure of central tendency is the arithmetic mean. In layman’s terms, the mean of data indicates an average of the given collection of data. It is equal to the sum of all the values in the group of data divided by the total number of values.
For n values in a set of data namely as x1, x2, x3, … xn, the mean of data is given as:
It can also be denoted as:
The above-given data: 53.6, 36.7, 88.5, 90.6
Mean=53.6+36.7+88.5+90.6/4
Mean=269.4/4
Mean=67.35
Mean=67 (rounded to nearest number)
Question 4.
0.14, 1.05, 3.1, 7.18, 4.3, 8
Answer:
Definition of mean: The most common measure of central tendency is the arithmetic mean. In layman’s terms, the mean of data indicates an average of the given collection of data. It is equal to the sum of all the values in the group of data divided by the total number of values.
For n values in a set of data namely as x1, x2, x3, … xn, the mean of data is given as:
It can also be denoted as:
The above-given data: 0.14, 1.05, 3.1, 7.18, 4.3, 8
Mean=0.14+1.05+3.1+7.18+4.3+8/6
Mean=23.77/6
Mean=3.96
Mean=4
Solve. Show your work.
Question 5.
The heights, in inches, of 10 children are
54, 66, 52, 60.5, 61.25, 55, 58.75, 51.5, 53, 50.
Find the mean height of the children.
Answer:
Definition of mean: The most common measure of central tendency is the arithmetic mean. In layman’s terms, the mean of data indicates an average of the given collection of data. It is equal to the sum of all the values in the group of data divided by the total number of values.
For n values in a set of data namely as x1, x2, x3, … xn, the mean of data is given as:
It can also be denoted as:
the above-given data: 54, 66, 52, 60.5, 61.25, 55, 58.75, 51.5, 53, 50.
Mean=54+66+52+60.5+61.25+55+58.75+51.5+53+50/10
Mean=562/10
Mean height of children=56.2
Find the median of each set of numbers.
Question 6.
41,29, 78, 12, 56, 30, 22
Answer: 30
Explanation:
The median of a set of data is the middlemost number or centre value in the set. The median is also the number that is halfway into the set.
To find the median, the data should be arranged, first, in order of least to greatest or greatest to the least value. A median is a number that is separated by the higher half of a data sample, a population or a probability distribution, from the lower half. The median is different for different types of distribution.
Median formula:
The formula to calculate the median of the finite number of data set is given here. The median formula is different for even and odd numbers of observations. Therefore, it is necessary to recognise first if we have an odd number of values or an even number of values in a given data set.
The formula to calculate the median of the data set is given as follow.
An odd number of observations:
If the total number of observations given is odd, then the formula to calculate the median is:
Median = {(n+1)/2}thterm
where n is the number of observations
Even number of observations:
If the total number of observations is even, then the median formula is:
Median = [(n/2)th term + {(n/2)+1}th]/2
where n is the number of observations
How to calculate Median:
To find the median, place all the numbers in the ascending order and find the middle.
Put them in ascending order: 12, 22, 29, 30, 41, 56, 78
The middle number is 30, so the median is 30.
Question 7.
193, 121.5, 162.3, 125, 103.8, 149.6
Answer:
The median of a set of data is the middlemost number or centre value in the set. The median is also the number that is halfway into the set.
To find the median, the data should be arranged, first, in order of least to greatest or greatest to the least value. A median is a number that is separated by the higher half of a data sample, a population or a probability distribution, from the lower half. The median is different for different types of distribution.
Median formula:
The formula to calculate the median of the finite number of data set is given here. The median formula is different for even and odd numbers of observations. Therefore, it is necessary to recognise first if we have an odd number of values or an even number of values in a given data set.
Sorted data set: 103.8, 121.5, 125, 149.6, 162.3, 193
Meadian=125+149.6/2
Median=274.6/2
Median=137.3
Thus, the median is 137.3
Question 8.
9, 2, 2, 4, 4, 4, 1, 3, 6, 5, 3, 6
Answer: 4
Explanation:
The median of a set of data is the middlemost number or centre value in the set. The median is also the number that is halfway into the set.
To find the median, the data should be arranged, first, in order of least to greatest or greatest to the least value. A median is a number that is separated by the higher half of a data sample, a population or a probability distribution, from the lower half. The median is different for different types of distribution.
Median formula:
The formula to calculate the median of the finite number of data set is given here. The median formula is different for even and odd numbers of observations. Therefore, it is necessary to recognise first if we have an odd number of values or an even number of values in a given data set.
Sorted data set: 1, 2, 2, 3, 3, 4, 4, 4, 5, 6, 6, 9
Median=4+4/2
Median=8/2
Median=4
Thus, the median is 4.
Question 9.
1,011, 1,100, 1,001, 1,010, 1,110, 1,000, 1,011, 100
Answer:
Explanation:
The median of a set of data is the middlemost number or centre value in the set. The median is also the number that is halfway into the set.
To find the median, the data should be arranged, first, in order of least to greatest or greatest to the least value. A median is a number that is separated by the higher half of a data sample, a population or a probability distribution, from the lower half. The median is different for different types of distribution.
Median formula:
The formula to calculate the median of the finite number of data set is given here. The median formula is different for even and odd numbers of observations. Therefore, it is necessary to recognise first if we have an odd number of values or an even number of values in a given data set.
Sorted data set: 100, 1000, 1001, 1010, 1011, 1011, 1100, 1110
Median=2021/2
Median=1010.5
Thus, the median is 1010.5
Solve. Show your work.
Question 10.
The daily low temperatures for the past 10 days were
30.6°F, 32.1 °F, 29.5°F, 30.2°F, 26.4°F, 34.3°F, 31.6°F, 32°F, 25.9°F, and 26.4°F.
What was the median daily low temperature?
Answer:
The statistical concept of the median is a value that divides a data sample, population, or probability distribution into two halves. Finding the median essentially involves finding the value in a data sample that has a physical location between the rest of the numbers. Note that when calculating the median of a finite list of numbers, the order of the data samples is important. Conventionally, the values are listed in ascending order, but there is no real reason that listing the values in descending order would provide different results. In the case where the total number of values in a data sample is odd, the median is simply the number in the middle of the list of all values. When the data sample contains an even number of values, the median is the mean of the two middle values. While this can be confusing, simply remember that even though the median sometimes involves the computation of a mean, when this case arises, it will involve only the two middle values, while a mean involves all the values in the data sample. In the odd cases where there are only two data samples or there is an even number of samples where all the values are the same, the mean and median will be the same. Given the same data set as before, the median would be acquired in the following manner:
30.6°F, 32.1 °F, 29.5°F, 30.2°F, 26.4°F, 34.3°F, 31.6°F, 32°F, 25.9°F, and 26.4°F.
The formula to calculate the median of the finite number of data set is given here. The median formula is different for even and odd numbers of observations. Therefore, it is necessary to recognise first if we have an odd number of values or an even number of values in a given data set.
Sorted data set: 25.9, 26.4, 26.4, 29.5, 30.2, 30.6, 31.6, 32, 32.1, 34.3
Median=30.2+30.6/2
Median=60.8/2
Median=30.4
Thus, the median is 30.4
Summarize each of the following data sets in a frequency table and draw a dot plot.
Question 11.
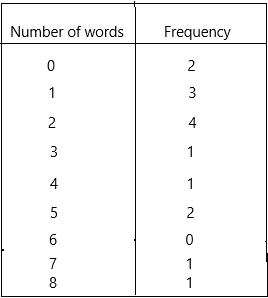
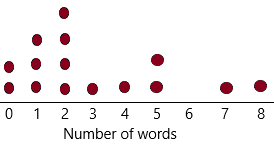
The data show the number of misspelled words found in 15 essays.
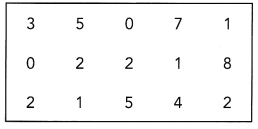
Answer:
Definition of frequency: Frequency means the number of times a value appears in the data. A table can quickly show us how many times each value appears. If the data has many different values, it is easier to use intervals of values to present them in a table.
A dot chart or dot plot is a statistical chart consisting of data points plotted on a fairly simple scale, typically using filled in circles.
Question 12.
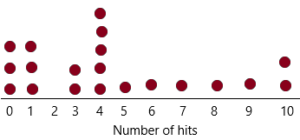
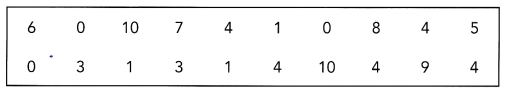
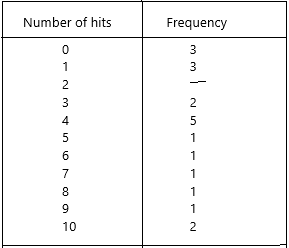
In a game, each child is given 10 balls to hit at moving targets. The data show the number of hits scored by 20 children.
Answer:
Definition of frequency: Frequency means the number of times a value appears in the data. A table can quickly show us how many times each value appears. If the data has many different values, it is easier to use intervals of values to present them in a table.
A dot chart or dot plot is a statistical chart consisting of data points plotted on a fairly simple scale, typically using filled in circles.