This handy Math in Focus Grade 7 Workbook Answer Key Chapter 9 Lesson 9.1 Interpreting Quartiles and Interquartile Range detailed solutions for the textbook questions.
Math in Focus Grade 7 Course 2 B Chapter 9 Lesson 9.1 Answer Key Interpreting Quartiles and Interquartile Range
Math in Focus Grade 7 Chapter 9 Lesson 9.1 Guided Practice Answer Key
Calculate.
Question 1.
The table shows the average monthly temperatures in degrees Fahrenheit in New York. Find the range of the these temperatures.

Answer:
Definition of range: In statistics, the range of a data set is a measure of the spread or the dispersion of the observations. It is the difference between the largest and the smallest observed values in a data set.
Formula:
Range=max-min
Where max=maximum value in a data set.
Min=Minimum value in a data set.
How to calculate range steps:
1. List the elements of your data set.
2. Identify the highest and lowest numbers in the set.
3. Subtract the smallest number in your data set from the largest number.
4. Label the range clearly.
The given temperature data set: 31.5, 33.6, 42.4, 52.5, 62.7, 71.6, 76.8, 75.5, 68.2, 57.5, 47.6, 36.6
Now arrange the data set from lowest to highest:
31.5, 33.6, 36.6, 42.4, 47.6, 52.5, 57.5, 62.7, 68.2, 71.6, 75.5, 76.8
Range= 76.8-31.5
Range=45.3
Complete.
Question 2.
The heights, in centimeters, of the tomato seedling plants in a greenhouse are listed below. Find the first, second, and third quartiles of the heights of the seedling plants.
First arrange the heights in ascending order: ![]()
Q2 is the median of the data. So, Q2 = ![]()
Q1 is the median of the lower half of the data: ![]()
Q1 = ![]()
Q3 is the median of the upper half of the data: ![]()
Q3 = ![]()
Answer:
– In statistics, we generally deal with a large amount of numerical data. We have various concepts and formulas in statistics to evaluate the large data. One of such best applications is quartiles.
– Quartiles are the values that divide the given data set into four parts, making three points. Thus, quartiles are the values that divide the given data into three quarters. The middle part of the quartiles tells the central point of distribution. The difference between the higher and lower quartiles so formed gives the interquartile range.
– The quartiles formula is used to divide a given set of numbers into quarters. There are three quartiles formed, dividing the given data into four quarters. We are arranging the data in ascending order. The first quartile lies between the first number and the median, the second quartile is the median, and the third quartile lies between the median and the last number.
When the set of numbers is arranged in ascending order, then the formula used to calculate the quartiles are given below:
1. First quartile(Q1)=(n+1/4)th term
2. Second quartile(Q2)=(n+1/2)th term.
3. Third quartile=(Q3)=[3(n+1)/4)]th term.
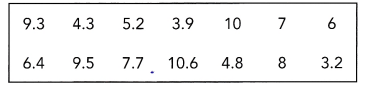
The given data set: 9.3, 4.3, 5.2, 3.9, 10, 7, 6, 6.4, 9.5, 7.7, 10.6, 4.8, 8, 3.2
Now arrange the set from lowest to highest:
3.2, 3.9, 4.3, 4.8, 5.2, 6, 6.4, 7, 7.7, 8, 9.3, 9.5, 10, 10.6
The second quartile Q2 is easy to find. It is the median of any data set and it divides an ordered data set into upper and lower halves.
Q2=6.4+7/2
Q2=6.5
Q2 is the median of the data.
The first quartile Q1 is the median of the lower half not including the value of Q2. The third quartile Q3 is the median of the upper half not including the value of Q2.
Q1=3.2, 3.9, 4.3, 4.8, 5.2, 6, 6.4
Q1=4.8
Q1 is the median of the lower half of the data
Q3=7, 7.7, 8, 9.3, 9.5, 10, 10.6
Q3=9.3
Q3 is the median of the upper half of the data
Solve.
Question 3.
Out of 50 multiple choice questions, 19 students scored the following numbers of correct answers.
Find the interquartile range and interpret what it means.
Answer:
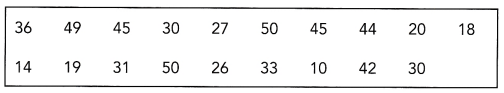
the given data set: 36, 49, 45, 30, 27, 50, 45, 44, 20, 18, 14, 19, 31, 50, 26, 33, 10, 42, 30
Now arrange the data into lowest to highest:
10, 14, 18, 19, 20, 26, 27, 30, 30, 31, 33, 36, 42, 44, 45, 45, 49, 50, 50
Definition of interquartile range: The interquartile range defines the difference between the third and the first quartile. Quartiles are the partitioned values that divide the whole series into 4 equal parts. So, there are 3 quartiles. First Quartile is denoted by Q1 known as the lower quartile, the second Quartile is denoted by Q2 and the third
A quartile is denoted by Q3 known as the upper quartile. Therefore, the interquartile range is equal to the upper quartile minus the lower quartile.
Interquartile range formula: The difference between the upper and lower quartile is known as the interquartile range. The formula for the interquartile range is given below:
Interquartile range = Upper Quartile – Lower Quartile = Q3 – Q1
Where Q1 is the first quartile, Q3 is the third quartile.
How to calculate Interquartile range:
The procedure to calculate the interquartile range is given as follows:
– Arrange the given set of numbers into increasing or decreasing order.
– Then count the given values. If it is odd, then the centre value is median otherwise obtain the mean value for two centre values. This is known as the Q2 value. If there are an even number of values, the median will be the average of the middle two values.
– Median equally cuts the given values into two equal parts. They are described as Q1 and Q3 parts.
– The median of data values below the median represents Q1.
– The median of data values above the median value represents Q3.
– Finally, we can subtract the median values of Q1 and Q3.
– The resulting value is the interquartile range.
Q2=31
Q2 is the median of the data.
n=19 (odd)
If the size of the data set is odd, do not include the median when finding the first and third quartiles.
Q1=10, 14, 18, 19, 20, 26, 27, 30, 30
Q1=20
Q1 is the lower half of the data
Q3=33, 36, 42, 44, 45, 45, 49, 50, 50
Q3=45
Now we know Q1 and Q3
Interquartile range=Q3-Q1
Interquartile range=45-20
Interquartile range=25
Calculate.
Question 4.
A survey of 50 people asking the number of books they read in a year produced the following results.
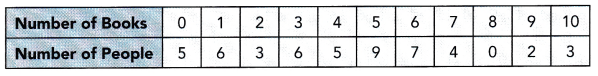
a) Find the lower quartile, the upper quartile, and the interquartile range.
Answer:
Median: The median of a set of data is the middlemost number or centre value in the set. The median is also the number that is halfway into the set.
To find the median, the data should be arranged, first, in order of least to greatest or greatest to the least value. A median is a number that is separated by the higher half of a data sample, a population or a probability distribution, from the lower half. The median is different for different types of distribution.
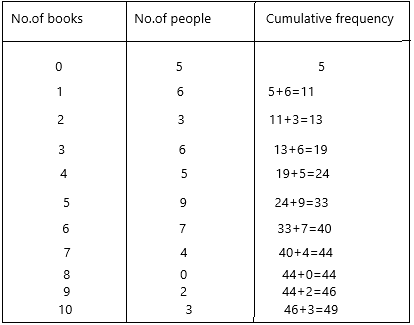
Now calculate the cumulative frequency
Cumulative frequency is defined as a running total of frequencies. The frequency of an element in a set refers to how many of that element there are in the set. Cumulative frequency can also be defined as the sum of all previous frequencies up to the current point.
n=50
n/2=50/2=25
Median=1/2[(n/2)th term + (n/2+1)th term]
Median=1/2[ 25 + 26]
Median=1/2[51]
Median=25.5
Now check for the number, if the number was not there then check for the 25.5 above number and write the certain books
25.5 is not there, the next nearest number is 33 and the number of books they read is 5.
Median Q2=5
Q1 lower quartile=(n/4)th term
Q1=50/4
Q1=12.5
check for the next nearest number for 12.5 which is 13 and the corresponding number is 2
Therefore, Q1 is 2
Q3 upper quartile=(3n/4)th term
Q3=(3*50/4)
Q3=150/4
Q3=37.5
37.5 is not there, the next nearest number is 40 and the corresponding number is 6.
Q3=6
Interquartile range=Q3-Q1
Interquartile range=6-2
Interquartile range=4
b) Interpret what the interquartile range means.
Answer:
Definition of interquartile range: The interquartile range defines the difference between the third and the first quartile. Quartiles are the partitioned values that divide the whole series into 4 equal parts. So, there are 3 quartiles. First Quartile is denoted by Q1 known as the lower quartile, the second Quartile is denoted by Q2 and the third
A quartile is denoted by Q3 known as the upper quartile. Therefore, the interquartile range is equal to the upper quartile minus the lower quartile.
Interquartile range formula: The difference between the upper and lower quartile is known as the interquartile range. The formula for the interquartile range is given below:
Interquartile range = Upper Quartile – Lower Quartile = Q3 – Q1
Where Q1 is the first quartile, Q3 is the third quartile.
How to calculate Interquartile range:
The procedure to calculate the interquartile range is given as follows:
– Arrange the given set of numbers into increasing or decreasing order.
– Then count the given values. If it is odd, then the centre value is median otherwise obtain the mean value for two centre values. This is known as the Q2 value. If there are an even number of values, the median will be the average of the middle two values.
– Median equally cuts the given values into two equal parts. They are described as Q1 and Q3 parts.
– The median of data values below the median represents Q1.
– The median of data values above the median value represents Q3.
– Finally, we can subtract the median values of Q1 and Q3.
– The resulting value is the interquartile range.
Technology Activity
Materials
spreadsheet software
USE SPREADSHEET SOFTWARE TO FIND QUARTILES, INTERQUARTILE RANGE, AND RANGE
Work in pairs.
Step 1: Randomly pick 10 students. Count the number of letters in their first names and enter the values in a row of cells.
Step 2: Choose another 5 cells for Q1, Q2, Q3, interquartile range, and range.
Step 3: Use the spreadsheet software’s function for finding quartiles, maximums, and minimums of data. In the 5 cells you choose in Step 2 generate statistics for the 10 values you entered in Step 1.
Step 4: What is the median of the data? What does this tell you about the first names in the data set? What does the interquartile range tell you about the first names in the data set?
Step 5: Randomly pick another 10 students and repeat the process. Compare the statistics for the two data sets. What differences do you notice in the interquartile range for the two data sets?
Math Journal Suppose you add a data value for a student whose first name has many more letters than anyone else’s. How would adding this data value affect the range and the interquartile range of the data set? Explain your thinking.
Answer:
Math in Focus Course 2B Practice 9.1 Answer Key
Find the range of each set of data values.
Question 1.
Weights of rabbits in pounds: 15, 9, 10, 22, 14.5, 12.5, 16, 8, and 11.
Answer:
Range: The range in statistics for a given data set is the difference between the highest and lowest values. For example, if the given data set is {2,5,8,10,3}, then the range will be 10 – 2 = 8.
– Thus, the range could also be defined as the difference between the highest observation and lowest observation. The obtained result is called the range of observation. The range in statistics represents the spread of observations.
Range formula:
The formula of the range in statistics can simply be given by the difference between the highest and lowest value.
Range = Highest Value – Lowest Value (Or)
Range = Highest observation – Lowest observation (Or)
Range = Maximum value – Minimum Value
How to find range:
To find the range in statistics, we need to arrange the given values or set of data or set of observations in ascending order. That means, firstly write the observations from the lowest to the highest value. Now, we need to use the formula to find the range of observations.
The given data set: 15, 9, 10, 22, 14.5, 12.5, 16, 8, and 11.
Highest value=22
Lowest value=8
Range=highest value-lowest value
Range=22-8
Range=14
Question 2.
Number of pairs of shoes sold each day for a week at a retail shop: 67, 63, 66, 60, 58, 70, and 75.
Answer:
Range: The range in statistics for a given data set is the difference between the highest and lowest values. For example, if the given data set is {2,5,8,10,3}, then the range will be 10 – 2 = 8.
– Thus, the range could also be defined as the difference between the highest observation and lowest observation. The obtained result is called the range of observation. The range in statistics represents the spread of observations.
Range formula:
The formula of the range in statistics can simply be given by the difference between the highest and lowest value.
Range = Highest Value – Lowest Value (Or)
Range = Highest observation – Lowest observation (Or)
Range = Maximum value – Minimum Value
How to find range:
To find the range in statistics, we need to arrange the given values or set of data or set of observations in ascending order. That means, firstly write the observations from the lowest to the highest value. Now, we need to use the formula to find the range of observations.
The given data set: 67, 63, 66, 60, 58, 70, and 75.
Highest value=75
Lowest value=58
Range=75-58
Range=17
Question 3.
Time taken in seconds to solve a puzzle by a group of contestants: 20, 25.6, 15.4, 20, 22.8, 18.7, 19, 24, 13.4, and 16.
Answer:
Range: The range in statistics for a given data set is the difference between the highest and lowest values. For example, if the given data set is {2,5,8,10,3}, then the range will be 10 – 2 = 8.
– Thus, the range could also be defined as the difference between the highest observation and lowest observation. The obtained result is called the range of observation. The range in statistics represents the spread of observations.
Range formula:
The formula of the range in statistics can simply be given by the difference between the highest and lowest value.
Range = Highest Value – Lowest Value (Or)
Range = Highest observation – Lowest observation (Or)
Range = Maximum value – Minimum Value
How to find range:
To find the range in statistics, we need to arrange the given values or set of data or set of observations in ascending order. That means, firstly write the observations from the lowest to the highest value. Now, we need to use the formula to find the range of observations.
The given data set: 20, 25.6, 15.4, 20, 22.8, 18.7, 19, 24, 13.4, and 16
Highest value=25.6
Lowest value=13.4
Range=25.6-13.4
Range=12.2
Question 4.
Average monthly rainfall in centimeters in a city:
18.3, 17.8, 17.3, 8.9, 6.1, 2.0, 1.4, 2.2, 2.8, 5, 12.7, and 14.
Answer:
Range: The range in statistics for a given data set is the difference between the highest and lowest values. For example, if the given data set is {2,5,8,10,3}, then the range will be 10 – 2 = 8.
– Thus, the range could also be defined as the difference between the highest observation and lowest observation. The obtained result is called the range of observation. The range in statistics represents the spread of observations.
Range formula:
The formula of the range in statistics can simply be given by the difference between the highest and lowest value.
Range = Highest Value – Lowest Value (Or)
Range = Highest observation – Lowest observation (Or)
Range = Maximum value – Minimum Value
How to find range:
To find the range in statistics, we need to arrange the given values or set of data or set of observations in ascending order. That means, firstly write the observations from the lowest to the highest value. Now, we need to use the formula to find the range of observations.
The given data set: 18.3, 17.8, 17.3, 8.9, 6.1, 2.0, 1.4, 2.2, 2.8, 5, 12.7, and 14.
Highest value=18.3
Lowest value=1.4
Range=18.3-1.4
Range=16.9
Find the first, second, and third quartiles of each set of data values.
Question 5.
Science test scores of 13 students:
78, 63, 56, 85, 62, 59, 78, 90, 83, 63, 84, 66, and 63.
Answer:
The given data set: 78, 63, 56, 85, 62, 59, 78, 90, 83, 63, 84, 66, and 63.
How to calculate quartiles:
– Order your data set from lowest to highest values
– Find the median. This is the second quartile Q2.
– At Q2 split the ordered data set into two halves.
– The lower quartile Q1 is the median of the lower half of the data.
– The upper quartile Q3 is the median of the upper half of the data.
Now arrange the data from lowest to highest:
56,59,62,63,63,63,66,78,78,83,84,85,90
The second quartile Q2 is easy to find. It is the median of any data set and it divides an ordered data set into upper and lower halves.
Q2=66
n=13
If the size of the data set is odd, do not include the median when finding the first and third quartiles.
Q1=56,59,62,63,63,63
Q1=62+63/2
Q1=125/2
Q1=62.5
Thus, the first quartile Q1 is 62.5
Q3=78,78,83,84,85,90
Q3=83+84/2
Q3=167/2
Q3=83.5
Question 6.
Scores of a basketball team in a series of games:
82, 66, 70, 68, 54, 77, 80, 70, 82, and 65.
Answer:
The given data set: 82, 66, 70, 68, 54, 77, 80, 70, 82, and 65.
How to calculate quartiles:
– Order your data set from lowest to highest values
– Find the median. This is the second quartile Q2.
– At Q2 split the ordered data set into two halves.
– The lower quartile Q1 is the median of the lower half of the data.
– The upper quartile Q3 is the median of the upper half of the data.
Now arrange the data from lowest to highest:
54, 65, 66, 68, 70, 70, 77, 80, 82, 82
The second quartile Q2 is easy to find. It is the median of any data set and it divides an ordered data set into upper and lower halves.
Q2= 70+70/2
Q2=140/2
Q2=70
If the size of the data set is even, the median is the average of the middle 2 values in the data set. Add those 2 values, and then divide by 2. The median splits the data set into lower and upper halves and is the value of the second quartile Q2.
n=10
Q1=54, 65, 66, 68, 70
Q1=66
Q1 is the median of the lower half of the data
Q3=70, 77, 80, 82, 82
Q3=80
Q3 is the median of the upper half of the data
Question 7.
Ages of 20 children at a party:
6, 9, 5, 12, 7, 8, 9, 10, 7, 7, 7, 6, 9, 9, 12, 10, 8, 10, 11, and 9.
Answer:
How to calculate quartiles:
– Order your data set from lowest to highest values
– Find the median. This is the second quartile Q2.
– At Q2 split the ordered data set into two halves.
– The lower quartile Q1 is the median of the lower half of the data.
– The upper quartile Q3 is the median of the upper half of the data.
Now arrange the data from lowest to highest:
5, 6, 6, 7, 7, 7, 7, 8, 8, 9, 9, 9, 9, 9, 10, 10, 10, 11, 12, 12
The second quartile Q2 is easy to find. It is the median of any data set and it divides an ordered data set into upper and lower halves.
Q2=9+9/2
Q2=18/2
Q2=9
If the size of the data set is even, the median is the average of the middle 2 values in the data set. Add those 2 values, and then divide by 2. The median splits the data set into lower and upper halves and is the value of the second quartile Q2.
n=20
Q1=5, 6, 6, 7, 7, 7, 7, 8, 8, 9
Q1=7+7/2
Q1=14/2
Q1=7
Q1 is the median of the lower half of the data
Q3=9, 9, 9, 9, 10, 10, 10, 11, 12, 12
Q3=10+10/2
Q3=20/2
Q3=10
Q3 is the median of the upper half of the data
Question 8.
Heights of 15 tomato plants in inches:
36, 27, 18, 40, 29, 43, 24, 20, 15, 31, 39, 22, 27, 30, and 20.
Answer:
How to calculate quartiles:
– Order your data set from lowest to highest values
– Find the median. This is the second quartile Q2.
– At Q2 split the ordered data set into two halves.
– The lower quartile Q1 is the median of the lower half of the data.
– The upper quartile Q3 is the median of the upper half of the data.
Now arrange the data from lowest to highest:
15, 18, 20, 20, 22, 24, 27, 27, 29, 30, 31, 36, 39, 40, 43
The second quartile Q2 is easy to find. It is the median of any data set and it divides an ordered data set into upper and lower halves.
Q2=27
n=15
If the size of the data set is odd, do not include the median when finding the first and third quartiles.
Q1=15, 18, 20, 20, 22, 24, 27
Q1=20
Q3=29, 30, 31, 36, 39, 40, 43
Q3=36
Use the information and table below to answer questions 9 to 12.
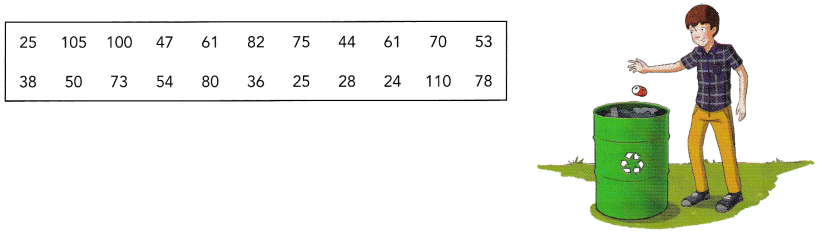
To create greater public awareness of the environment, 22 volunteers collected cans for recycling. The table shows the number of cans each volunteer collected.
Question 9.
Find the range of the number of cans collected.
Answer:
The given data: 25, 105, 100, 47, 61, 82, 75, 44, 61, 70, 53, 38, 50, 73, 54, 80, 36, 25, 28, 24, 110, 78
Range: The range in statistics for a given data set is the difference between the highest and lowest values. For example, if the given data set is {2,5,8,10,3}, then the range will be 10 – 2 = 8.
– Thus, the range could also be defined as the difference between the highest observation and lowest observation. The obtained result is called the range of observation. The range in statistics represents the spread of observations.
Range formula:
The formula of the range in statistics can simply be given by the difference between the highest and lowest value.
Range = Highest Value – Lowest Value (Or)
Range = Highest observation – Lowest observation (Or)
Range = Maximum value – Minimum Value
How to find range:
To find the range in statistics, we need to arrange the given values or set of data or set of observations in ascending order. That means, firstly write the observations from the lowest to the highest value. Now, we need to use the formula to find the range of observations.
range=110-24
range=86
Question 10.
Calculate Q1, Q2, and Q3.
Answer:
How to calculate quartiles:
– Order your data set from lowest to highest values
– Find the median. This is the second quartile Q2.
– At Q2 split the ordered data set into two halves.
– The lower quartile Q1 is the median of the lower half of the data.
– The upper quartile Q3 is the median of the upper half of the data.
Now arrange the data from lowest to highest:
24, 25, 25, 28, 36, 38, 44, 47, 50, 53, 54, 61, 61, 70, 73, 75, 78, 80, 82, 100, 105, 110
The second quartile Q2 is easy to find. It is the median of any data set and it divides an ordered data set into upper and lower halves.
Q2=54+61/2
Q2=115/2
Q2=57.5
n=22 (even number)
If the size of the data set is even, the median is the average of the middle 2 values in the data set. Add those 2 values, and then divide by 2. The median splits the data set into lower and upper halves and is the value of the second quartile Q2.
Q1=24, 25, 25, 28, 36, 38, 44, 47, 50, 53, 54
Q1=38
Q3=61, 61, 70, 73, 75, 78, 80, 82, 100, 105, 110
Q3=78
Question 11.
Find the interquartile range.
Answer:
Definition of interquartile range: The interquartile range defines the difference between the third and the first quartile. Quartiles are the partitioned values that divide the whole series into 4 equal parts. So, there are 3 quartiles. First Quartile is denoted by Q1 known as the lower quartile, the second Quartile is denoted by Q2 and the third
A quartile is denoted by Q3 known as the upper quartile. Therefore, the interquartile range is equal to the upper quartile minus the lower quartile.
Interquartile range formula: The difference between the upper and lower quartile is known as the interquartile range. The formula for the interquartile range is given below:
Interquartile range = Upper Quartile – Lower Quartile = Q3 – Q1
Where Q1 is the first quartile, Q3 is the third quartile.
Q1=38; Q3=78
Interquartile range=Q3-Q1
Interquartile range=78-38
Interquartile range=40
Question 12.
Interpret Q3 and the interquartile range.
Answer:
The third quartile (Q 3), also known as the upper quartile, splits the lowest 75% (or highest 25%) of data. It is the middle value of the upper half. The first quartile is also known as the 25th percentile, the second quartile as 50th percentile, and the third quartile as 75th percentile. The Interquartile range is from Q 1 to Q 3.
Use the information and table below to answer questions 13 to 16.
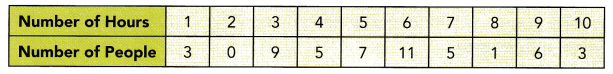
The table shows the results of a survey asking 50 people how many hours they spent using the Internet in a day.
Question 13.
Find the median, the lower quartile, and the upper quartile of the number of hours spent using the Internet.
Answer:
Median: The median of a set of data is the middlemost number or centre value in the set. The median is also the number that is halfway into the set.
To find the median, the data should be arranged, first, in order of least to greatest or greatest to the least value. A median is a number that is separated by the higher half of a data sample, a population or a probability distribution, from the lower half. The median is different for different types of distribution.
Now calculate the cumulative frequency
Cumulative frequency is defined as a running total of frequencies. The frequency of an element in a set refers to how many of that element there are in the set. Cumulative frequency can also be defined as the sum of all previous frequencies up to the current point.
Cumulative frequency for 1 hour=3
Cumulative frequency for 2 hour=3+0=3
Cumulative frequency for 3 hour=3+9=12
Cumulative frequency for 4 hour=5+12=17
Cumulative frequency for 5 hour=7+17=24
Cumulative frequency for 6 hour=11+24=35
Cumulative frequency for 7 hours=5+35=40
Cumulative frequency for 8 hours=1+40=41
Cumulative frequency for 9 hours=6+41=47
Cumulative frequency for 10 hours=47+3=50
n=50
therefore, n/2=50/2=25
24 is nearer to the 25
median=l+(n/2-cf)/f*c
l=lower limit of median class
n=total number of observations
cf=cumulative frequency of the class
preceding the median class
f=frequency of the median class
c=class length
Median=5+(25-17)/7*1
After calculating the above equation
Median=5+(18)/7*1
Meadian=5+(1.14)*1
Median=6.14
If we round the nearest number, then it will be 6 hours.
Lower quartile=(n/4)th term
Lower quartile=50/4
Lower quartile=12.5
We got 12.5 checks the number which is above the 12.5
We have 17: it is 4 hours
Therefore, Q1=4 hours
Q3=(3n/4)th term
Q3=(3*50/4)
Q3=37.5
Now check the number which is having above 37.5.
So the number is 40: 7 hours
Question 14.
Calculate the interquartile range.
Answer:
Interquartile range=upper quartile-lower quartile
Interquartile range=7-4
Interquartile range=3 hours.
Question 15.
Interpret the data values that are greater than the upper quartile.
Answer:
Upper quartile Q3=(3n/4)th term
Upper quartile Q3=(3*50/4)
Upper quartile Q3=37.5
Now check the number which is having above 37.5.
So the number is 40: 7 hours
25% of the people spent at least 7 hours on the internet.
Question 16.
Math journal A majority of the people surveyed spent 6 hours or less using the Internet.” Do you agree with this statement? Justify your argument by using the quartiles.
Answer:
The above quartiles we got are:
Q1= 4 hours
Q2=6 hours
Q3=7 hours.
yes, according to the quartiles Q1 and Q2 majority of the people surveyed spent 6 hours or less using the Internet.
Use the information and table below to answer questions 17 to 21.
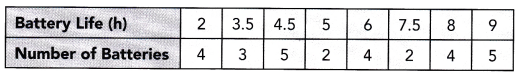
The table shows the lifespans of 29 batteries that were tested.
Question 17.
Find the range of the lifespans.
Answer:
The given data set for lifespan: 2, 3.5, 4.5, 5, 6, 7.5, 8, 9
Range: The range in statistics for a given data set is the difference between the highest and lowest values. For example, if the given data set is {2,5,8,10,3}, then the range will be 10 – 2 = 8.
– Thus, the range could also be defined as the difference between the highest observation and lowest observation. The obtained result is called the range of observation. The range in statistics represents the spread of observations.
Range formula:
The formula of the range in statistics can simply be given by the difference between the highest and lowest value.
Range = Highest Value – Lowest Value (Or)
Range = Highest observation – Lowest observation (Or)
Range = Maximum value – Minimum Value
How to find range:
To find the range in statistics, we need to arrange the given values or set of data or set of observations in ascending order. That means, firstly write the observations from the lowest to the highest value. Now, we need to use the formula to find the range of observations.
Maximum value=9
Minimum value=2
Range=maximum value-minimum value
Range=9-2
Range=7
Therefore, the range of batteries lifespan is 7 hours.
Question 18.
Math Journal Explain why the range is not a good statistic to use for evaluating the lifespans of these batteries.
Answer:
well, it depends on the type of battery and how you are using it. Some batteries have a limited lifespan and others can last for years. So we cannot evaluate the lifespans of these batteries by using the range.
Question 19.
Find the median, the lower quartile, and the upper quartile of the lifespans.
Answer:
Median: The median of a set of data is the middlemost number or centre value in the set. The median is also the number that is halfway into the set.
To find the median, the data should be arranged, first, in order of least to greatest or greatest to the least value. A median is a number that is separated by the higher half of a data sample, a population or a probability distribution, from the lower half. The median is different for different types of distribution.
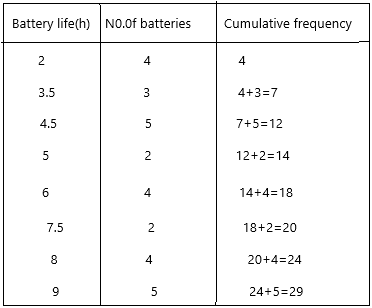
Now calculate the cumulative frequency
Cumulative frequency is defined as a running total of frequencies. The frequency of an element in a set refers to how many of that element there are in the set. Cumulative frequency can also be defined as the sum of all previous frequencies up to the current point.
n=29 (given)
Therefore, n/2=29/2=14.5
Median=1/2[(n/2)th term + (n/2+1)th term]
Median=1/2[ 14.5 + 15.5]
Median=1/2[30]
Median=15
Now check for the number, if the number was not there then check for the 15 above number and write the certain battery lifespan.
15 is not there, the next nearest number is 18 and the battery lifespan is 6 hours.
Median Q2=6 hours.
Q1 lower quartile=(n/4)th term
Q1=29/4
Q1=7.25
Q1=3
the corresponding battery lifespan is 3.5 which is nothing but 4.
Therefore, Q1 is 4 hours.
Q3 upper quartile=(3n/4)th term
Q3=(3*29/4)
Q3=87/4
Q3=21.75
21.75 (22) is not there, the next nearest number is 24 and the battery lifespan is 8 hours.
Q3=8 hours.
Question 20.
Calculate the interquartile range.
Answer:
Upper quartile Q3=8
Lower quartile Q1=4
Interquartile range=upper quartile-lower quartile
Interquartile range=8-4
Interquartile range=4 hours.
Question 21.
Math Journal Compare the lifespans less than the lower quartile to the lifespans greater than the upper quartile. Based on this comparison, do you consider the difference in battery lifespans significant? Explain your reasoning.
Answer:
Q1 lower quartile=(n/4)th term
Q1=29/4
Q1=7.25
Q1=3
the corresponding battery lifespan is 3.5 which is nothing but 4.
Therefore, Q1 is 4 hours.
Q3 upper quartile=(3n/4)th term
Q3=(3*29/4)
Q3=87/4
Q3=21.75
21.75 (22) is not there, the next nearest number is 24 and the battery lifespan is 8 hours.
Q3=8 hours.
The difference is significant. The battery lifespans above the upper quartile are more than double the battery lifespans below the lower quartile.
Question 22.
Math Journal Another statistic used to analyze data is the midrange.
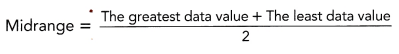
Is the midrange the same as the median of a set of data values? Explain your reasoning by using an example.
Answer:
Midrange in layman terms is the middle of any data set or simply the average, mean of the data. A midrange is a statistical tool that is also known as the measure of centre in statistics. Along with the existence of the midrange formula means, medium, average, mode, and range are also known as the measure of central tendency. The midrange of the data set is simply the value between the biggest value and the lowest value. In order to find the midrange of the data set the value is then divided by 2 after summing the lowest value present in the data set with the highest value present in the data set.
No, the midrange and median are not the same.
Example: The daily temperature recorded in the city of Colombia Bogata is 55, 65, 67, 69, 70, 80, 81, 87, 90. We need to calculate the mid-temperature in Bogata during this period.
According to the midrange formula:
midrange=greatest value-lowest value/2
midrange=90-55/2
midrange=35/2
midrange=17.5
midrange and median are not the same.
Solve.
Question 23.
The finishing times of 40 people in a 100-meter freestyle swimming event were collected. The quartiles for the data are shown:
Q1 = 62.05 seconds, Q2 = 69.16 seconds, and Q3 = 71.43 seconds.

List the letters of all the following statements that are correct.
a) 50% of the swimmers managed to complete the 100-meter event in between 69.16 and 71.43 seconds.
Answer: wrong statement.
The finishing times have already been taken. But in this question the event is not completed so the statement is wrong.
b) 75% of the swimmers took longer than 62.05 seconds to complete the event.
Answer:
The event is completed so the statement is correct.
75%of swimmers mean:
75% of 40 people
75*40/100
=30
30 people took longer than 62.05 seconds to complete the event.
c) Swimmers with times greater than the upper quartile are fast swimmers.
Answer:
The statement is wrong.
The given time is 3 h 35 min 49 sec
The upper quartile time is 71.43 sec is which is nothing but 0.01 hours
swimmers take time greater than the upper quartile might be slower
For example, if a swimmer has taken 75 seconds means he has taken more time to complete the event then he cant be a fast swimmer. So definitely, the statement is correct.
d) Swimmers with times between the first and the second quartiles are faster than the first 10 swimmers who finished the swimming event.
Answer:
the above-given quartiles:
Q1=62.05 seconds,
Q2 = 69.16 seconds
This we cannot say about the faster swimmers. Because we know quartile timings and we don’t know about the first 10 swimmers timings.
In how much time they finished the event. Until we know the finish timings of the first 10 swimmers we cannot tell the Swimmers with times between the first and the second quartiles are faster than the first 10 swimmers who finished the swimming event.
e) The interquartile range shows that the time differences of the middle 50% of the swimmers is not more than 9.38 seconds.
Answer:
interquartile range=Q3-Q1
Interquartile range= 71.43 – 62.05
Interquartile range=9.38
Yes, it is correct.
It is not more than 9.38
therefore, the statement is correct.
f) 50% of the swimmers completed the 100-meter event between 62.05 and 71.43 seconds.
Answer: yes
Nearly 20 people completed the event between 62.05 and 71.43
In the above question, we got the timings of the swimmer that are more than 62.05
definitely, this statement is correct.
g) 25% of the swimmers took 71.43 or more seconds to complete the event.
Answer:
25% means the remaining people completed the event.
25*40/100
=10
10 people took 71.43 or more seconds to complete the event.
h) 10 swimmers completed the event in less than 62.05 seconds.
Answer:
total 40 people have recorded the finishing timings.
20 people took time between 62.05 and 71.43
10 people took time 71.43 or more seconds.
and the other 10 remaining people might take a chance of 62.05 seconds or less than that.
So the statement is correct.
i) The number of swimmers with times between the first and the second quartiles is more than the number of swimmers with times between the second and the third quartiles.
Answer:
The above-given quartiles:
Q1 = 62.05 seconds, Q2 = 69.16 seconds, and Q3 = 71.43 seconds.
This is the record:
total 40 people have recorded the finishing timings.
20 people took time between 62.05 and 71.43
10 people took time 71.43 or more seconds.
and the other 10 remaining people might take a chance of 62.05 seconds or less than that.
By observing the above statements, the given statement is wrong.