Math in Focus Grade 4 Chapter 7 Practice 3 Answer Key Comparing Decimals

Practice the problems of Math in Focus Grade 4 Workbook Answer Key Chapter 7 Practice 3 Comparing Decimals to score better marks in the exam.

Math in Focus Grade 4 Chapter 7 Practice 3 Answer Key Comparing Decimals

Use the number line. Find the number that is described.
Math in Focus Grade 4 Chapter 7 Practice 3 Answer Key Comparing Decimals 1

Question 1.
0.1 more than 0.2. _________
Answer:
Math-in-Focus-Grade-4-Chapter-7-Practice-3-Answer-Key-Comparing-Decimals-Use the number line. Find the number that is described-1

Explanation:
0.1 more than 0.2 = 0.1 + 0.2 = 0.3.


Question 2.
0.3 more than 0.5. ________
Answer:
Math-in-Focus-Grade-4-Chapter-7-Practice-3-Answer-Key-Comparing-Decimals-Use the number line. Find the number that is described-2

Explanation:
0.3 more than 0.5 = 0.3 + 0.5 = 0.8.


Question 3.
0.1 less than 0.6. ___________
Answer:
Math-in-Focus-Grade-4-Chapter-7-Practice-3-Answer-Key-Comparing-Decimals-Use the number line. Find the number that is described-3

Explanation:
0.1 less than 0.6 = 0.6 – 0.1 = 0.5.


Question 4.
0.2 less than 0.9. __________
Answer:
Math-in-Focus-Grade-4-Chapter-7-Practice-3-Answer-Key-Comparing-Decimals-Use the number line. Find the number that is described-4

Explanation:
0.2 less than 0.9 = 0.9 – 0.2 = 0.7.


Use the number line. Find the number that is described.
Math in Focus Grade 4 Chapter 7 Practice 3 Answer Key Comparing Decimals 2

Question 5.
0.01 more than 0.13. __________
Answer:
Math-in-Focus-Grade-4-Chapter-7-Practice-3-Answer-Key-Comparing-Decimals-Use the number line. Find the number that is described-5

Explanation:
0.01 more than 0.13 = 0.01 + 0.13 = 0.14.


Question 6.
0.04 more than 0.16. ______
Answer:
Math-in-Focus-Grade-4-Chapter-7-Practice-3-Answer-Key-Comparing-Decimals-Use the number line. Find the number that is described-6

Explanation:
0.04 more than 0.16 = 0.04 + 0.16 = 0.20.


Question 7.
0.01 less than 0.18. _________
Answer:
Math-in-Focus-Grade-4-Chapter-7-Practice-3-Answer-Key-Comparing-Decimals-Use the number line. Find the number that is described-7

Explanation:
0.01 less than 0.18 = 0.18 – 0.01 = 0.17.


Question 8.
0.05 less than 0.17. _______
Answer:
Math-in-Focus-Grade-4-Chapter-7-Practice-3-Answer-Key-Comparing-Decimals-Use the number line. Find the number that is described-8

Explanation:
0.05 less than 0.17 = 0.17 – 0.05 = 0.12.


Fill in the missing numbers.
Question 9.
Math in Focus Grade 4 Chapter 7 Practice 3 Answer Key Comparing Decimals 3
Answer:
Math-in-Focus-Grade-4-Chapter-7-Practice-3-Answer-Key-Comparing-Decimals-Fill in the missing numbers-9

Explanation:
0.1 more than 4.7 = 0.1 + 4.7 = 4.8.
0.1 less than 4.7 = 4.7 – 0.1 = 4.6.

Question 10.
Math in Focus Grade 4 Chapter 7 Practice 3 Answer Key Comparing Decimals 4
Answer:
Math-in-Focus-Grade-4-Chapter-7-Practice-3-Answer-Key-Comparing-Decimals-Fill in the missing numbers-10

Explanation:
0.1 more than 2.05 = 0.1 + 2.05 = 2.15.
0.1 less than 2.05 = 2.05 – 0.1 = 1.95.


Question 11.
Math in Focus Grade 4 Chapter 7 Practice 3 Answer Key Comparing Decimals 5
Answer:
Math-in-Focus-Grade-4-Chapter-7-Practice-3-Answer-Key-Comparing-Decimals-Fill in the missing numbers-11

Explanation:
0.01 more than 0.94 = 0.01 + 0.94 = 0.95.
0.01 less than 0.94 = 0.94 – 0.01 = 0.93.


Question 12.
Math in Focus Grade 4 Chapter 7 Practice 3 Answer Key Comparing Decimals 6
Answer:
Math-in-Focus-Grade-4-Chapter-7-Practice-3-Answer-Key-Comparing-Decimals-Fill in the missing numbers-12

Explanation:
0.01 more than 3.8 = 0.01 + 3.8 = 3.81.
0.01 less than 3.8 = 3.8 – 0.01 = 3.79.


Complete the number patterns. Use the number line to help you.

Math in Focus Grade 4 Chapter 7 Practice 3 Answer Key Comparing Decimals 7

Question 13.
0.2 0.4 0.6 _________ _________
Answer:
0.2     0.4    0.6   0.8   1.0

Explanation:
0.2     0.4    0.6   0.8   1.0
Difference: 0.4 – 0.2 = 0.2.
0.2 + 0.2 = 0.4.
0.4 + 0.2 = 0.6.
0.6 + 0.2 = 0.8.
0.8 + 0.2 = 1.0
Math-in-Focus-Grade-4-Chapter-7-Practice-3-Answer-Key-Comparing-Decimals-Complete the number patterns-Use the number line to help you-13

Question 14.
1.1 0.9 0.7 _________ ___
Answer:
1.1    0.9    0.7    0.5     0.3

Explanation:
1.1    0.9    0.7    0.5     0.3
Difference: 1.1 – 0.9 = 0.2.
1.1 – 0.2 = 0.9.
0.9 – 0.2 = 0.7.
0.7 – 0.2 = 0.5.
0.5 – 0.2 = 0.3.
Math-in-Focus-Grade-4-Chapter-7-Practice-3-Answer-Key-Comparing-Decimals-Complete the number patterns-Use the number line to help you-14


Question 15.
0.1 0.4 ________ 1.0 _______
Answer:
0.1    0.4     0.7     1.0     1.3.

Explanation:
0.1    0.4     0.7     1.0     1.3.
Difference: 0.4 – 0.1 = 0.3.
0.1 + 0.3 = 0.4.
0.4 + 0.3 = 0.7.
0.7 + 0.3 = 1.0.
1.0 + 0.3 = 1.3.
Math-in-Focus-Grade-4-Chapter-7-Practice-3-Answer-Key-Comparing-Decimals-Complete the number patterns-Use the number line to help you-15


Question 16.
2.0 _________ _________ 0.8 0.4
Answer:
2.0      1.6      1.2     0.8      0.4

Explanation:
2.0      1.6      1.2     0.8      0.4
Difference: 0.8 – 0.4 = 0.4.
2.0 – 0.4 = 1.6.
1.6 – 0.4 = 1.2.
1.2 – 0.4 = 0.8.
0.8 – 0.4 = 0.4.
Math-in-Focus-Grade-4-Chapter-7-Practice-3-Answer-Key-Comparing-Decimals-Complete the number patterns-Use the number line to help you-16

Continue the number patterns.
Question 17.
Math in Focus Grade 4 Chapter 7 Practice 3 Answer Key Comparing Decimals 8
Answer:
0.03     0.06    0.09     0.12     0.15

Explanation:
0.03     0.06    0.09     0.12     0.15
Difference: 0.06 – 0.03 = 0.03.
0.03 + 0.03 = 0.06.
0.06 + 0.03 = 0.09.
0.09 + 0.03 = 0.12.
0.12 + 0.03 = 0.15.
Math-in-Focus-Grade-4-Chapter-7-Practice-3-Answer-Key-Comparing-Decimals-Continue the number patterns-17


Question 18.
Math in Focus Grade 4 Chapter 7 Practice 3 Answer Key Comparing Decimals 9
Answer:
0.24     0.20     0.16      0.12      0.08

Explanation:
0.24     0.20     0.16      0.12      0.08
Difference: 0.24 – 0.20 = 0.04.
0.24 – 0.04 = 0.20.
0.20 – 0.04 = 0.16.
0.16 – 0.04 = 0.12.
0.12 – 0.04 = 0.08.
Math-in-Focus-Grade-4-Chapter-7-Practice-3-Answer-Key-Comparing-Decimals-Continue the number patterns-18

Math in Focus Grade 4 Chapter 8 Practice 4 Answer Key Real-World Problems: Decimals

Practice the problems of Math in Focus Grade 4 Workbook Answer Key Chapter 8 Practice 4 Real-World Problems: Decimals to score better marks in the exam.

Math in Focus Grade 4 Chapter 8 Practice 4 Answer Key Real-World Problems: Decimals

Solve. Show your work.

Example
1 pound of grapes costs $1.79 and 1 pound of peaches costs $1.49. What is the total cost of 1 pound of grapes and 1 pound of peaches?
Cost of grapes + cost of peaches
$1,79 + $1,49 = $3,20
The total cost of 1 pound of grapes and 1 pound of peaches is $323.

Question 1.
A tank is full of water. After 16.5 liters of water are used, 8.75 liters of water are left. How much water was in the full tank?
Answer:
Number of liters of water was in the full tank = 25.25.

Explanation:
Number of liters of water are used = 16.5.
Number of liters of water are left = 8.75.
Number of liters of water was in the full tank = Number of liters of water are used  +  Number of liters of water are left
= 16.5 + 8.75
= 25.25.

Question 2.
A piece of fabric is 4.5 yards long. A customer buys 2.35 yards of the fabric. How many yards of fabric are left?
Answer:
Number of yards of  fabric are left = 2.15.

Explanation:
Number of yards of a piece of fabric = 4.5 yards.
Number of yards of the fabric a customer buys = 2.35 yards.
Number of yards of  fabric are left = Number of yards of a piece of fabric – Number of yards of the fabric a customer buys
= 4.5 – 2.35
= 2.15.

Question 3.
Mr. Larson lives 8.7 miles from school. He was driving home from school and stopped 3.5 miles along the way at a supermarket. How much farther does he have to drive before he reaches home?
Answer:
Number of miles he have to drive before he reaches home = 5.2.

Explanation:
Number of miles Mr. Larson lives from school = 8.7.
Number of miles he was driving home from school and stopped along the way at a supermarket = = 3.5.
Number of miles he have to drive before he reaches home = Number of miles Mr. Larson lives from school – Number of miles he was driving home from school and stopped along the way at a supermarket
= 8.7 – 3.5
= 5.2.

Question 4.
A grocery store is having a sale. A loaf of wheat bread regularly costs $2.29, but the sale price is $1.79. The store is also offering 50¢ off on a gallon of fresh milk. If Mrs. Larson buys a gallon of fresh milk and a loaf of wheat bread, how much does she save on her purchases?
Answer:
Amount of money she save on her purchases = $1.0.

Explanation:
Cost price of a loaf of wheat bread regularly = $2.29.
Selling price of the loaf of wheat bread = $1.79.
Cost of fresh milk a store offering = 50¢.
Amount of money she save on her purchases = (Cost price of a loaf of wheat bread regularly – Selling price of the loaf of wheat bread ) + Cost of fresh milk a store offering
= ($2.29 – $1.79) + 50¢
= $0.5 + 50¢
= $1.0

Question 5.
Lily bought a skirt for $25.90 and a shirt for $19.50. She paid the cashier $50. How much change did she receive?
Answer:
Amount of change she received = $4.6.

Explanation:
Cost of a skirt Lily bought = $25.90.
Cost of a shirt Lily bought = $19.50.
Amount of money she paid the cashier = $50.
Amount of change she received = Amount of money she paid the cashier – (Cost of a skirt Lily bought  + Cost of a shirt Lily bought)
= $50 – ( $25.90 + $19.50)
= $50 – $45.40
= $4.6.


Question 6.
Shannon collects rainwater to water her flowers. She has one bucket with 3.4 gallons of water and another with 1.85 gallons less. She uses both buckets to water the flowers. How many gallons of water does she use?
Answer:
Number of gallons she uses both buckets to water the flowers = 4.95.

Explanation:
Number of gallons one bucket she has = 3.4 gallons.
She has one bucket with 3.4 gallons of water and another with 1.85 gallons less.
=> Number of gallons other bucket she has = Number of gallons one bucket she has – 1.85
=> 3.4 – 1.85
=> 1.55.
Number of gallons she uses both buckets to water the flowers = Number of gallons one bucket she has + Number of gallons other bucket she has
= 3.4 + 1.55
= 4.95.

Math in Focus Grade 4 Chapter 8 Practice 2 Answer Key Adding Decimals

Practice the problems of Math in Focus Grade 4 Workbook Answer Key Chapter 8 Practice 2 Adding Decimals to score better marks in the exam.

Math in Focus Grade 4 Chapter 8 Practice 2 Answer Key Adding Decimals

Fill in the blanks. Write each sum as a decimal.

Example
0.02 + 0.04 = 2 hundredths + 4 hundredths
= 6 hundredths
= 0.06

Question 1.
0.03 + 0.07 = ___ hundredths + ____ hundredths
= ____ hundreths
= _____
Answer:
0.03 + 0.07 = 0.10.

Explanation:
0.03 + 0.07 = 3 hundredths + 7 hundredths
= 10 hundreths
= 0.10.

Question 2.
0.06 + 0.08 = ___ hundredths + ____ hundredths
= ____ hundreths
= _____
Answer:
0.06 + 0.08 = 0.14.

Explanation:
0.06 + 0.08 = 6 hundredths + 8 hundredths
= 14 hundreths.
= 0.14.

Question 3.
0.09 + 0.05 = ___ hundredths + ____ hundredths
= ____ hundreths
= _____
Answer:
0.09 + 0.05 = 0.14.

Explanation:
0.09 + 0.05 = 9 hundredths + 5 hundredths
= 14 hundreths.
= 0.14.

Fill in the blanks.
Question 4.
Math in Focus Grade 4 Chapter 8 Practice 2 Answer Key Adding Decimals 1
Add the hundredths.
4 hundredths + 7 hundredths
= ___ hundredths
Regroup the hundredths.
___ hundredths = ___ tenth ___ hundredth
Step 2
Math in Focus Grade 4 Chapter 8 Practice 2 Answer Key Adding Decimals 2
Add the tenths.
3 tenths + 8 tenths + ___ tenth = ___ tenths
Regroup the tenths.
___ tenths = ___ one and ___ tenths
Step 3
Math in Focus Grade 4 Chapter 8 Practice 2 Answer Key Adding Decimals 3
Add the ones.
2 ones + 0 ones + ___ one = ___ ones
So, 2.34 + 0.87 = ___.
Answer:
2.34 + 0.87 = 3.21.

Explanation:
Step 1:
Math in Focus Grade 4 Chapter 8 Practice 2 Answer Key Adding Decimals 2

Add the hundredths.
4 hundredths + 7 hundredths
= 11 hundredths.
Regroup the hundredths.
11 hundredths = 1 tenth 1 hundredth.
Step 2:
Math in Focus Grade 4 Chapter 8 Practice 2 Answer Key Adding Decimals 2
Add the tenths.
3 tenths + 8 tenths + 1 tenth = 12 tenths.
Regroup the tenths.
12 tenths = 1 one and 2 tenths.
Step 3:
Math in Focus Grade 4 Chapter 8 Practice 2 Answer Key Adding Decimals 3
Add the ones.
2 ones + 0 ones + 1 one = 3 ones.
Math-in-Focus-Grade-4-Chapter-8-Practice-2-Answer-Key-Adding-Decimals-Fill in the blanks-4

Add.
Question 5.
Math in Focus Grade 4 Chapter 8 Practice 2 Answer Key Adding Decimals 4
Answer:
0.02 + 0.35 = 0.37.

Explanation:
Step 1:
Math in Focus Grade 4 Chapter 8 Practice 2 Answer Key Adding Decimals 4

Add the hundredths.
2 hundredths + 5 hundredths
= 7 hundredths.
Step 2:
Math in Focus Grade 4 Chapter 8 Practice 2 Answer Key Adding Decimals 4
Add the tenths.
0 tenths + 3 tenths = 3 tenths.
Step 3:
Math in Focus Grade 4 Chapter 8 Practice 2 Answer Key Adding Decimals 4
Add the ones.
0 ones + 0 ones = 0 ones.
Math-in-Focus-Grade-4-Chapter-8-Practice-2-Answer-Key-Adding-Decimals-Fill in the blanks-5

Question 6.
Math in Focus Grade 4 Chapter 8 Practice 2 Answer Key Adding Decimals 5
Answer:
0.06 + 0.46 = 0.52.

Explanation:
Step 1:
Math in Focus Grade 4 Chapter 8 Practice 2 Answer Key Adding Decimals 5

Add the hundredths.
6 hundredths + 6 hundredths
= 12 hundredths.
Regroup the hundredths.
12 hundredths = 1 tenth 2 hundredth.
Step 2:
Math in Focus Grade 4 Chapter 8 Practice 2 Answer Key Adding Decimals 5
Add the tenths.
0 tenths + 4 tenths + 1 tenth = 5 tenths.
Step 3:
Math in Focus Grade 4 Chapter 8 Practice 2 Answer Key Adding Decimals 5
Add the ones.
0 ones + 0 ones  = 0 ones
Math-in-Focus-Grade-4-Chapter-8-Practice-2-Answer-Key-Adding-Decimals-Fill in the blanks-6

Write in vertical form. Then add.
Question 7.
$0.57 + $0.29 = $ _____
Answer:
$0.57 + $0.29 = $0.86.

Explanation:
Math-in-Focus-Grade-4-Chapter-8-Practice-2-Answer-Key-Adding-Decimals-Write in vertical form-Then add-7

Question 8.
3.6 + 0.54 = ____
Answer:
3.6 + 0.54 = 4.14.

Explanation:
Math-in-Focus-Grade-4-Chapter-8-Practice-2-Answer-Key-Adding-Decimals-Write in vertical form-Then add-8

Question 9.
$0.78 + $0.88 = $____
Answer:
$0.78 + $0.88 = $1.66.

Explanation:
Math-in-Focus-Grade-4-Chapter-8-Practice-2-Answer-Key-Adding-Decimals-Write in vertical form-Then add-9

Question 10.
7.25 + 1.78 = ___
Answer:
7.25 + 1.78 = 9.03.

Explanation:
Math-in-Focus-Grade-4-Chapter-8-Practice-2-Answer-Key-Adding-Decimals-Write in vertical form-Then add-10

Derek hops two steps on each number line. Which decimal does he land on? Write the correct decimal in each box.
Example
Math in Focus Grade 4 Chapter 8 Practice 2 Answer Key Adding Decimals 6

Question 11.
Math in Focus Grade 4 Chapter 8 Practice 2 Answer Key Adding Decimals 7
Answer:
Math-in-Focus-Grade-4-Chapter-8-Practice-2-Answer-Key-Derek hops two steps on each number line-11

Explanation:
10.0 + 1.26 + 2.57
=11.26 + 2.57
= 13.83.

Question 12.
Math in Focus Grade 4 Chapter 8 Practice 2 Answer Key Adding Decimals 8
Answer:
Math-in-Focus-Grade-4-Chapter-8-Practice-2-Answer-Key-Derek hops two steps on each number line-12

Explanation:
50.0 + 2.69 + 1.83
= 52.69 + 1.83
= 54.52.

Question 13.
Math in Focus Grade 4 Chapter 8 Practice 2 Answer Key Adding Decimals 9
Answer:
Math-in-Focus-Grade-4-Chapter-8-Practice-2-Answer-Key-Derek hops two steps on each number line-13

Explanation:
1.2 + 0.36 + 0.38
= 1.56 + 0.38
= 1.94.

Math in Focus Grade 4 Chapter 12 Practice 2 Answer Key Rectangles and Squares

This handy Math in Focus Grade 4 Workbook Answer Key Chapter 12 Practice 2 Rectangles and Squares detailed solutions for the textbook questions.

Math in Focus Grade 4 Chapter 12 Practice 2 Answer Key Rectangles and Squares

Find the perimeter of each figure.

Example

Math in Focus Grade 4 Chapter 12 Practice 2 Answer Key Rectangles and Squares 1
Perimeter of rectangle
= 7 + 4 + 7 + 4
= 22 cm
The perimeter of the rectangle is 22 centimeters.

Question 1.
Math in Focus Grade 4 Chapter 12 Practice 2 Answer Key Rectangles and Squares 2
Perimeter of square = 4 × ___________
= _________ in.
The perimeter of the square is ___________inches.
Answer:
In square all four sides are equal.
Perimeter of square = 4 × 6 in
= 24 in.
The perimeter of the square is 24 inches.

Solve. Show your work.

Example

The perimeter of a square flower garden is 20 feet. Find the length of one side of the flower garden.
Math in Focus Grade 4 Chapter 12 Practice 2 Answer Key Rectangles and Squares 3
Length of one side = perimeter ÷ 4
= 20 ÷ 4
= 5 ft
The length of one side of the flower garden so 5 feet.

Question 2.
The perimeter of a square building is 160 yards. Find the length of one side of the building.
Math in Focus Grade 4 Chapter 12 Practice 2 Answer Key Rectangles and Squares 4
Answer:
Perimeter = 160 yards
Length of one side = perimeter ÷ 4
= 160 yards ÷ 4
= 40 yards
The length of one side of the building is 40 yards.

Solve. Show your work.

Question 3.
A square field has a perimeter of 44 meters. Find the length of one side of the field.
Math in Focus Grade 4 Chapter 12 Practice 2 Answer Key Rectangles and Squares 5
Answer:
Perimeter = 44 m
Length of one side = perimeter ÷ 4
= 44 m ÷ 4
= 11 m
The length of one side of the field is 11 m.

Question 4.
The perimeter of a rectangular town is 32 miles. Its width is 5 miles. Find the length.
Math in Focus Grade 4 Chapter 12 Practice 2 Answer Key Rectangles and Squares 6
Answer:
From the above image we can have a data of width and perimeter.
Length = ?
width = 5 mi
perimeter = 32 mi
Perimeter of the rectangular town = length + width + length + width
32 mi = l + 5 mi + l + 5 mi
32 mi = 2l + 10 mi
32 mi – 10 mi = 2l
22 mi = 2l
11 mi = l
The length of the rectangular town is 11 miles.

Solve. Show your work.

Question 5.
The perimeter of a rectangle is 24 centimeters. Its length is 9 centimeters. Find the width.
Math in Focus Grade 4 Chapter 12 Practice 2 Answer Key Rectangles and Squares 7
Answer:
From the above image we can have a data of length and perimeter.
Length = 9 cm
width = ?
perimeter = 24 cm
Perimeter of the rectangle = length + width + length + width
24 cm = 9 cm + w + 9 cm + w
24 cm= 18 cm + 2w
24 cm – 18 cm = 2w
6 cm = 2w
3 cm = w
The width of the rectangle is 3 cm.

Question 6.
The perimeter of a rectangular garden is 18 yards. Its length is 6 yards. Find the width.
Math in Focus Grade 4 Chapter 12 Practice 2 Answer Key Rectangles and Squares 8
Answer:
From the above image we can have a data of length and perimeter.
Length = 6 yards
width = ?
perimeter = 18 yards
Perimeter of the rectangular garden = length + width + length + width
18 yards = 6 yards + w + 6 yards + w
18 yards = 12 yards + 2w
18 yards – 12 yards = 2w
6 yards = 2w
3 yards = w
The width of the rectangular garden is 3 yards.

Math in Focus Grade 7 Chapter 9 Lesson 9.4 Answer Key Understanding Random Sampling Methods

This handy Math in Focus Grade 7 Workbook Answer Key Chapter 9 Lesson 9.4 Understanding Random Sampling Methods detailed solutions for the textbook questions.

Math in Focus Grade 7 Course 2 B Chapter 9 Lesson 9.4 Answer Key Understanding Random Sampling Methods

Hands-On Activity

Materials:

  • list of names of 40 students
  • a random number table

EXPLORE HOW A RANDOM SAMPLING PROCESS AFFECTS DATA COLLECTION

Work in groups of four or five.

STEP 1: Choose 40 students to participate in this activity. They will be asked how long it took them to get to school today.
Math in Focus Grade 7 Chapter 9 Lesson 9.4 Answer Key Understanding Random Sampling Methods 1

STEP 2: Assign each of the 40 students a 2-digit number from 01 to 40.

STEP 3: Use the random number table to pick five 2-digit numbers. Discard any 2-digit numbers greater than 40.
Math in Focus Grade 7 Chapter 9 Lesson 9.4 Answer Key Understanding Random Sampling Methods 2
STEP 4: Ask the 5 students whose numbers match those you picked in STEP 3 the following question and record the results. About how many minutes did it take you to commute to school today?

STEP 5: Find the mean and the mean absolute deviation of the data you collected in STEP 4.

STEP 6: Repeat STEP 3 to STEP 5 to generate new random samples, and to collect and analyze the data from each sample.

Math Journal Does the mean number of minutes vary greatly from sample to sample? Does the mean absolute deviation vary greatly from sample to sample? What are some problems you encountered in the random sampling process? Describe.
Answer:
We got by adding those two-digit numers:
Mean=sum of observations/number of observations.
Mean=4+18+19+27+37/5
Mean=105/5
Mean=21
Now calculate the Mean absolute deviation.
First, subtract the data set values from the mean
|4-21|=17
|18-21|=3
|19-21|=2
|27-21|=6
|37-21|=16
MAD=17+3+2+6+16/5
MAD=44/5
MAD=8.8
Mean varies greatly from sample to sample. comparing to mean MAD varies less.
It is easy to get the data wrong just as it is easy to get right.
The application of random sampling is only effective when all potential respondents are included within the large sampling frame. Everyone or everything that is within the demographic or group being analyzed must be included for the random sampling to be accurate. If the sampling frame is exclusionary, even in a way that is unintended, then the effectiveness of the data can be called into question and the results can no longer be generalized to the larger group.

Hands-On Activity

Materials:

  • computer
  • relevant books

COMPARE THE STRENGTHS AND WEAKNESSES OF RANDOM SAMPLING METHODS

Work in pairs.

Back ground
Every sampling method has its own strengths and weaknesses. Each method is designed for specific purposes. Sometimes you may find more than one method can be used in a particular situation. At another time, you may find it necessary to combine two methods to obtain the best possible random sample.
Be creative when you apply a random sampling method!

STEP 1: Research the strengths and weaknesses of the three random sampling methods.
STEP 2: Compile the information in a table shown below.
Math in Focus Grade 7 Chapter 9 Lesson 9.4 Answer Key Understanding Random Sampling Methods 3
Math Journal Do you find that a weakness of one method can be addressed by another method? Explain.
Answer:
strengths of stratified:
– Has greater ability to make inferences within a stratum and comparisons across strata.
– Has slightly smaller random sampling errors for samples of the same sample size, thereby requiring smaller sample sizes for the same margin of error
– Obtains a more representative sample because it ensures that elements from each stratum are represented in the sample.
Weaknesses:
– Requires information on the proportion of the total population that belongs to each stratum
– Information on stratification variables is required for each element in the population. If such information is not readily available, it may be costly to compile.
– More expensive, time-consuming, and complicated than simple random sampling.
Simple random sampling:
Compared to other probability sampling procedures, simple random sampling has several strengths that should be considered in choosing the type of probability sample design to use Some of these include:
• Advanced auxiliary information on the elements in the population is not required. Such information is required for other probability sampling procedures, such as stratified sampling.
• Each selection is independent of other selections, and every possible combination of sampling units has an equal and independent chance of being selected. In systematic sampling, the chances of being selected are not independent of each other.
• It is generally easier than other probability sampling procedures (such as multistage cluster sampling) to understand and communicate to others.
• Statistical procedures required to analyze data and compute errors are easier than those required of other probability sampling procedures.
On the other hand, simple random sampling has important weaknesses. Compared to other probability sampling procedures, simple random samplings have the following weaknesses:
• A sampling frame of elements in the target population is required. An appropriate sampling frame may not exist for the population that is targeted, and it may not be feasible or practical to construct one. Alternative sampling procedures, such as cluster sampling, do not require a sampling frame of the elements of the target population.
• Simple random sampling tends to have larger sampling errors and less precision than stratified samples of the same sample size. Respondents may be widely dispersed; hence, data collection costs might be higher than those for other probability sample designs such as cluster sampling.
• Simple random sampling may not yield sufficient numbers of elements in small subgroups. This would not make simple random sampling a good choice for studies requiring comparative analysis of small categories of the population with much larger categories of the population
Strengths of systematic random sampling:
1. If the selection process is manual, systematic sampling is easier, simpler, less time-consuming, and more economical.
2. The target population need not be numbered and a sampling frame compiled if there is a physical representation.
3. If the ordering of the elements in the sampling frame is randomized, systematic sampling may yield results similar to simple random sampling.
Weaknesses:
1. If the sampling interval is related to the periodic ordering of the elements in the sampling frame, increased variability may result.
2. Combinations of elements have different probabilities of being selected.
3. Technically, only the selection of the first element is a probability selection since for subsequent selections, there will be elements of the target population that will have a zero chance of being selected.

Math in Focus Grade 7 Chapter 9 Lesson 9.4 Guided Practice Answer Key

Determine which sampling method is best suited for each situation.

Question 1.
Describe how you would carry out the sampling process. You may use a combination of methods, if you see fIt. Justify your process.
Scenario 1
A truck load of 3OOO oranges were delivered to a wholesale market. You are allowed to check 1% of the oranges as a random sample before deciding whether to accept the shipment.

Scenario 2
A grocer would like to find what items the store should carry to attract more customers. The grocer wants to survey loo people in the neighbourhood.
Answer:
Scenario 1:  Systematic random sampling: Scenario 1 uses random sampling because you want the sample to cover a wide range of oranges in the shipment.
Scenario 2: Simple random sampling: Scenario 2 uses simple random sampling because it is just an opinion poll of people in the neighbourhood.

Math in Focus Course 2B Practice 9.5 Answer Key

Answer the following.

Question 1.
Explain what a random sampling process is.
Answer:
Random sampling is a method of choosing a sample of observations from a population to make assumptions about the population. It is also called probability sampling. The counterpart of this sampling is Non-probability sampling or Non-random sampling. The primary types of this sampling are simple random sampling, stratified sampling, cluster sampling, and multistage sampling. In the sampling methods, samples that are not arbitrary are typically called convenience samples.
The primary feature of probability sampling is that the choice of observations must occur in a ‘random’ way such that they do not differ in any significant way from observations, which are not sampled. We assume here that statistical experiments contain data that is gathered through random sampling.

Question 2.
Give an example of how a random sampling process is used in a real-world situation.
Answer:
– At a birthday party, teams for a game are chosen by putting everyone’s name into a jar, and then choosing the names at random for each team.
– On an assembly line, each employee is assigned a random number using computer software. The same software is used periodically to choose a number of the employees to be observed to ensure they are employing best practices.
– A restaurant leaves a fishbowl on the counter for diners to drop their business cards. Once a month, a business card is pulled out to award one lucky diner with a free meal.
– At a bingo game, balls with every possible number are placed inside a mechanical cage. The caller rotates the cage, tumbling around the balls inside. Then, she selects one of the balls at random to be called, like B-12 or O-65.
– A pharmaceutical company wants to test the effectiveness of a new drug. Volunteers are assigned randomly to one of two groups. The first group will receive the new drug; the second group will receive a placebo.

Question 3.
Why do people want to use random samples to collect information about a population?
Answer:
Random sampling offers two primary advantages. Because individuals who make up the subset of the larger group are chosen at random, each individual in the large population set has the same probability of being selected. This creates, in most cases, a balanced subset that carries the greatest potential for representing the larger group as a whole.
Moreover, they want to collect information to understand the characteristics of the population.

Question 4.
Explain why a biased sample is not an appropriate sample.
Answer:
Sampling bias occurs when some members of a population are systematically more likely to be selected in a sample than others. It is also called ascertainment bias in medical fields. Sampling bias limits the generalizability of findings because it is a threat to external validity, specifically population validity. In other words, findings from biased samples can only be generalized to populations that share characteristics with the sample.

State which sampling method is being described.

Question 5.
A frozen yogurt store sells 5 flavors: vanilla, chocolate, strawberry, macadamia nut, and peppermint. To check the quality of the frozen yogurt, 5 tubs of each flavor were sampled.
Math in Focus Grade 7 Chapter 9 Lesson 9.4 Answer Key Understanding Random Sampling Methods 4
Answer: Stratified random sampling.
Definition: In this sampling method, a population is divided into subgroups to obtain a simple random sample from each group and complete the sampling process (for example, number of girls in a class of 50 strength). These small groups are called strata. The small group is created based on a few features in the population. After dividing the population into smaller groups, the researcher randomly selects the sample.

Question 6.
A group of students conducted an online poll of Internet users by randomly selecting 500 Internet users.
Answer: Clustered sampling
Definition:
Cluster sampling is similar to stratified sampling, besides the population is divided into a large number of subgroups (for example, hundreds of thousands of strata or subgroups). After that, some of these subgroups are chosen at random and simple random samples are then gathered within these subgroups. These subgroups are known as clusters. It is basically utilised to lessen the cost of data compilation.

Question 7.
To check the freshness of the bagels at a bakery, the baker randomly picked 5 bagels at an interval of every hour.
Answer: Systematic random sampling
In this method, the items are chosen from the destination population by choosing the random selecting point and picking the other methods after a fixed sample period. It is equal to the ratio of the total population size and the required population size.

Question 8.
Unique numbers were assigned to the members of a country club. The club manager used a random number generator to choose 150 numbers that were matched to members of the club.
Answer: Stratified random sampling.
In this sampling method, a population is divided into subgroups to obtain a simple random sample from each group and complete the sampling process (for example, number of girls in a class of 50 strength). These small groups are called strata. The small group is created based on a few features in the population. After dividing the population into smaller groups, the researcher randomly selects the sample.

Question 9.
Out of 100 students, the teachers randomly choose the first student and every sixth student thereafter.
Answer: Systematic random sampling
In this method, the items are chosen from the destination population by choosing the random selecting point and picking the other methods after a fixed sample period. It is equal to the ratio of the total population size and the required population size.

Question 10.
To assess pollution levels in a region, water samples are taken from 5 rivers and 2 lakes for analysis.
Answer: Stratified random sampling.
In this sampling method, a population is divided into subgroups to obtain a simple random sample from each group and complete the sampling process (for example, number of girls in a class of 50 strength). These small groups are called strata. The small group is created based on a few features in the population. After dividing the population into smaller groups, the researcher randomly selects the sample.

Refer to the situation to answer the following.

Question 11.
Math Journal A corn field is divided into five areas. To determine whether the corn plants are healthy, you are asked to collect a random sample of 100 ears of corn for analysis.
a) If you use a stratified random sampling method, describe how you will go about collecting the random sample.
Answer:
In this sampling method, a population is divided into subgroups to obtain a simple random sample from each group and complete the sampling process (for example, number of girls in a class of 50 strength). These small groups are called strata. The small group is created based on a few features in the population. After dividing the population into smaller groups, the researcher randomly selects the sample.
according to the definition, we can write:
The 5 areas of the cornfield constitute 5 groups of corn plants. 20 ears of corn are randomly selected from each group.

b) Explain why the stratified random sampling method is preferred.
Answer:
It gives a fair representation of each of the five areas that’s why the stratified random sampling method is preferred.

Question 12.
Math Journal Explain why the simple sampling method may not give you a representative sample.
Answer:
When a sample is not representative, we will have a sampling error known as the margin of error. If we want to have a representative sample of 100 employees, we must choose a similar number of men and women. For example, if we have a sample inclined to a specific genre, then we will have an error in the sample.
The sample size is essential, but it does not guarantee that it accurately represents the population that we need. More than size, representativeness is related to the sampling frame, that is, to the list from which people are selected, for example, part of a survey. Therefore, we must take care that people from our target audience are included in that list to say that it is a representative sample.

Refer to the situation below to answer the following.

2,000 runners participated in a marathon. You want to randomly choose 60 of the runners to find out how long ¡t took each one to run the race.

Question 13.
Describe how you would select the 60 runners if you use a simple random sampling method.
Answer:
In this sampling method, each item in the population has an equal and likely possibility of getting selected in the sample (for example, each member in a group is marked with a specific number). Since the selection of item completely depends on the possibility, therefore this method is called the “Method of chance Selection. Also, the sample size is large, and the item is selected randomly. Thus it is known as “Representative Sampling”.
According to the definition:
Pick runners randomly in the marathon to interview until 60 runners have been interviewed.

Question 14.
Describe how you would select the 60 runners if you use a systematic random sampling method.
Answer:
In this method, the items are chosen from the destination population by choosing the random selecting point and picking the other methods after a fixed sample period. It is equal to the ratio of the total population size and the required population size.
according to the definition:
Picking a few numbers out of a hat, but you can use any number of runners as long as you have a minimum size.

Question 15.
Describe how you would select the 60 runners if you use the stratified random sampling method.
Answer:
In this sampling method, a population is divided into subgroups to obtain a simple random sample from each group and complete the sampling process (for example, number of girls in a class of 50 strength). These small groups are called strata. The small group is created based on a few features in the population. After dividing the population into smaller groups, the researcher randomly selects the sample.
According to the definition:
Use age bands, for example, select randomly 15 runners from each of the 4 age bands. Below 20, 20 to 30, 30 to 40, and above 40.

Refer to the situation below to answer the following.

There are 1,650 trees growing in 5 areas within a park. The trees are numbered from 1 to 1,650. A systematic random sample of 40 trees is needed to check whether there are fungi causing root rot among the trees.

Question 16.
Describe how you would carry out a systematic random sampling.
Answer:
In this method, the items are chosen from the destination population by choosing the random selecting point and picking the other methods after a fixed sample period. It is equal to the ratio of the total population size and the required population size.
According to the definition:
Out of 1,650 trees, the researchers randomly choose the first tree and every sixth tree thereafter. Likewise, they select the fixed sample tree and check the trees if they are fungi causing root among the trees.

Question 17.
Describe how you would carry out a stratified random sampling.
Answer:
In this sampling method, a population is divided into subgroups to obtain a simple random sample from each group and complete the sampling process (for example, number of girls in a class of 50 strength). These small groups are called strata. The small group is created based on a few features in the population. After dividing the population into smaller groups, the researcher randomly selects the sample.
According to the definition:
Use the 5 areas of 5 groups of trees in the park and randomly select 8 trees within each area.

Refer to the situation below to answer the following.

Question 18.
A poll is taken in a small town to find out which candidate voters will choose in an election. A stratified sampling method is used to generate a random sample of 500 residents. The table shows the town population and the sample size within each group.
Math in Focus Grade 7 Chapter 9 Lesson 9.4 Answer Key Understanding Random Sampling Methods 5
a) The stratified random sample has been criticized for not being representative of the population. What could possibly be the problem with the random sample?
Answer:
In the stratified random sampling method, we divide the groups into subgroups but in the representative the sample size is large, and the item is selected randomly. Moreover, the problem with the random sample is below:
1. No additional knowledge is taken into consideration.
Here a number of residents are more: 5000-men; 8000 women. From this, we need to select 500 residents in total.
Although random sampling removes an unconscious bias that exists, it does not remove an intentional bias from the process. Researchers can choose regions for random sampling where they believe specific results can be obtained to support their own personal bias. No additional knowledge is given consideration from the random sampling, but the additional knowledge offered by the researcher gathering the data is not always removed.
2. It is a complex and time-consuming method of research. With random sampling, every person or thing must be individually interviewed or reviewed so that the data can be properly collected. When individuals are in groups, their answers tend to be influenced by the answers of others. This means a researcher must work with every individual on a 1-on-1 basis. This requires more resources, reduces efficiencies, and takes more time than other research methods when it is done correctly.

b) How would you improve the above stratified random sampling?
Answer:
1. Stratified Random Sampling provides better precision as it takes the samples proportional to the random population.
2. Stratified Random Sampling helps minimize the biasness in selecting the samples.
3. Stratified Random Sampling ensures that no section of the population is underrepresented or overrepresented.
4. As this method provides greater precision, a greater level of accuracy can be achieved even by using a small size of samples. This saves resources.

Math in Focus Grade 7 Chapter 9 Lesson 9.5 Answer Key Making Inferences About Populations

This handy Math in Focus Grade 7 Workbook Answer Key Chapter 9 Lesson 9.5 Making Inferences About Populations detailed solutions for the textbook questions.

Math in Focus Grade 7 Course 2 B Chapter 9 Lesson 9.5 Answer Key Making Inferences About Populations

Math in Focus Grade 7 Chapter 9 Lesson 9.5 Guided Practice Answer Key

Solve.

Question 1.
A random sample of ages {15, 5, 8, 7, 18, 6, 15, 17, 6, 15} of 10 children was collected from a population of 100 children.
a) Calculate the sample mean age of the children and use it to estimate the population mean age.
Answer:
Mean is the average of the given numbers and is calculated by dividing the sum of given numbers by the total number of numbers.
Mean=Sum of observations/total number of observations
Mean=15+5+8+7+18+6+15+17+6+15/10
Mean=112/10
Mean=11.2 years.

b) Calculate the MAD of the sample.
Answer:
Now we got mean in the above question:
Mean=11.2 years. So calculate MAD.
The ratio of the sum of all absolute values of deviation from central measure to the total number of observations.
M.A. D = (Σ Absolute Values of Deviation from Central Measure) / (Total Number of Observations)
How to calculate MAD:
Steps to find the mean deviation from mean:
(i)Find the mean of the given observations.
(ii)Calculate the difference between each observation and the calculated mean
(iii)Evaluate the mean of the differences obtained in the second step.
This gives you the mean deviation from the mean.
Mean=11.2
The given data set: 15, 5, 8, 7, 18, 6, 15, 17, 6, 15
|15-11.2|=3.8
|5-11.2|=6.2
|8-11.2|=3.2
|7-11.2|=4.2
|18-11.2|=6.8
|6-11.2|=5.2
|15-11.2|=3.8
|17-11.2|=5.8
|6-11.2|=5.2
|15-11.2|=3.8
Now calculate MAD:
MAD=3.8+6.2+3.2+4.2+6.8+5.2+3.8+5.8+5.2+3.8/10
MAD=48/10
MAD=4.8 years

c) Calculate the MAD to mean ratio.
Answer:
About 43%
To calculate MAD to mean:
4.8 is what percent of 11.2
4.8/11.2*100%
After calculating the above equation we get:
=42.857
=43 (rounded to the nearest number).

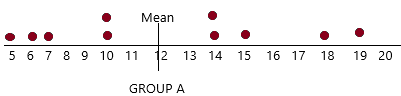
d) Draw a dot plot for the ages and the mean age.
Answer:
A dot plot visually groups the number of data points in a data set based on the value of each point. This gives a visual depiction of the distribution of the data, similar to a histogram or probability distribution function. Dot plots allow a quick visual analysis of the data to detect the central tendency, dispersion, skewness, and modality of the data.
The given data set: 15, 5, 8, 7, 18, 6, 15, 17, 6, 15
Math in Focus Grade 7 Chapter 9 Lesson 9.5 Answer Key Making Inferences About Populations q1

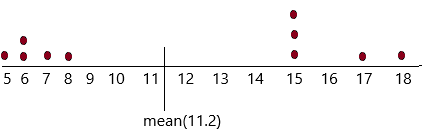
e) Using the MAD to mean ratio and the dot plot, describe informally how varied the population ages are.
Answer:
Since the MAD to mean ratio is about 43%, the data vary from the mean significantly. The dot plot confirms that the data are spread far away from the mean.

Hands-On Activity

Materials
a novel with 200 to 300 pages

USE STATISTICS FROM A SAMPLE TO DESCRIBE THE VARIABILITY OF A POPULATION

Work in pairs.

The activity can be a collaborative effort for the whole class.

Background
The population is made up of all the words in a book. The length of a word is defined by the number of letters in it. The population characteristic is the mean word length.

STEP 1: Determine which sampling method you intend to use.

STEP 2: Generate five random samples. Each sample consists of 20 words.

STEP 3: For the 20 words in each sample, record each word and its length in a table like the one shown. Then calculate the mean and the mean absolute deviation for each sample.
Math in Focus Grade 7 Chapter 9 Lesson 9.5 Answer Key Making Inferences About Populations 1

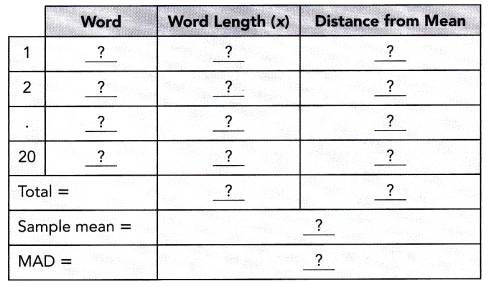
STEP 4: When you have completed STEP 1 to STEP 3 for all 20 samples, calculate the mean of the sample means.

Math journal What is the estimate of the population mean word length? By observing the mean absolute deviations of the five samples, describe informally whether the words in the book vary greatly in length.
Answer:

Solve.

Question 2.
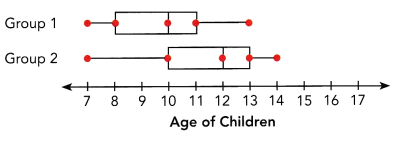
The ages of two groups of children are summarized in the box plots.
Math in Focus Grade 7 Chapter 9 Lesson 9.5 Answer Key Making Inferences About Populations 2
a) Show that the two groups have the same measure of variation (that is, the difference between quartiles) and the same interquartile range.
Answer:
The above box plot gives the data:
Group 1 data:
lowest number=7
Q1=8; Q2=10; Q3=11
Highest number=13
Group 2 data:
lowest number=7
Q1=10; Q2=12; Q3=13
Highest number=14
To show the same measure of variation
Group 1: Q2-Q1=10-8=2
Q3-Q2=1
Interquartile range=Q3-Q1
Interquartile range=11-8
Interquartile range=3
Group 2 calculation:
Q2-Q1=12-10=2
Q3-Q2=13-12=1
Interquartile range=Q3-Q1
Interquartile range=13-10
Interquartile range=3

b) Express the difference in median age in terms of the interquartile range.
Answer:
The above box plot gives the data:
Group 1 data:
lowest number=7
Q1=8; Q2=10; Q3=11
Highest number=13
Group 2 data:
lowest number=7
Q1=10; Q2=12; Q3=13
Highest number=14
We got the interquartile range for group 1 and group 2 is 3
The difference in median age in terms of IQR=X
X= Q2 of group1 – Q2 of group 2 /IQR
X=12-10/3
X=2/3 yr

c) What inference can you draw about the age distributions of the children in the two groups?
Answer:
The above box plot gives the data:
Group 1 data:
lowest number=7
Q1=8; Q2=10; Q3=11
Highest number=13
Group 2 data:
lowest number=7
Q1=10; Q2=12; Q3=13
Highest number=14
Since Q1 of group 2 is the same as the Q2 of group 1, it means that 75% of children in group 2 are older than 50% of children in group 1. Also, the median of group 2 is greater than the median of group 1. So the children in group 2 are generally older than group 1.

Question 3.
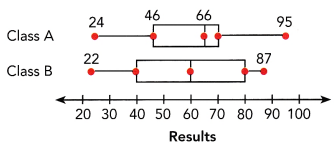
Two classes took a math test. The results are summarized in the box plots.
Math in Focus Grade 7 Chapter 9 Lesson 9.5 Answer Key Making Inferences About Populations 3
a) For which class are the data more spread out? Explain.
Answer: Class B
Class A data set:
Lowest number=24
Q1=46; Q2=66; Q3=70
Highest number=95
Class B data set:
Lowest number=22
Q1=40; Q2=60; Q3=80
Highest number=87
Now calculate the interquartile range:
IQR of class A=Q3-Q1
IQR of class A=70-46
IQR of class A=24
IQR of class B=Q3-Q1
IQR of class B=80-40
IQR of class B=40
Therefore, class B data are more spread out than class A because the interquartile range of class B is greater.

b) Comment on the performance of the two classes.
Answer:
Class A data set:
Lowest number=24
Q1=46; Q2=66; Q3=70
Highest number=95
Class B data set:
Lowest number=22
Q1=40; Q2=60; Q3=80
Highest number=87
Now here we need to check the performance according to the value of the median.
The median value of class A is 66
The median value of class B is 60
Thus, class A performed moderately better than class B because the median of class A is slightly higher at 66 and class B is 60.

Question 4.
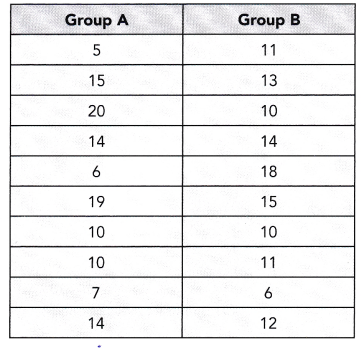
The numbers of questions that two groups of students answered correctly in a recent mathematics test are shown in the table.
Math in Focus Grade 7 Chapter 9 Lesson 9.5 Answer Key Making Inferences About Populations 4
a) Find the mean number of correct questions for each of the two groups.
Answer:
Mean is the average of the given numbers and is calculated by dividing the sum of given numbers by the total number of numbers.
Mean=Sum of observations/total number of observations
Mean of group A=5+15+20+14+6+19+10+10+7+14/10
Mean of group A=120/10
Mean of group A=12
Now calculate the mean for group B:
Mean of group B=11+13+10+14+18+15+10+11+6+12/10
Mean of group B=120/10
Mean of group B=12

b) Calculate the mean absolute deviation of each of the two groups.
Answer:
Now we got mean in the above question:
Mean of group A=12
Mean of group B=12. So calculate MAD.
The ratio of the sum of all absolute values of deviation from central measure to the total number of observations.
M.A. D = (Σ Absolute Values of Deviation from Central Measure) / (Total Number of Observations)
How to calculate MAD:
Steps to find the mean deviation from mean:
(i)Find the mean of the given observations.
(ii)Calculate the difference between each observation and the calculated mean
(iii)Evaluate the mean of the differences obtained in the second step.
This gives you the mean deviation from the mean.
The MAD of group A:
Data set of group A=5, 15, 20, 14, 6, 19, 10, 10, 7, 14
Mean=12
|5-12|=7
|15-12|=5
|20-12|=8
|14-12|=2
|6-12|=6
|19-12|=7
|10-12|=2
|10-12|=2
|7-12|=5
|14-12|=2
Now find the mean of the obtained differences:
MAD of group A=7+5+8+2+6+7+2+2+5+2/10
MAD of group A=46/10
MAD of group A=4.6
Now calculate the MAD of group B
Mean=12
data set of group B=11, 13, 10, 14, 18, 15, 10, 11, 6, 12
|11-12|=1
|13-12|=1
|10-12|=2
|14-12|=2
|18-12|=6
|15-12|=3
|10-12|=2
|11-12|=1
|6-12|=6
|12-12|=0
Now find the mean of the obtained differences:
MAD of group B=1+1+2+2+6+3+2+1+6+0/10
MAD of group B=24/10
MAD of group B=2.4

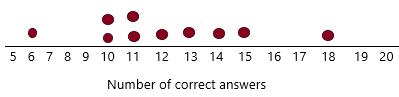
c) Draw separate dot plots for the two groups.
Answer:
A dot plot visually groups the number of data points in a data set based on the value of each point. This gives a visual depiction of the distribution of the data, similar to a histogram or probability distribution function. Dot plots allow a quick visual analysis of the data to detect the central tendency, dispersion, skewness, and modality of the data.
Dot plot for group A:
Math in Focus Grade 7 Chapter 9 Lesson 9.5 Answer Key Making Inferences About Populations q4
Dot plot for group B:
Math in Focus Grade 7 Chapter 9 Lesson 9.5 Answer Key Making Inferences About Populations q4.1

d) Interpret the above statistics and the dot plots.
Answer:
from the two-dot plots in above question (C), group A’s data are more scattered away from the mean and group B’s data cluster more closely around the mean. This explains why the MAD of group A is greater then that of group B.

e) What conclusion can you make about the performance of the two groups of students on the test?
Answer:
Group A’s performance is more varied whereas group B’s performance is more uniform.

Math in Focus Course 2B Practice 9.5 Answer Key

Solve. Show your work.

Question 1.
A random sample of a certain type of ball bearing produces a mean weight of 28 grams and a mean absolute deviation of 2.1 grams. What can be inferred from the sample about the population mean weight of this type of ball bearing?
Answer:
The above-given question:
The mean weight of ball bearing produces=28 grams
The mean absolute deviation=2.1 grams.
this can be calculated as:
2.1/28*100%
After calculating the above equation we get
=7.5%
Therefore, the estimated population mean weight is 28 grams with a MAD to mean ratio of 7.5%

Question 2.
You interviewed a random sample of 25 marathon runners and compiled the following statistics.
Mean time to complete the race = 220 minutes and MAD = 50 minutes What can you infer about the time to complete the race among the population of runners represented by your sample?
Answer:
The mean time to complete the race=220
The given MAD=50 min
This can be calculated as:
50/220*100%
After calculating the above equation we get
=22.72%
Therefore, the time to complete the race among the population of runners represented by your sample is 22.72%

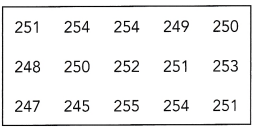
Refer to the random sample below to answer the following. Round your answers to the nearest tenth.

The table shows a random sample of the volume, in milliliters, of 15 servings of orange juice from a vending machine.
Math in Focus Grade 7 Chapter 9 Lesson 9.5 Answer Key Making Inferences About Populations 5

Question 3.
Use the sample mean volume to estimate the population mean volume of a serving of orange juice.
Answer:
The above-given data: 251, 254, 254, 249, 250, 248, 250, 252, 251, 253, 247, 245, 255, 254, 251
Mean is the average of the given numbers and is calculated by dividing the sum of given numbers by the total number of numbers.
Mean=Sum of observations/total number of observations
Mean=251+254+254+249+250+248+250+252+252+253+247+245+255+254+251/15
Mean=3764/15
Mean=250.93 ml
therefore, the sample means volume to estimate the population mean volume of a serving of orange juice is 250.93ml.

Question 4.
Calculate the MAD and the MAD to mean ratio.
Answer:
The ratio of the sum of all absolute values of deviation from central measure to the total number of observations.
M.A. D = (Σ Absolute Values of Deviation from Central Measure) / (Total Number of Observations)
How to calculate MAD:
Steps to find the mean deviation from mean:
(i)Find the mean of the given observations.
(ii)Calculate the difference between each observation and the calculated mean
(iii)Evaluate the mean of the differences obtained in the second step.
This gives you the mean deviation from the mean.
The above-given data: 251, 254, 254, 249, 250, 248, 250, 252, 251, 253, 247, 245, 255, 254, 251
Mean=250.9
Now subtract:
|251-250.9|=0.1
|254-250.9|=3.1
|254-250.9|=3.1
|249-250.9|=1.9
|250-250.9|=0.9
|248-250.9|=2.9
|250-250.9|=0.9
|252-250.9|=1.1
|251-250.9|=0.1
|253-250.9|=2.1
|247-250.9|=3.9
|245-250.9|=5.9
|255-250.9|=4.1
|254-250.9|=3.1
|251-250.9|=0.1
Now calculate the mean of obtained differences.
MAD=0.1+3.1+3.1+1.9+0.9+2.9+0.9+1.1+0.1+2.1+3.9+5.9+4.1+3.1+0.1/15
MAD=33.3/15
MAD=2.22
Now we know mean and MAD from this we can calculate ratio.
Ratio=2.22/250.9*100%
Ratio=0.88%

Question 5.
Use the MAD to informally infer whether the volume of orange juice in a serving varies greatly.
Answer:
The mean=250.9
The mean deviation=2.22
As the average deviation from the mean is less than 1%, the volume of orange juice per serving does not vary significantly.

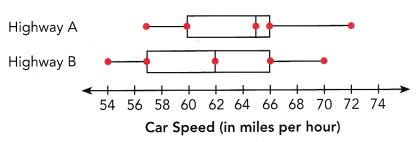
Refer to the box plots at the right to answer the following.

Two large random samples of car speeds on two highways from 4 P.M. to 6 P.M. were collected. The data were summarized in two box plots.
Math in Focus Grade 7 Chapter 9 Lesson 9.5 Answer Key Making Inferences About Populations 6

Question 6.
By comparing the interquartile ranges of the two box plots, what can you infer about car speeds on the two highways for the middle 50% of the cars?
Answer:
The above-given data:
The highway A data:
Lower value=57
Q1=60; Q2=65; Q3=66
Highest value=72
The Highway B data:
Lower value=54
Q1=57; Q2=62; Q3=66
Highest value=70
From this we can calculate the Interquartile range:
IQR=Q3-Q1
IQR of highway A=66-60
IQR of highway A=6
now calculate the interquartile range of highway B:
IQR of highway B=Q3-Q1
IQR of highway B= 66-57
IQR of highway B=9
By comparing the interquartile ranges of the two box plots, the highway B car speeds are more for 50% of the middle cars. Because the interquartile range of highway B is greater than that of highway A.

Question 7.
By comparing the medians of the two plots, what inference can you make?
Answer:
The above-given data:
The highway A data:
Lower value=57
Q1=60; Q2=65; Q3=66
Highest value=72
The Highway B data:
Lower value=54
Q1=57; Q2=62; Q3=66
Highest value=70
the median of highway A=65
the median of highway B=62
Therefore, the median car speeds on highway A is higher than that of highway B.

Question 8.
Suppose the speed limit on the two highways is 65 miles per hour. What per cent of the cars drove faster than the speed limit on the two highways?
Answer:
the above-given question:
The speed limit on the two highways=65 miles per hour.
The per cent of the cars drove faster than the speed limit on the two highways=X
X% of cars 65 we need to calcularte:
X/100*65
X/100=1/65
X=1/65*100
X=1.53
Therefore, 1.53% of the cars drove faster.

Question 9.
What can you infer about the overall car speeds on the two highways?
Answer:
50% of the cars on highway A go faster than the speed limit but less than 50% of the cars on highway B go faster than the speed limit.

Refer to the scenario below to answer the following.

Henry and Carl go jogging every morning for several weeks. The following are the mean and the MAD of the distances they jog.
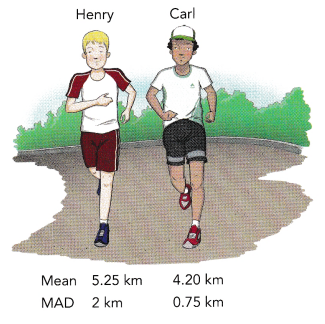
Math in Focus Grade 7 Chapter 9 Lesson 9.5 Answer Key Making Inferences About Populations 7

Question 10.
What would you infer about the distances they jog if you only compare their mean distances?
Answer:
the mean distance of henry=5.25km
The mean distance of Carl=4.20km
Henry jogs more than Carl
5.25-4.20=1.05
Henry jogs 1.05 km more than carl.

Question 11.
What can you conclude if you take into account both the mean and the MAD for your comparison?
Answer:
the mean distance of henry=5.25km
The mean distance of Carl=4.20km
the MAD distance of henry=2 kms
The MAD distance of Carl=0.75kms
By comparing all those distances, we can say Henry’s jogging distance is more varied than Carls jogging distance.

Refer to the random samples below to answer the following. Round your answers to the nearest tenth.

3 random samples of time taken, in seconds, to solve a crossword puzzle during a competition were collected.
S1 = {100, 87, 95, 103, 110, 90, 84, 88}
S2 = {75, 98, 120, 106, 70, 79, 100, 90}
S3 = {60, 68, 110, 88, 78, 90, 104, 73}

Question 12.
Calculate the mean time of each of the 3 samples.
Answer:
Mean is the average of the given numbers and is calculated by dividing the sum of given numbers by the total number of numbers.
Mean=Sum of observations/total number of observations
Mean of S1=100+87+95+103+110+90+84+88/8
Mean of S1=757/8
Mean of S1=94.625
Now calculate for S2
Mean of S2=75+98+120+106+70+79+100+90/8
Mean of S2=738/8
Mean os S2=92.25
Now calculate for S3
Mean of S3=60+68+110+88+78+90+104+73/8
Mean of S3=671/8
Mean of S3=83.875

Question 13.
Estimate the population mean time of the competition using the mean of the 3 sample means.
Answer:
Now we got 3 samples:
S1=94.625; S2=92.25; S3=83.875
Now we have to calculate for these 3 samples
Mean time=94.625+92.25+83.875/3
Mean time=270.75/3
Mean time=90.25
Mean time=90.3 (rounded to nearest number)
Therefore, the estimated population mean time f the competition using the mean of the 3 sample means is 90.3s

Question 14.
Combine S1, S2, and S3 into one sample and use the mean in question 13 to calculate the MAD of the combined sample.
Answer:
The ratio of the sum of all absolute values of deviation from central measure to the total number of observations.
M.A. D = (Σ Absolute Values of Deviation from Central Measure) / (Total Number of Observations)
How to calculate MAD:
Steps to find the mean deviation from mean:
(i)Find the mean of the given observations.
(ii)Calculate the difference between each observation and the calculated mean
(iii)Evaluate the mean of the differences obtained in the second step.
This gives you the mean deviation from the mean.
Mean=90.3
Now we got 3 samples:
S1=94.625; S2=92.25; S3=83.875
|94.625-90.3|=4.325
|92.25-90.3|=1.95
|83.875-90.3|=6.425
Now calculate the mean for obtained differences:
MAD=4.325+1.95+6.425/3
MAD=12.7/3
MAD=4.23

Question 15.
If you use the MAD found in question 14 to gauge the time variation among competitors, what can you infer?
Answer:
On average, time variation is from the mean is about 13.3% of the value of the meantime.

Refer to the random samples below to answer the following. Hound your answers to the nearest hundredth when you can.

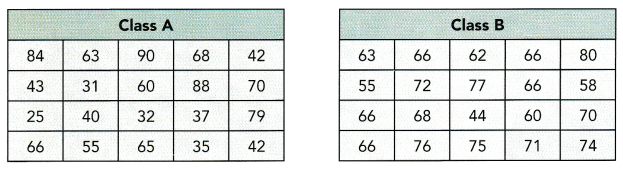
Below are the history test scores of two classes of 20 students each.
Math in Focus Grade 7 Chapter 9 Lesson 9.5 Answer Key Making Inferences About Populations 8
Question 16.
Find the range of scores for each class.
Answer:
The range in statistics for a given data set is the difference between the highest and lowest values.
Range=highest observation-lowest observation
The given data set of class A is 84, 63, 90, 68, 42, 43, 31, 60, 88, 70, 25, 40, 32, 37, 79, 66, 55, 65, 35, 42
The given data set of class B is 63, 66, 62, 66, 80, 55, 72, 77, 66, 58, 66, 68, 44, 60, 70, 66, 76, 75, 71, 74
range of class A:
Maximum value=90
Minimum value=25
range=90-25
range of class A=65
Range of class B:
Maximum value=80
minimum value=44
Range=80-44
range of class B=36

Question 17.
Calculate the mean scores for each class.
Answer:
Mean is the average of the given numbers and is calculated by dividing the sum of given numbers by the total number of numbers.
Mean=Sum of observations/total number of observations
The given data set of class A is 84, 63, 90, 68, 42, 43, 31, 60, 88, 70, 25, 40, 32, 37, 79, 66, 55, 65, 35, 42
The given data set of class B is 63, 66, 62, 66, 80, 55, 72, 77, 66, 58, 66, 68, 44, 60, 70, 66, 76, 75, 71, 74
Mean=84+63+90+68+42+43+31+60+88+70+25+40+32+37+79+66+55+65+35+42/20
Mean of class A=1115/20
Mean of claa A=55.75
Now calculate mean of class B
Mean of class B=63+66+62+66+80+55+72+77+66+58+66+68+44+60+70+66+76+75+71+74/20
Mean of class B=1335/20
Mean of class B=66.75

Question 18.
Calculate the MAD for each class.
Answer:
The ratio of the sum of all absolute values of deviation from central measure to the total number of observations.
M.A. D = (Σ Absolute Values of Deviation from Central Measure) / (Total Number of Observations)
How to calculate MAD:
Steps to find the mean deviation from mean:
(i)Find the mean of the given observations.
(ii)Calculate the difference between each observation and the calculated mean
(iii)Evaluate the mean of the differences obtained in the second step.
This gives you the mean deviation from the mean.
The given data set of class A is 84, 63, 90, 68, 42, 43, 31, 60, 88, 70, 25, 40, 32, 37, 79, 66, 55, 65, 35, 42
Mean of class A=55.75
|84-55.75|=28.25
|63-55.75|=7.25
|90-55.75|=34.25
|68-55.75|=12.25
|42-55.75|=13.75
|43-55.75|=12.75
|31-55.75|=24.75
|60-55.75|=4.25
|88-55.75|=32.25
|70-55.75|=14.25
|25-55.75|=30.75
|40-55.75|=15.75
|32-55.75|=23.75
|37-55.75|=18.75
|79-55.75|=23.25
|66-55.75|=10.25
|55-55.75|=0.75
|65-55.75|=9.25
|35-55.75|=20.75
|42-55.75|=13.75
Now calculate the mean for obtained differences
MAD of class A=351/20
MAD of class A=17.55
Now likewise calculate for class B
Mean of class B=66.75
The given data set of class B is 63, 66, 62, 66, 80, 55, 72, 77, 66, 58, 66, 68, 44, 60, 70, 66, 76, 75, 71, 74
|63-66.75|=3.75
|66-66.75|=0.75
|62-66.75|=4.75
|66-66.75|=0.75
|80-66.75|=13.25
|55-66.75|=11.75
|72-66.75|=5.25
|77-66.75|=10.25
|66-66.75|=0.75
|68-66.75|=1.25
|44-66.75|=22.75
|60-66.75|=6.75
|70-66.75|=3.25
|66-66.75|=0.7
|76-66.75|=9.25
|75-66.75|=8.25
|71-66.75|=4.25
|74-66.75|=7.25
Now calculate the mean for obtained differences
MAD of class B=115/20
MAD of class B=5.75

Question 19.
By comparing the mean scores and the MADs of the two classes, what can you infer about the performance of the two classes?
Answer:
Mean of class A=55.75
Mean of class B=66.75
MAD of class A=17.55
MAD of class B=5.75
the mean score of class B is greater than the mean score of class A. In other words, class B’s performance on average is better than class A’s performance. In addition, the MAD shows that class B’s scores is less varied than class A’s scores.

Brain @ Work

The bar graph displays monthly rainfall, in milliliters, from April to August.
Math in Focus Grade 7 Chapter 9 Lesson 9.5 Answer Key Making Inferences About Populations 9
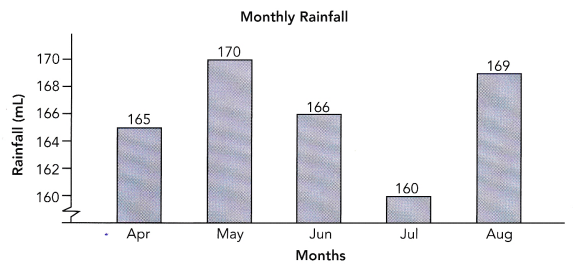
Alex draws the conclusion that rainfall varies greatly from April to August.

a) Find the mean rainfall.
Answer:
The given data: 165, 170, 166, 160, 169
Mean is the average of the given numbers and is calculated by dividing the sum of given numbers by the total number of numbers.
Mean=Sum of observations/total number of observations
Mean=165+170+166+160+169/5
Mean=830/5
Mean=166 ml

b) Calculate the mean absolute deviation.
Answer:
The ratio of the sum of all absolute values of deviation from central measure to the total number of observations.
M.A. D = (Σ Absolute Values of Deviation from Central Measure) / (Total Number of Observations)
How to calculate MAD:
Steps to find the mean deviation from mean:
(i)Find the mean of the given observations.
(ii)Calculate the difference between each observation and the calculated mean
(iii)Evaluate the mean of the differences obtained in the second step.
This gives you the mean deviation from the mean.
Mean=166
The given data: 165, 170, 166, 160, 169
|165-166|=1
|170-166|=4
|166-166|=0
|160-166|=6
|169-166|=3
Now calculate the mean for obtained differences:
MAD=1+4+0+6+3/5
MAD=14/5
MAD=2.8 ml

c) Based on your mean absolute deviation, do you agree with Alex’s conclusion? Explain why you agree or disagree.
Answer:
No, I disagree with Alex’s conclusion.
MAD to mean ratio:
2.8/166*100%
=1.69%
The MAD to mean ratio is 1.69%. It means that the average deviation from the mean is very insignificant. The vertical axis of the bar graph is not drawn to scale. As such, it creates a visual distortion of the differences in heights of the vertical bar.

Math in Focus Grade 7 Chapter 7 Lesson 7.1 Answer Key Constructing Angle Bisectors

Practice the problems of Math in Focus Grade 7 Workbook Answer Key Chapter 7 Lesson 7.1 Constructing Angle Bisectors to score better marks in the exam.

Math in Focus Grade 7 Course 2 B Chapter 7 Lesson 7.1 Answer Key Constructing Angle Bisectors

Math in Focus Grade 7 Chapter 7 Lesson 7.1 Guided Practice Answer Key

Hands-On Activity

Materials

  • ruler

Explore The Distance Between Points On The Sides Of An Ancle And Points On The Angle Bisector

Work in pairs.

\(\overrightarrow{Q S}\) is the angle bisector of ∠YQX. Points X and Y are equidistant from point Q.
Math in Focus Grade 7 Chapter 6 Lesson 7.1 Answer Key Constructing Angle Bisectors 1
Points S1, S2, S3, and S4 lie on \(\overrightarrow{Q S}\), the angle bisector of ∠YQX.

Step 1.
Measure and record each length to the nearest tenth of a centimeter.
Math in Focus Grade 7 Chapter 6 Lesson 7.1 Answer Key Constructing Angle Bisectors 2
Answer:
S1X = 5 cm            S1Y = 5 cm
S2X = 4 cm           S2Y = 4 cm
S3x  = 3 cm           S3Y = 3 cm
S4x = 2 cm           S4Y = 2 cm

Step 2.
Compare the lengths of \(\overline{S_{1} X}\) and \(\overline{S_{1} Y}\). Then compare the lengths of the two segments in each of the following pairs: \(\overline{S_{2} X}\) and \(\overline{S_{2} Y}\), \(\overline{S_{3} X}\) and \(\overline{S_{3} Y}\), and \(\overline{S_{4} X}\) and \(\overline{S_{4} Y}\). What do you observe about each pair of segment lengths?

Math Journal
Suppose you choose any point on the angle bisector. Do you think you will observe the same relationship between the lengths of the segments that connect the point to points X and V? What conclusion can you make?.

From the activity, any two points on the sides of an angle that are the same distance from the vertex are also the same distance from any point on the angle bisector.
Math in Focus Grade 7 Chapter 6 Lesson 7.1 Answer Key Constructing Angle Bisectors 3

Trace or copy ∠PQR. Then draw the angle bisector of ∠PQR.

Question 1.
Math in Focus Grade 7 Chapter 6 Lesson 7.1 Answer Key Constructing Angle Bisectors 4
Answer:
Math-in-Focus-Grade-7-Chapter-6-Lesson-7.1-Answer-Key-Constructing-Angle-Bisectors-4

Complete.

Question 2.
Two walls intersect to form a right angle. In gym class, the students use the two walls to play a game in which the players line up so that each player is equidistant from the two walls.
a) Copy the diagram and draw a line to show where students should line up.
Answer:
We are given the angle:
Math in Focus Grade 7 Chapter 7 Lesson 7.1 Answer Key Constructing Angle Bisectors A 1

The players are equidistant from the two walls if they are placed on the angles bisector. We buiLd the bisector.
First, with the compass point at the vertex, draw an arc that intersects \(\overrightarrow{Q P}\) and \(\overrightarrow{Q R}\).
Label the intersection points as A and B.
Math in Focus Grade 7 Chapter 7 Lesson 7.1 Answer Key Constructing Angle Bisectors A 2
Using the same radius, draw an arc with A as the center.
Math in Focus Grade 7 Chapter 7 Lesson 7.1 Answer Key Constructing Angle Bisectors A 3

Using B as the center, draw another arc with the same radius. Label the point where the two arcs intersect as C.
Math in Focus Grade 7 Chapter 7 Lesson 7.1 Answer Key Constructing Angle Bisectors A 4
Use a straightedge to draw \(\overline{Q C}\).
Math in Focus Grade 7 Chapter 7 Lesson 7.1 Answer Key Constructing Angle Bisectors A 5

b) What is the measure of the angle formed by the students and Wall 1 ? How do you know?
Math in Focus Grade 7 Chapter 6 Lesson 7.1 Answer Key Constructing Angle Bisectors 5
Answer:
Because the measure of the angle PQR is 90° and the bisector divides it in two congruent parts, the measure of the angle formed by the students and each of the walls is:
\(\frac{90^{\circ}}{2}\) = 45°

Trace or copy the diagram. Then complete.

Question 3.
Use ∠X to construct a 15° angle whose vertex is point X.
Math in Focus Grade 7 Chapter 6 Lesson 7.1 Answer Key Constructing Angle Bisectors 6
Answer:
Math-in-Focus-Grade-7-Chapter-6-Lesson-7.1-Answer-Key-Constructing-Angle-Bisectors-6

Math in Focus Course 2B Practice 7.1 Answer Key

Construct the angle bisector of ∠ABC on a copy of each figure.

Question 1.
Math in Focus Grade 7 Chapter 6 Lesson 7.1 Answer Key Constructing Angle Bisectors 7
Answer:
Math-in-Focus-Grade-7-Chapter-6-Lesson-7.1-Answer-Key-Constructing-Angle-Bisectors-7

Question 2.
Math in Focus Grade 7 Chapter 6 Lesson 7.1 Answer Key Constructing Angle Bisectors 8
Answer:
Math-in-Focus-Grade-7-Chapter-6-Lesson-7.1-Answer-Key-Constructing-Angle-Bisectors-8

Draw each angle with a protractor. Then construct its angle bisector.

Question 3.
m∠POR = 75°
Answer:
Math-in-Focus-Grade-7-Chapter-6-Lesson-7.1-Answer-Key-Constructing-Angle-Bisectors-9

Question 4.
m∠ADE = 122°
Answer:
Math-in-Focus-Grade-7-Chapter-6-Lesson-7.1-Answer-Key-Constructing-Angle-Bisectors- 10

Copy the angle shown. Then perform the indicated construction.

Question 5.
Construct a 25° angle at point X.
Math in Focus Grade 7 Chapter 6 Lesson 7.1 Answer Key Constructing Angle Bisectors 9
Answer:
Math-in-Focus-Grade-7-Chapter-6-Lesson-7.1-Answer-Key-Constructing-Angle-Bisectors-9

Question 6.
Construct a 108° angle at point Y.
Math in Focus Grade 7 Chapter 6 Lesson 7.1 Answer Key Constructing Angle Bisectors 10
Answer:
Math-in-Focus-Grade-7-Chapter-6-Lesson-7.1-Answer-Key-Constructing-Angle-Bisectors-11

Solve.

Question 7.
Justin wants to construct the angle bisector of ∠XYZ. Trace or copy the diagram. Using only a compass and a straightedge, construct the angle bisector and describe each step clearly.
Math in Focus Grade 7 Chapter 6 Lesson 7.1 Answer Key Constructing Angle Bisectors 11
Answer:
Math-in-Focus-Grade-7-Chapter-6-Lesson-7.1-Answer-Key-Constructing-Angle-Bisectors-11
Explanation:
1. With ‘Y’ as center draw an arc of any radius to cut the rays of the angle at X and Z.
2. With ‘Z’ as center draw an arc of radius more than half of XZ, in the interior of the given angle.
3. With ‘X’ as center draw an arc of same radius to cut the previous arc at ‘o’.
4. Join YO. YO is the angle bisector of the given angle.

Question 8.
Draw two straight lines intersecting at an angle of 108°. Find the points that are equidistant from the two sides of each 108° angle formed by the intersecting lines.
Answer:
We are given:
Math in Focus Grade 7 Chapter 7 Lesson 7.1 Answer Key Constructing Angle Bisectors A 6

The points equidistant from the two sides of each 108° angle formed by the intersection of the two Unes are placed on the 108° angles bisector.
We construct the bisector of the angle NOQ.

With the compass point at the vertex O, draw an arc that intersects \(\overrightarrow{O N}\) and \(\overrightarrow{O Q}\).
Label the intersection points as A and B.
Math in Focus Grade 7 Chapter 7 Lesson 7.1 Answer Key Constructing Angle Bisectors A 7
Using the same radius, draw an arc with B as the center.
Math in Focus Grade 7 Chapter 7 Lesson 7.1 Answer Key Constructing Angle Bisectors A 8

Using A as the center, draw another arc with the same radius Label the point where the two arcs intersect as C.
Math in Focus Grade 7 Chapter 7 Lesson 7.1 Answer Key Constructing Angle Bisectors A 9
Use a straightedge to draw \(\overline{O C}\), which is the bisector of both vertical angles NOQ and POM.
Math in Focus Grade 7 Chapter 7 Lesson 7.1 Answer Key Constructing Angle Bisectors A 10

Question 9.
Draw an obtuse angle of any measure and label it as ∠XYZ. Construct an angle that is one-fourth the measure of ∠XYZ, describing briefly the steps involved.
Answer:
We are given the obtuse angle:
Math in Focus Grade 7 Chapter 7 Lesson 7.1 Answer Key Constructing Angle Bisectors A 11

In order to divide the angle in 4 congruent parts, first we construct the bisector \(\overrightarrow{Y V}\) of
the angle XYZ:
Math in Focus Grade 7 Chapter 7 Lesson 7.1 Answer Key Constructing Angle Bisectors A 12
We have:
m∠XYV = m∠VYZ = \(\frac{m \angle X Y Z}{2}\)
Then we construct the bisector \(\overrightarrow{Y W}\) of the angle XYV:
Math in Focus Grade 7 Chapter 7 Lesson 7.1 Answer Key Constructing Angle Bisectors A 13
We have:
m∠XYW = m∠WYV = \(\frac{m \angle X Y V}{2}\)
= \(\frac{\frac{X Y X}{2}}{2}\) = \(\frac{m \angle X Y Z}{4}\)
Divide the angle twice, constructing angle bisectors.

Question 10.
The diagram shows ∠ABC with \(\overrightarrow{B D}\) being its angle bisector and BF = BG E is a point on \(\overrightarrow{B D}\) and m∠ABD = 26°. Copy and complete.
m∠DBC = Math in Focus Grade 7 Chapter 6 Lesson 7.1 Answer Key Constructing Angle Bisectors 12
Length of \(\overline{E G}\) = Length of Math in Focus Grade 7 Chapter 6 Lesson 7.1 Answer Key Constructing Angle Bisectors 12
Math in Focus Grade 7 Chapter 6 Lesson 7.1 Answer Key Constructing Angle Bisectors 13
Answer:
\(\overline{B D}\) is angle bisector:
m∠DBC = m∠ABD
Substitute:
m∠DBC = 26°
△BEF ≅ △BEG (side-angle-side)
BF = BG
m∠DBC = m∠ABD
BE = BE
Congruent triangles:
Length of \(\overline{E G}\)  = Length of \(\overline{E F}\)

Question 11.
Officials are planning to build a new airport to serve three major cities in one region. The cities are located at W, X, and V, which are represented by the vertices of the triangle shown. The officials want to place the airport at the intersection of the angle bisectors of ∠XWY and ∠XYW. Copy or trace the triangle. Find the possible location of the airport and label it point Q.
Math in Focus Grade 7 Chapter 6 Lesson 7.1 Answer Key Constructing Angle Bisectors 14
Answer:
We construct the bisector of ∠XWY:
Math in Focus Grade 7 Chapter 7 Lesson 7.1 Answer Key Constructing Angle Bisectors A 14
We construct the bisector of ∠XYW:
Math in Focus Grade 7 Chapter 7 Lesson 7.1 Answer Key Constructing Angle Bisectors A 15

The intersection Q of the two bisectors is the possible location for the airport.

Question 12.
Joshua used a square piece of paper to make a paper airplane. As a first step, he made several folds in the paper, as shown in the diagram. First he folded along diagonal \(\overline{\mathrm{QS}}\), then he unfolded the paper. Next he folded along \(\overline{\mathrm{QT}}\) so that \(\overline{\mathrm{PQ}}\) lined up with \(\overline{\mathrm{QS}}\). Then he unfolded the paper again. In the diagram, what is the measure of ∠PQT? Give a brief explanation for your answer.
Math in Focus Grade 7 Chapter 6 Lesson 7.1 Answer Key Constructing Angle Bisectors 15
Answer:
In order to Line up \(\overline{P Q}\) with \(\overline{Q S}\) folding along \(\overline{Q T}\), the points of \(\overline{Q T}\) should be equidistant to \(\overline{P Q}\) and \(\overline{Q S}\), therefore on the bisector of ∠PQS.
we aetermine m∠PQT:
m∠PQT = \(\frac{m \angle P Q S}{2}\)
= \(\frac{\frac{90^{\circ}}{2}}{2}\) = \(\frac{45^{\circ}}{2}\)
= 22.5°

Question 13.
Kimberly wants to bisect the straight angle shown, and then bisect one of the resulting angles. She then wants to continue this process until she obtains an angle of measure 11.25°. How many times does she need to construct an angle bisector to produce an angle with this measure? Explain.
Math in Focus Grade 7 Chapter 6 Lesson 7.1 Answer Key Constructing Angle Bisectors 17
Answer:
Given the Angle measure of 11.25°.
Here we need to find out the angle which after bisecting gives an angle of 11.25°.
We know that when an angle is bisected it is divided into two equal angles.
Therefore, the double of the angle obtained after bisecting we will get the angle that was bisected
Hence, the angle is
= 2 × 11.25°
= 22.5°

Question 14.
Max designed a support for a bridge. In his design, five spokes are attached to a metal beam. The angles formed by the spokes all have the same measure. Explain how Max can use geometric construction to accurately draw his design.
Math in Focus Grade 7 Chapter 6 Lesson 7.1 Answer Key Constructing Angle Bisectors 18
Answer:
Take an arbitrary point outside the line:
Math in Focus Grade 7 Chapter 7 Lesson 7.1 Answer Key Constructing Angle Bisectors A 16
Draw an arc with the point in A. Label the intersections with the Line by B and C:
Math in Focus Grade 7 Chapter 7 Lesson 7.1 Answer Key Constructing Angle Bisectors A 17
Join A to B and C:
Math in Focus Grade 7 Chapter 7 Lesson 7.1 Answer Key Constructing Angle Bisectors A 18
Construct the bisector of ∠BAC:
Math in Focus Grade 7 Chapter 7 Lesson 7.1 Answer Key Constructing Angle Bisectors A 19
Construct the bisectors of ∠BAD and ∠DAC:
Math in Focus Grade 7 Chapter 7 Lesson 7.1 Answer Key Constructing Angle Bisectors A 20

Math in Focus Grade 7 Chapter 7 Answer Key Geometric Construction

Practice the problems of Math in Focus Grade 7 Workbook Answer Key Chapter 7 Geometric Construction to score better marks in the exam.

Math in Focus Grade 7 Course 2 B Chapter 7 Answer Key Geometric Construction

Math in Focus Grade 7 Chapter 7 Quick Check Answer Key

Copy and complete the table by classifying the triangles.

Question 1.
Math-in-Focus-Grade-7-Chapter-7-Answer-Key-Geometric-Construction-1

Answer:
Figure A is an Equilateral Triangle.
Figure B is an Isosceles Triangle.
Figure E is a Right Triangle.
Figure F is an Acute angle Triangle.
Figure C is an Obtuse angle Triangle

Explanation:

1. Equilateral triangle: In an equilateral triangle each angle is 60°. All sides and lengths of an equilateral triangle are equal. From the given figure we can classify that figure A is an Equilateral triangle.Math-in-Focus-Grade-7-Chapter-7-Answer-Key-Geometric-Construction-1
2. Isosceles triangle: In the isosceles triangle only two sides are equal, the number of vertices and the number of edges are 3. By observing the given diagram figure B is called an Isosceles triangle
3. Right Triangle: A right-angled triangle is a triangle in which one of the angles is 90 degrees. Figure E is called a right-angled triangle.
4. Acute triangle: An acute angle is an angle that is less than 90. Since all the three angles are less than 90° then it is called an acute angle. Figure F is an acute angle from the above diagram.
5. Obtuse triangle: Obtuse angle is an angle that has greater than 90°. The figure C is called an obtuse triangle.

Copy and complete the table.

Question 2.
Math-in-Focus-Grade-7-Chapter-7-Answer-Key-Geometric-Construction-2
Answer:
1. Square: All sides are equal.
2. Rectangle: Rectangle is a quadrilateral with four right angles. The area of a rectangle is length width.
3.Trapezium: Trapezium has four vertices and four sides.
4. Parallelogram: In a parallelogram, both sides are parallel and equal.
5. Square parallelogram: The diagonals have equal length.

Explanation:
Math-in-Focus-Grade-7-Chapter-7-Answer-Key-Geometric-Construction-2

Measure ∠ABC.

Question 3.
Math in Focus Grade 7 Chapter 7 Answer Key Geometric Construction 3
Answer:
∠ABC has 60° which is an acute angle triangle.

Explanation:
An acute angle is an angle that has less than 90°. The figure given here has less than 90° and the measure of that angle is 60°.

Question 4.
Math in Focus Grade 7 Chapter 7 Answer Key Geometric Construction 4
Answer:
The measurement of  ∠ABC is 80°. And it is an acute angle triangle.

Explanation:
An acute angle is an angle that has less than 90°. The figure given here has less than 90° and the measure of that angle is 80°.

Question 5.
Math in Focus Grade 7 Chapter 7 Answer Key Geometric Construction 5
Answer:
The measurement of ∠ABC is 110°.

Explanation:
An obtuse angle is an angle that has greater than 90°. From the given figure we can measure the angle ∠ABC has 110°

Question 6.
Math in Focus Grade 7 Chapter 7 Answer Key Geometric Construction 6
Answer:
The measurement of ∠ABC is 120°which is an obtuse angle triangle.

Explanation:
An obtuse angle is an angle that has greater than 90°. From the given figure we can measure the angle ∠ABC has 120°

Use a protractor to draw each angle.

Question 7.
m∠DEF = 39°
Answer:
Angle DEF is an acute angle and the angle between 90° to 180°.

Explanation:
Math-in-Focus-Grade-7-Chapter-7-Answer-Key-Geometric-Construction-3

Question 8.
m∠XYZ = 92°
Answer:
Angle XYZ has a right angle and it is 92°.

Explanation:
Math-in-Focus-Grade-7-Chapter-7-Answer-Key-Geometric-Construction-4

Question 9.
m∠PQR = 146°
Answer:
Angle PQR is 146°.

Explanation:
Math-in-Focus-Grade-7-Chapter-7-Answer-Key-Geometric-Construction-5

Copy \(\overleftrightarrow{\mathbf{A B}}\), \(\overleftrightarrow{\mathbf{C D}}\), and \(\overleftrightarrow{\mathbf{X Y}}\) on a sheet of paper. Draw a perpendicular line to each given line.

Question 10.
Math-in-Focus-Grade-7-Chapter-7-Answer-Key-Geometric-Construction-7
Answer:
We take the straight line AB  They insect at each at a right angle.

Explanation:


Math-in-Focus-Grade-7-Chapter-7-Answer-Key-Geometric-Construction-6
Question 11.
Math-in-Focus-Grade-7-Chapter-7-Answer-Key-Geometric-Construction-8
Answer:
We take a straight line CD, then draw a perpendicular line XY between the line CD. They insect each at a right angle.

Explanation:
Math-in-Focus-Grade-7-Chapter-7-Answer-Key-Geometric-Construction-7

Question 12.
Math-in-Focus-Grade-7-Chapter-7-Answer-Key-Geometric-Construction-9
Answer:
We take the straight line XY, then draw a perpendicular line AB between the line XY. The angle insects are at a right angle.

Explanation:
Math-in-Focus-Grade-7-Chapter-7-Answer-Key-Geometric-Construction-8

Math in Focus Grade 7 Chapter 6 Review Test Answer Key

Practice the problems of Math in Focus Grade 7 Workbook Answer Key Chapter 6 Review Test to score better marks in the exam.

Math in Focus Grade 7 Course 2 B Chapter 6 Review Test Answer Key

Concepts and Skills

Tell whether each pair of angles are supplementary, complementary or neither.

Question 1.
m∠1 = 23° and m∠2 = 157°
Answer:

Explanation:
Math-in-Focus-Grade-7-Chapter-6-Review-Test-Answer-Key-01

Question 2.
m∠3 = 65° and m∠4 = 25°
Answer:

Explanation:
Math-in-Focus-Grade-7-Chapter-6-Review-Test-Answer-Key-02

Question 3.
m∠5 = 43° and m∠6 = 57°
Answer:

Explanation:
Math-in-Focus-Grade-7-Chapter-6-Review-Test-Answer-Key-03

Question 4.
m∠7 = 82° and m∠8 = 8°
Answer:

Explanation:
Math-in-Focus-Grade-7-Chapter-6-Review-Test-Answer-Key-04

Question 5.
m∠9 = 110° and m∠10 = 80°
Answer:

Explanation:
Math-in-Focus-Grade-7-Chapter-6-Review-Test-Answer-Key-05

Question 6.
m∠11 = 18° and m∠12 = 62°
Answer:

Explanation:
Math-in-Focus-Grade-7-Chapter-6-Review-Test-Answer-Key-06

Tell whether the following list of angle measures are complementary or supplementary.

m∠A = 67°, m∠B = 80°, m∠C = 131°, m∠D = 21°,
m∠E = 51°, m∠F = 46°, m∠G = 10°, m∠H = 120°,
m∠J = 69°, m∠K = 60°, m∠P = 49°, m∠Q = 113°,
m∠R = 44°, m∠S = 41°

Question 7.
Name two pairs of complementary angles.
Answer:
m∠B = 80°, m∠G = 10°
m∠F = 46°, m∠R = 44°

Explanation:
Two angles are called complementary when the measures of their angles add to 90 degrees. The two pairs of complementary angles are m∠B = 80°, m∠G = 10°. If we add both angles the sum adds up to 90°.

Question 8.
Name two pairs of supplementary angles.
Answer:
m∠A = 67°, m∠Q = 113°
m∠H = 120°, m∠K = 60°

Explanation:
Two angles are called supplementary when the measures of their angles add to 180 degrees. The two pairs of supplementary angles are m∠A = 67°, m∠Q = 113°. If we add both angles the sum adds up to 180°.

Copy and complete.

Question 9.
Name two pairs of angles for each type of angle pair.
Math in Focus Grade 7 Chapter 6 Review Test Answer Key 1
Answer:
∠TBC = 60°, ∠ABR = 30° are complementary angles.
∠RBT = 120°, ∠TBC = 60°are supplementary angles.

Explanation:
Math-in-Focus-Grade-7-Chapter-6-Review-Test-Answer-Key-1
The two pairs of angles for complementary angles are ∠TBC = 60°, ∠ABR = 30°.
The two pairs of angles for supplementary angles are ∠RBT = 120°, ∠TBC = 60°

Find the measure of each numbered angle.

Question 10.
\(\overleftrightarrow{\mathrm{AB}}\) is a straight line.
Math in Focus Grade 7 Chapter 6 Review Test Answer Key 2
Answer:
The measurement of numbered angle 1 is 43°.

Explanation:
Math-in-Focus-Grade-7-Chapter-6-Review-Test-Answer-Key-2
∠AOC + ∠BOC = 180°
1 + 137° = 180°
1 = 180° – 137°
1 = 43°

Question 11.
\(\overleftrightarrow{\mathrm{AB}}\) is a straight line.
Math in Focus Grade 7 Chapter 6 Review Test Answer Key 3
Answer:
The measurement of numbered angle 2 is 120°.

Explanation:
Math-in-Focus-Grade-7-Chapter-6-Review-Test-Answer-Key-3
∠AOD + ∠DOC + ∠COB = 180°
38° + 2 + 22° = 180°
2 + 60° = 180°
2 = 180° – 60°
2 = 120°

Find the measure of each numbered angle.

Question 12.
Math in Focus Grade 7 Chapter 6 Review Test Answer Key 4
Answer:
The measurement of numbered angle 3 is 195°

Explanation:
Math-in-Focus-Grade-7-Chapter-6-Review-Test-Answer-Key-4
∠AOB + ∠COB + ∠AOC = 360°
3 + 120°+ 45° = 360°
3 + 165° = 360°
3 = 360° – 165°
3 = 195°

Question 13.
\(\overleftrightarrow{\mathrm{AB}}\) is a straight line.
Math in Focus Grade 7 Chapter 6 Review Test Answer Key 5
Answer:
The measurement of  numbered angle 4 is 73°

Explanation:
Math-in-Focus-Grade-7-Chapter-6-Review-Test-Answer-Key-5
∠AOD + ∠DOC + ∠COB = 180°
4 + 17° + 90° = 180°
4 + 107° = 180°
4 = 180° – 107°
4 = 73°

Use an equation to find the value of each variable.

Question 14.
\(\overleftrightarrow{\mathrm{AB}}\) is a straight line.
Math in Focus Grade 7 Chapter 6 Review Test Answer Key 6
Answer:
s°= 45°, 3s°= 135°

Explanation:
Math-in-Focus-Grade-7-Chapter-6-Review-Test-Answer-Key-6
∠AOC + ∠COB = 180°
3s° + s° = 180°
4s° = 180°
s° = 180 ÷ 4
s° = 45°
3s°= 135°

Question 15.
\(\overleftrightarrow{\mathrm{AB}}\) is a straight line.
Math in Focus Grade 7 Chapter 6 Review Test Answer Key 7
Answer:
w° = 28°, 2w° =56°, 3w°=140°

Explanation:
Math-in-Focus-Grade-7-Chapter-6-Review-Test-Answer-Key-7
∠AOD + ∠DOC + ∠COB = 180°
3w° + 40° + 2w° = 180°
5w° + 40° = 180°
5w° = 180° – 40°
5w° = 140°
w° = 28°
3w°= 3 × 28 = 84°
2w°= 2° × 28 = 56°

Question 16.
\(\overleftrightarrow{\mathrm{AB}}\) is a straight line.
Math in Focus Grade 7 Chapter 6 Review Test Answer Key 8
Answer:
t° = 30°, 2t° = 30°

Explanation:
Math-in-Focus-Grade-7-Chapter-6-Review-Test-Answer-Key-8
∠BOC + ∠AOD + ∠DOC = 180°
t° + 2t° + 90° = 180°
3t° + 90° = 180°
3t° = 180° – 90°
3t° = 90°
t° = 90° ÷ 3
t° = 30°

Question 17.
Math in Focus Grade 7 Chapter 6 Review Test Answer Key 9
Answer:
v°=17°, u°=73°

Explanation:
∠AOB + ∠BOC = 90°
53° + v° = 90°
v° = 90° – 53°
v° = 17°
∠BOC + ∠COD = 90°
v° + u° = 90°
17° + u° = 90°
u° = 90° – 17°
u° = 73°

Question 18.
\(\overleftrightarrow{\mathrm{AB}}\), \(\overleftrightarrow{\mathrm{CD}}\), and \(\overleftrightarrow{\mathrm{EF}}\) are a straight line.
Math in Focus Grade 7 Chapter 6 Review Test Answer Key 10
Answer:
r°= 22°, 4r°= 88°

Explanation:
∠COA = ∠BOD = r° (vertically opposite angles)
∠EOB + ∠BOD + ∠FOD = 180°
4r° + r° + 70° = 180°
5r° + 70° = 180°
5r° = 180° – 70°
5r° = 110°
r° = 110 ÷ 5
r° = 22°
4r° = 4 × 22 = 88°

Question 19.
Math in Focus Grade 7 Chapter 6 Review Test Answer Key 11
Answer:
x° = 36°, 2x° = 72°, 3x° = 108°, 4x° = 144°

Explanation:
Math-in-Focus-Grade-7-Chapter-6-Review-Test-Answer-Key-11
3x° + 2x° = 180°
5x° = 180°
x° = 180÷5
x° = 36°
2x° = 36 × 2 = 72°
3x° = 3 × 36 = 108°
4x° = 4 × 36 = 144°

\(\overline{M N}\) is parallel to \(\overline{P Q}\). Find the measure of each numbered angle.

Question 20.
Math in Focus Grade 7 Chapter 6 Review Test Answer Key 12
Answer:
∠1 = 25°, ∠2 = 65°, x° = 65°

Explanation:
Let ∠QPS = x°
∠NPM + ∠NPQ + ∠QPS = 180°
90° + 25° + x° = 180°
115° + x° = 180°
x° = 180 -115°
x° = 65°
∠2 = ∠x = 65° Corresponding angles are equal
∠NMP + ∠PNM = 90°
∠2 + ∠1 = 90°
65° + ∠1 = 90°
∠1 = 90° – 65°
∠1 = 25°

Question 21.
Math in Focus Grade 7 Chapter 6 Review Test Answer Key 13
Answer:
∠1 = 52°, ∠2 = 52°, ∠3 = 66°

Explanation:
Let ∠SOQ = x°
114°+ x° = 180°
x° = 180° – 114°
x° = 66°
x° = ∠3 = 66° (vertically opposite angles)
∠3 + ∠TSQ + ∠QSN = 180°
∠3 + 62° + ∠2 = 180°
66° + 62° + ∠2 = 180°
∠2 = 180° – 128°
∠2 = 52°
∠1 = ∠2 (vertically opposite angles)
∠1 = 52°

Problem Solving

Solve. Show your work.

Find the value of x.

Question 22.
Find the value of x.
Math in Focus Grade 7 Chapter 6 Review Test Answer Key 14
Answer:
x° + 2x° = 330°
3x°= 330°
x° = 330 ÷ 3
x° = 110°

Question 23.
ABCD is a rhombus. Find the measures of ∠1 and ∠2.
Math in Focus Grade 7 Chapter 6 Review Test Answer Key 15
Answer:
∠1 = 70°, ∠2 = 120°

Explanation:
Opposite angles in a rhombus are equal.
∠1 = 70°
∠1 + ∠2 + 70° = 360°
70° + ∠2 + 70° = 360°
∠2 + 140° = 360°
∠2 = 360° – 140°
∠2 = 120°

Question 24.
ABCD is a rectangle. \(\overline{\mathrm{AE}}\) and \(\overline{\mathrm{DC}}\) are straight lines. ∠FBG is a right angle, m

ABF = 74°, and m∠BEG = 42°. Find the measures of ∠EBG and ∠BGC.
Math in Focus Grade 7 Chapter 6 Review Test Answer Key 16
Answer:
x=∠EBG =16°, ∠BGC = 122°
Explanation:
74° + 90° + x° = 180°
x° = 180° – 164°
x° = 16°
16° + 42° + ∠BGC = 180°
∠BGC = 180° – 58°
∠BGC = 122°

Question 25.
The diagram shows the flag of the United Kingdom. m∠MNR = 90°. Name two pairs of complementary and supplementary angles.
Math in Focus Grade 7 Chapter 6 Review Test Answer Key 17
Answer:
∠MNQ, ∠SNP, ∠QNS are complementary angles.
∠MNR, ∠MNQ, ∠SNP are supplementary angles.

Explanation:
The two pairs of angles for complementary angles are ∠MNQ, ∠SNP, ∠QNS.
The two pairs of angles for supplementary angles are ∠MNR, ∠MNQ, ∠SNP.

Question 26.
m∠1 = 15° and m∠2 = 131°. \(\overleftrightarrow{\mathrm{AB}}\) is a straight line. Find the measure of ∠3.
Math in Focus Grade 7 Chapter 6 Review Test Answer Key 18
Answer:
∠3 = 34°

Explanation:
m∠1 + m∠2 + m∠3 = 180°
15° + 131° + m∠3 = 180°
m∠3 + 146° = 180°
m∠3 = 180° – 146°
m∠3 = 34°

Question 27.
The diagram shows ∠1 and ∠2, which are formed by \(\overleftrightarrow{M N}\) intersecting \(\overleftrightarrow{P Q}\) and \(\overleftrightarrow{R S}\). In the diagram, m∠1 = (12x + 7)°, m∠2 = (10x + 15)°, and x = 4. Explain how you know that \(\overleftrightarrow{P Q}\) is parallel to \(\overleftrightarrow{R S}\).
Math in Focus Grade 7 Chapter 6 Review Test Answer Key 19
Answer:
Parllel lines are lines that are always the same distance apart and will never intersect. Hence in the given figure the lines \(\overleftrightarrow{P Q}\) is parallel to \(\overleftrightarrow{R S}\).
And iif two lines are parllel the corresponding angles are equal. Therefore ∠1 = ∠2

Explanation:
m∠1 = m∠2  are corresponding angles
(12x + 7)° = (10x + 15)°
12x – 10x = 15 – 7
2x = 8
x° = 8 ÷ 2
x° = 4°
(12x + 7)° = 12 × 4 + 7 = 48 + 7 = 55°
(10x +15)° = 10 × 4 + 15 = 40 + 15 = 55°

Question 28.
In the diagram, m∠1 = (5x – 20)°, m∠2 = (2x + 14)°, and m∠3 = 18°. Use an equation to find the measures of ∠1 and ∠2.
Math in Focus Grade 7 Chapter 6 Review Test Answer Key 20
Answer:
∠1 = 100°, ∠2 = 62°, ∠3 = 24°

Explanation:
m∠1 + m∠2 + m∠3 = 180°
(5x – 20)° + (2x + 14)° + 18° =180°
7x – 6 + 18° = 180°
7x +12 = 180°
7x = 180° – 12°
7x = 168°
x°= 24°
5x – 20 = 5 × 24 – 20 = 120 – 20 =100°
2x + 14 = 2 × 24 + 14 = 62°
∠1 = 100°, ∠2 = 62°, ∠3 = 24°

Math in Focus Grade 8 Chapter 7 Lesson 7.4 Answer Key Identifying Volumes of Composite Solids

Practice the problems of Math in Focus Grade 8 Workbook Answer Key Chapter 7 Lesson 7.4 Identifying Volumes of Composite Solids to score better marks in the exam.

Math in Focus Grade 7 Course 3 B Chapter 7 Lesson 7.4 Answer Key Identifying Volumes of Composite Solids

Math in Focus Grade 8 Chapter 7 Lesson 7.4 Guided Practice Answer Key

Solve.

Question 1.
A solid metal trophy is made up of a cylinder and a cone. The radius of the cylinder is equal to the radius of the cone. Find the volume of metal used to make the trophy. Round your answer to the nearest tenth. Use 3.14 as an approximation for π.
Math in Focus Grade 8 Chapter 7 Lesson 7.4 Answer Key Identifying Volumes of Composite Solids 1
First find the height of the cone.
Let h represent the height of the cone in centimeters.
Math in Focus Grade 8 Chapter 7 Lesson 7.4 Answer Key Identifying Volumes of Composite Solids 2
Then find the volume of the cone.
Volume = \(\frac{1}{3}\) • Area of base • Height
= Math in Focus Grade 8 Chapter 7 Lesson 7.4 Answer Key Identifying Volumes of Composite Solids 3 Use the exact value of the height of the cone.
Math in Focus Grade 8 Chapter 7 Lesson 7.4 Answer Key Identifying Volumes of Composite Solids 3 cm3
Next find the volume of the cylinder.
Volume = Area of base• Height
= Math in Focus Grade 8 Chapter 7 Lesson 7.4 Answer Key Identifying Volumes of Composite Solids 3
Math in Focus Grade 8 Chapter 7 Lesson 7.4 Answer Key Identifying Volumes of Composite Solids 3 cm3
Finally, find the volume of metal used.
Volume of metal used = Volume of cone + Volume of cylinder
Math in Focus Grade 8 Chapter 7 Lesson 7.4 Answer Key Identifying Volumes of Composite Solids 3 + Math in Focus Grade 8 Chapter 7 Lesson 7.4 Answer Key Identifying Volumes of Composite Solids 3
= Math in Focus Grade 8 Chapter 7 Lesson 7.4 Answer Key Identifying Volumes of Composite Solids 3 cm3
So, the volume of metal used is approximately Math in Focus Grade 8 Chapter 7 Lesson 7.4 Answer Key Identifying Volumes of Composite Solids 3 cubic centimeters.

Answer:
The volume of metal used is approximately 957 cubic centimeters,

Explanation:
Math in Focus Grade 8 Chapter 7 Lesson 7.4 Answer Key Identifying Volumes of Composite Solids-1
Now the volume of cone
Volume = \(\frac{1}{3}\) • Area of base • Height,
Area of base is πr2 = 3.14 × 6 cm × 6 cm = 113.04 cm2,
V = Volume of cone = \(\frac{1}{3}\) • 113.04 • 10.39 = 391.495 cm2,
Given the radius of the cylinder is equal to the radius of the cone.
The volume of the cylinder =
Volume of cylinder = Area of base X height = 113.04 cm2 × 5 cm = 565.2 cm3,
Volume of metal used = Volume of cone + Volume of cylinder,
Volume of metal used = 391.495 cm3 + 565.2 cm3 = 956.695 cm3,
therefore the volume of metal used is approximately 957 cubic centimeters.

Math in Focus Course 3B Practice 7.4 Answer Key

For this practice, you may use a calculator. Use 3.14 as an approximation for n. Round your answer to the nearest tenth if necessary.

Question 1.
Find the volume of each of the following composite solids.

a) A triangular prism with a cylindrical hole cut out of it.

Math in Focus Grade 8 Chapter 7 Lesson 7.4 Answer Key Identifying Volumes of Composite Solids 4
Answer:
Volume of triangular prism with a cylindrical hole cut out of it is 1089.12 cm3,

Explanation:
Volume of rectangular prism is width X height X length,
we have width 14.1 cm, height = 12 cm and length = 10 cm,
Volume of rectangular prism = 14.1 × 12 × 10 = 1,692 cm3,
Volume of cylinder =πr2h= 3.14 × 4 × 4 × 12 = 602.88 cm3,
therefore volume of triangular prism with a cylindrical hole cut out of it is
Volume of rectangular prism – Volume of  cylinder =
1,692 cm3 – 602.88 cm3 = 1089.12 cm3.

b) A sphere connected to a cone that sits on top of a hemisphere.
Math in Focus Grade 8 Chapter 7 Lesson 7.4 Answer Key Identifying Volumes of Composite Solids 5
Answer:
Volume of sphere connected to a cone that sits on top of a hemisphere is 41.866 cm3,

Explanation:
First we calculate the volume of cone,
we calculate height of cone h2 + 32 = 52,
h2 = 25 – 9 = 16, so height of cone is square root of 16 which is 4,
Now volume of cone =  \(\frac{1}{3}\) • 3.14 × 3 × 3 • 4,
Volume of cone = 37.68 cm3,
Volume of sphere = \(\frac{4}{3}\) • 3.14 × r3,
= \(\frac{4}{3}\) • 3.14 × 1 cm × 1 cm × 1 cm = 4.186 cm3,
therefore volume of sphere connected to a cone that sits on top of a hemisphere
= Volume of cone + Volume of sphere
= 37.68 cm3 + 4.186 cm3 = 41.866 cm3.

Question 2.
A ceramic candle holder in the shape of a cylinder has a radius of 2.40 inches. A hemisphere of radius 1.75 inches is removed from the center of the cylinder. Find the volume of ceramic in the candle holder.
Math in Focus Grade 8 Chapter 7 Lesson 7.4 Answer Key Identifying Volumes of Composite Solids 6
Answer:
The volume of ceramic in the candle holder is 27.104 in3,

Explanation:
Given a ceramic candle holder in the shape of a cylinder has a radius of 2.40 inches.
Now we caluculate height of cylinder using pythagorean theroem
2.402 + h2 = 42,
h2 = 16 – 5.76 = 10.24, the height is square root of 10.24 is 3.2 in
h = 3.2 in now volume of cylinder is 3.14 × r2 × h = 3.14 × 2.4 × 2.4 × 3.2 = Volume of cylinder is 57.876 in3,
As a hemisphere of radius 1.75 inches is removed from the center of the cylinder, the volume removed is 3.14 × 1.75 × 1.75 × 3.2 = 30.772 in3,
therefore the volume of ceramic in the candle holder is
volume of cylinder – volume of removed
= 57.876 in3 – 30.772 in3 = 27.104 in3.

Question 3.
A tent has a conical roof and a cylindrical wall as shown. The cylindrical wall and the conical roof are of the same height. The radius of the tent is 9 meters. Ropes are used to tie the tent to the ground.
a) Find the height of the wall.
Answer:
The height of the wall is 1.5 m,

Explanation:
Using pythogorean theorem the height h of the wall =
h2 + 0.82 = 1.72,
h2 = 2.89 – 0.64 = 2.25
so height is square root of 2.25 is 1.5 m.

b) Find the volume of space inside the tent.
Answer:

Math in Focus Grade 8 Chapter 7 Lesson 7.4 Answer Key Identifying Volumes of Composite Solids 7
The volume of space inside the tent is  508.68 m3,

Explanation:
First we calculate the volume cylindrical walls as
3.14 × r2 × h = 3.14 × 9 × 9 × 1.5 = 381.51 m3,
Now volume conical roof is \(\frac{1}{3}\) • 3.14 × r × r • h,
\(\frac{1}{3}\) • 3.14 × 9 × 9 • 1.5 = 127.17 m3,
therefore the volume of space inside the tent is
381.51 m3 + 127.17 m3 = 508.68 m3.

Question 4.
A traffic cone is made up of a cone fixed on top of a square prism base with a height of 1 inch. Find the volume of the traffic cone.
Math in Focus Grade 8 Chapter 7 Lesson 7.4 Answer Key Identifying Volumes of Composite Solids 8
Answer:
The volume of the traffic cone is 1561.75 in3,

Explanation:
Given a traffic cone is made up of a cone fixed on top of a square prism base with a height of 1 inch with radius 7.3 in and height 28 in,
So volume of the traffic cone is \(\frac{1}{3}\) • 3.14 × r × r • h =
\(\frac{1}{3}\) • 3.14 × 7.3 × 7.3 × 28 = 1561.75 in3.

Question 5.
A sculpture is made out of a cone resting on top of a hemisphere. The hemisphere has a radius of 1 meter. Use the information in the diagram below to find the volume of the sculpture.
Math in Focus Grade 8 Chapter 7 Lesson 7.4 Answer Key Identifying Volumes of Composite Solids 9
Answer:
Volume of sculpture is 37.68 m3,

Explanation:
Given a sculpture is made out of a cone resting on top of a hemisphere.
The hemisphere has a radius of 1 meter. Radius of cone is 2 m+ 1 m = 3 m,
applying phthagorean theorem to find height of cone
h2 + 32 = 52,
h2 = 25 – 9 = 16, h is square root of 16 is 4 m now volume of sculputure is
\(\frac{1}{3}\) • 3.14 × r × r • h
= \(\frac{1}{3}\) • 3.14 × 3 m × 3 m × 4 m
= 37.68 m3.

Question 6.
A trophy is made of a glass triangular prism attached to a 0.5 inch high wooden block shaped like a square prism. The height of the trophy is 6 inches. The volume of the wooden base is 4.5 cubic inches. Find the volume of the entire trophy, including the base.
Math in Focus Grade 8 Chapter 7 Lesson 7.4 Answer Key Identifying Volumes of Composite Solids 10
Answer:

Explanation:
Given a trophy is made of a glass triangular prism attached to a 0.5 inch high wooden block shaped like a square prism.
The height of the trophy is 6 inches.
The volume of the wooden base is 4.5 cubic inches.
Let x be the equal length of each side of the square ,
then the volume of the block will be 0.5 × x2 = 4.5,
x2 = 9 , so x is square root of 9 is 3,
The area of each triangular face of the prism will be 1/2 × 3 × 6 = 9.
The volume of the triangular prism will be 9 × 3 = 27 cubic inches.
The total volume will be 4.5 + 27 = 31.5 cubic inches.

Question 7.
A swimming pool is 12 feet long and 10 feet wide. At its deepest, it is 7 feet deep. A slope 5 feet long links the deep end to the shallow end. Jonathan wants to fill the pool with 800 cubic feet of water. Is this possible? Explain.
Math in Focus Grade 8 Chapter 7 Lesson 7.4 Answer Key Identifying Volumes of Composite Solids 11
Answer:
Yes, it is possible that the volume of the pool is exactly 800 cubic feet which will allow the 800 cubic feet of water to completely fill it,

Explanation:
The minimum volume of the pool is 12 × 10 × 2 = 240 cubic feet and
the maximum volume of the pool is 12 × 10 × 7 = 840 cubic feet.
since 800 cubic feet is somewhere between 240 and 840 cubic feet than 800 cubic feet of water could fill the pool.
To fill the pool with exactly 800 cubic feet of water, the sloped section would have to have a cross section of a
right triangle where the vertical leg would have to be .4206601574 feet and the horizontal leg would have to be 4.982273079 feet and the hypotenuse would have to be 5 feet.
The slope of 5 feet in length that links the deep end of the pool to the shallow end of the pool if the hypotenuse of this right triangle.
The formula for the volume of the pool would be
10 × 12 × (7 – .4206601574) + 10 × 1/2 × .420601574 × 4.982273079 = 800 cubic feet.
So, if the minimum depth of the pool is 6.579339843 feet and the sloped section of the pool is 5 feet and the horizontal distance of the sloped section of the pool is 4.982273079 feet, and the maximum depth of the pool is 7 feet, then the volume of the pool will be exactly 800 cubic feet.
The area of this vertical cross section will be 80 square feet.
The volume of the pool will be 10 × the area of the vertical cross section, making the volume equal to 800 cubic feet.
Yes it is possible that the volume of the pool is exactly 800 cubic feet which will allow the 800 cubic feet of water to completely fill it.

Question 8.
A crystal paperweight is shaped like a cylinder with a star-shaped hole. The top of the star-shaped hole is shaped like a square with four points that are identical equilateral triangles. The height of the cylinder is 3 centimeters. Find the volume of the paperweight.
Math in Focus Grade 8 Chapter 7 Lesson 7.4 Answer Key Identifying Volumes of Composite Solids 12
Answer:
There is far too little information given. In addition to the height of the cylinder, we need to know its radius, along with the lengths of the sides of the square and equilateral triangles.

Question 9.
Math Journal The solid shown below is made of a cylinder with two identical cones at the ends of the cylinder. Linda says that if the radius of the cylinder is doubled, the volume of the solid will also be doubled. Is she correct? Why?
Math in Focus Grade 8 Chapter 7 Lesson 7.4 Answer Key Identifying Volumes of Composite Solids 13
Answer:
Linda is not correct,

Explanation:
Let radius of cylinder = r ,
Then, volume of cylinder is given by V = πr2h,
According to the question, now Radius of the cylinder = 2r
Then, volume of cylinder is given by V’ = π(2r)2h = 4πr2h =4 (πr2h) = 4V ⇒ V’ = 4V ,
Thus, volume will be four times more if the radius of a cylinder is doubled.
Linda is not correct because it becomes four times more.

Brain @ Work

Question 1.
An architect designs a staircase for a new house. There will be 14 steps, and each step will be 17 centimeters high and 25 centimeters wide. The architect will build a railing on both sides of the steps. Find the total length needed for the two railings, not including any vertical support posts.
Math in Focus Grade 8 Chapter 7 Lesson 7.4 Answer Key Identifying Volumes of Composite Solids 14
Answer:
The goal is to find the measure of the railings for the both sides of the staircase if the stairs have 14 steps and the steps are 17 centimeters in height and 25 centimeters in width.

Observe that the width, height and the railings of the staircase forms a right triangle. To determine the height and the width of the stairs, multiply the 14 steps to the measure of the riser and the measure of the width of the steps. For the height, 14 multiplied by 17 is 238 whiLe the product of 14 and 25 is 350 will be the width. Then appLying the Pythagorean Theorem which equates the square of the hypotenuse to the sum of the squares of the legs, the length of the railings can be computed represented by y which serves as the hypotenuse.
2382 + 3502 = y2   Use Pythagorean Theorem.
56, 644 + 122, 500 = y2    Multiply.
179, 144 = y2     Add.
y = \(\sqrt{179,144}\)      Find positive square root.
y ≈ 423.3 Simplify.
Therefore, the measure of the two railings are 423.3 centimeters.

Question 2.
The Colorado river is about 210 meters wide. Brad and John start swimming from the same bank. Brad swims 215 meters against the current to reach a point on the opposite bank. Brad’s swimming speed is greater than the speed of the current. John swims 220 meters with the current to reach another point on the opposite bank. Find the distance between the two points.
Answer:
First, for better understanding, illustrate the situation of John and Brad Let A be the starting point of Brad and John, B be the corresponding point of A in the opposite side of the river, C be the position of Brad on the other side of the river after he swims, and D be John’s position after swimming Since Brad swims opposite the current while John swims along with the current, then they went on the opposite side of one another to reach the other side of the river.
Math in Focus Grade 8 Chapter 7 Lesson 7.4 Answer Key Identifying Volumes of Composite Solids A 1
Notice that, the distance of the John and Brad can be computed by adding the distance of \(\overline{C B}\) and \(\overline{D B}\). Also, the measure of \(\overline{C B}\) and \(\overline{D B}\) can be solved by applying Pythagorean Theorem since \(\overline{A B}\), \(\overline{A C}\), and \(\overline{C B}\) creates a right triangle and \(\overline{A B}\), \(\overline{A D}\), and \(\overline{D B}\) form another right triangle.

For \(\overline{A B}\), \(\overline{A C}\), and \(\overline{C B}\)  Let \(\overline{A C}\) be the hypotenuse and the other lines be the Legs. Note that Pythagorean Theorem states that the square of the hypotenuse is equal to the sum of the squares of the legs of a right triangle then
\(\overline{A B}^{2}+\overline{C B}^{2}=\overline{A C}^{2}\)      Use the Pythagorean Theorem.
2102 + \(\overline{C B}^{2}\) = 2152   Substitution.
44. 100 + \(\overline{C B}^{2}\) = 46,225   Multiply.
\(\overline{C B}^{2}\) = 2, 125     Subtract 44.100 to both sides.
\(\overline{C B}\) = \(\sqrt{2,125}\)   Find the positive square root.
\(\overline{C B}\) ≈  46.1   Simplify.
Therefore, \(\overline{C B}\) measures about 46.1 meters.

Next, for \(\overline{A B}\), \(\overline{A D}\), and \(\overline{D B}\), let \(\overline{A D}\) be the hypotenuse and the remaining sides are the [egs then apply the Pythagorean Theorem again.
\(\overline{A B}^{2}+\overline{D B}^{2}=\overline{A D}^{2}\)     Use the Pythagorean Theorem.
2102 + \(\overline{D B}^{2}\) = 2202   Substitution
44, 100 + \(\overline{D B}^{2}\) = 48, 400 Multiply.
\(\overline{D B}^{2}\) = 4,300   Subtract 44,100 to both sides.
\(\overline{D B}\) = \(\sqrt{4,300}\) Find the positive square root.
\(\overline{D B}\) ≈  65.6      Simplify.
Therefore, \(\overline{D B}\) measures around 65.6 meters.

Lastly, add the two distances to determine the distance of John and Brad to one another.
46.1 + 65.6 = 111.7
Therefore, Brad and John are 111.7 meters away from one another.