This handy Math in Focus Grade 7 Workbook Answer Key Chapter 9 Lesson 9.5 Making Inferences About Populations detailed solutions for the textbook questions.
Math in Focus Grade 7 Course 2 B Chapter 9 Lesson 9.5 Answer Key Making Inferences About Populations
Math in Focus Grade 7 Chapter 9 Lesson 9.5 Guided Practice Answer Key
Solve.
Question 1.
A random sample of ages {15, 5, 8, 7, 18, 6, 15, 17, 6, 15} of 10 children was collected from a population of 100 children.
a) Calculate the sample mean age of the children and use it to estimate the population mean age.
Answer:
Mean is the average of the given numbers and is calculated by dividing the sum of given numbers by the total number of numbers.
Mean=Sum of observations/total number of observations
Mean=15+5+8+7+18+6+15+17+6+15/10
Mean=112/10
Mean=11.2 years.
b) Calculate the MAD of the sample.
Answer:
Now we got mean in the above question:
Mean=11.2 years. So calculate MAD.
The ratio of the sum of all absolute values of deviation from central measure to the total number of observations.
M.A. D = (Σ Absolute Values of Deviation from Central Measure) / (Total Number of Observations)
How to calculate MAD:
Steps to find the mean deviation from mean:
(i)Find the mean of the given observations.
(ii)Calculate the difference between each observation and the calculated mean
(iii)Evaluate the mean of the differences obtained in the second step.
This gives you the mean deviation from the mean.
Mean=11.2
The given data set: 15, 5, 8, 7, 18, 6, 15, 17, 6, 15
|15-11.2|=3.8
|5-11.2|=6.2
|8-11.2|=3.2
|7-11.2|=4.2
|18-11.2|=6.8
|6-11.2|=5.2
|15-11.2|=3.8
|17-11.2|=5.8
|6-11.2|=5.2
|15-11.2|=3.8
Now calculate MAD:
MAD=3.8+6.2+3.2+4.2+6.8+5.2+3.8+5.8+5.2+3.8/10
MAD=48/10
MAD=4.8 years
c) Calculate the MAD to mean ratio.
Answer:
About 43%
To calculate MAD to mean:
4.8 is what percent of 11.2
4.8/11.2*100%
After calculating the above equation we get:
=42.857
=43 (rounded to the nearest number).
d) Draw a dot plot for the ages and the mean age.
Answer:
A dot plot visually groups the number of data points in a data set based on the value of each point. This gives a visual depiction of the distribution of the data, similar to a histogram or probability distribution function. Dot plots allow a quick visual analysis of the data to detect the central tendency, dispersion, skewness, and modality of the data.
The given data set: 15, 5, 8, 7, 18, 6, 15, 17, 6, 15

e) Using the MAD to mean ratio and the dot plot, describe informally how varied the population ages are.
Answer:
Since the MAD to mean ratio is about 43%, the data vary from the mean significantly. The dot plot confirms that the data are spread far away from the mean.
Hands-On Activity
Materials
a novel with 200 to 300 pages
USE STATISTICS FROM A SAMPLE TO DESCRIBE THE VARIABILITY OF A POPULATION
Work in pairs.
The activity can be a collaborative effort for the whole class.
Background
The population is made up of all the words in a book. The length of a word is defined by the number of letters in it. The population characteristic is the mean word length.
STEP 1: Determine which sampling method you intend to use.
STEP 2: Generate five random samples. Each sample consists of 20 words.
STEP 3: For the 20 words in each sample, record each word and its length in a table like the one shown. Then calculate the mean and the mean absolute deviation for each sample.
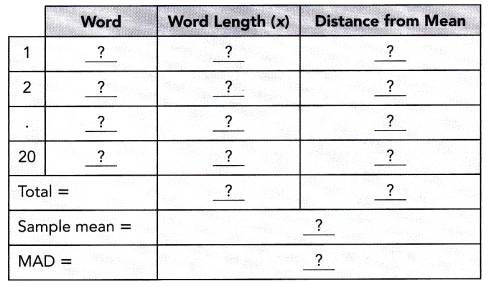
STEP 4: When you have completed STEP 1 to STEP 3 for all 20 samples, calculate the mean of the sample means.
Math journal What is the estimate of the population mean word length? By observing the mean absolute deviations of the five samples, describe informally whether the words in the book vary greatly in length.
Answer:
Solve.
Question 2.
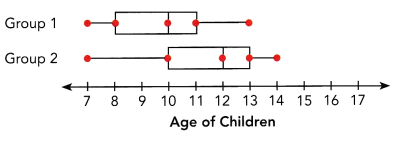
The ages of two groups of children are summarized in the box plots.
a) Show that the two groups have the same measure of variation (that is, the difference between quartiles) and the same interquartile range.
Answer:
The above box plot gives the data:
Group 1 data:
lowest number=7
Q1=8; Q2=10; Q3=11
Highest number=13
Group 2 data:
lowest number=7
Q1=10; Q2=12; Q3=13
Highest number=14
To show the same measure of variation
Group 1: Q2-Q1=10-8=2
Q3-Q2=1
Interquartile range=Q3-Q1
Interquartile range=11-8
Interquartile range=3
Group 2 calculation:
Q2-Q1=12-10=2
Q3-Q2=13-12=1
Interquartile range=Q3-Q1
Interquartile range=13-10
Interquartile range=3
b) Express the difference in median age in terms of the interquartile range.
Answer:
The above box plot gives the data:
Group 1 data:
lowest number=7
Q1=8; Q2=10; Q3=11
Highest number=13
Group 2 data:
lowest number=7
Q1=10; Q2=12; Q3=13
Highest number=14
We got the interquartile range for group 1 and group 2 is 3
The difference in median age in terms of IQR=X
X= Q2 of group1 – Q2 of group 2 /IQR
X=12-10/3
X=2/3 yr
c) What inference can you draw about the age distributions of the children in the two groups?
Answer:
The above box plot gives the data:
Group 1 data:
lowest number=7
Q1=8; Q2=10; Q3=11
Highest number=13
Group 2 data:
lowest number=7
Q1=10; Q2=12; Q3=13
Highest number=14
Since Q1 of group 2 is the same as the Q2 of group 1, it means that 75% of children in group 2 are older than 50% of children in group 1. Also, the median of group 2 is greater than the median of group 1. So the children in group 2 are generally older than group 1.
Question 3.
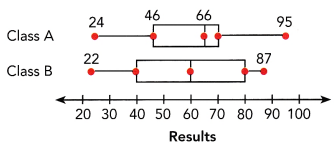
Two classes took a math test. The results are summarized in the box plots.
a) For which class are the data more spread out? Explain.
Answer: Class B
Class A data set:
Lowest number=24
Q1=46; Q2=66; Q3=70
Highest number=95
Class B data set:
Lowest number=22
Q1=40; Q2=60; Q3=80
Highest number=87
Now calculate the interquartile range:
IQR of class A=Q3-Q1
IQR of class A=70-46
IQR of class A=24
IQR of class B=Q3-Q1
IQR of class B=80-40
IQR of class B=40
Therefore, class B data are more spread out than class A because the interquartile range of class B is greater.
b) Comment on the performance of the two classes.
Answer:
Class A data set:
Lowest number=24
Q1=46; Q2=66; Q3=70
Highest number=95
Class B data set:
Lowest number=22
Q1=40; Q2=60; Q3=80
Highest number=87
Now here we need to check the performance according to the value of the median.
The median value of class A is 66
The median value of class B is 60
Thus, class A performed moderately better than class B because the median of class A is slightly higher at 66 and class B is 60.
Question 4.
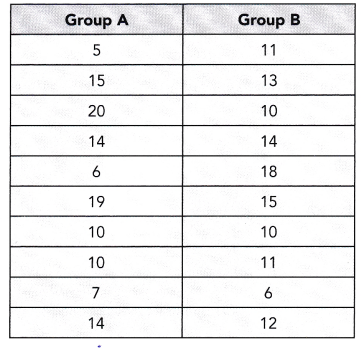
The numbers of questions that two groups of students answered correctly in a recent mathematics test are shown in the table.
a) Find the mean number of correct questions for each of the two groups.
Answer:
Mean is the average of the given numbers and is calculated by dividing the sum of given numbers by the total number of numbers.
Mean=Sum of observations/total number of observations
Mean of group A=5+15+20+14+6+19+10+10+7+14/10
Mean of group A=120/10
Mean of group A=12
Now calculate the mean for group B:
Mean of group B=11+13+10+14+18+15+10+11+6+12/10
Mean of group B=120/10
Mean of group B=12
b) Calculate the mean absolute deviation of each of the two groups.
Answer:
Now we got mean in the above question:
Mean of group A=12
Mean of group B=12. So calculate MAD.
The ratio of the sum of all absolute values of deviation from central measure to the total number of observations.
M.A. D = (Σ Absolute Values of Deviation from Central Measure) / (Total Number of Observations)
How to calculate MAD:
Steps to find the mean deviation from mean:
(i)Find the mean of the given observations.
(ii)Calculate the difference between each observation and the calculated mean
(iii)Evaluate the mean of the differences obtained in the second step.
This gives you the mean deviation from the mean.
The MAD of group A:
Data set of group A=5, 15, 20, 14, 6, 19, 10, 10, 7, 14
Mean=12
|5-12|=7
|15-12|=5
|20-12|=8
|14-12|=2
|6-12|=6
|19-12|=7
|10-12|=2
|10-12|=2
|7-12|=5
|14-12|=2
Now find the mean of the obtained differences:
MAD of group A=7+5+8+2+6+7+2+2+5+2/10
MAD of group A=46/10
MAD of group A=4.6
Now calculate the MAD of group B
Mean=12
data set of group B=11, 13, 10, 14, 18, 15, 10, 11, 6, 12
|11-12|=1
|13-12|=1
|10-12|=2
|14-12|=2
|18-12|=6
|15-12|=3
|10-12|=2
|11-12|=1
|6-12|=6
|12-12|=0
Now find the mean of the obtained differences:
MAD of group B=1+1+2+2+6+3+2+1+6+0/10
MAD of group B=24/10
MAD of group B=2.4
c) Draw separate dot plots for the two groups.
Answer:
A dot plot visually groups the number of data points in a data set based on the value of each point. This gives a visual depiction of the distribution of the data, similar to a histogram or probability distribution function. Dot plots allow a quick visual analysis of the data to detect the central tendency, dispersion, skewness, and modality of the data.
Dot plot for group A:

Dot plot for group B:

d) Interpret the above statistics and the dot plots.
Answer:
from the two-dot plots in above question (C), group A’s data are more scattered away from the mean and group B’s data cluster more closely around the mean. This explains why the MAD of group A is greater then that of group B.
e) What conclusion can you make about the performance of the two groups of students on the test?
Answer:
Group A’s performance is more varied whereas group B’s performance is more uniform.
Math in Focus Course 2B Practice 9.5 Answer Key
Solve. Show your work.
Question 1.
A random sample of a certain type of ball bearing produces a mean weight of 28 grams and a mean absolute deviation of 2.1 grams. What can be inferred from the sample about the population mean weight of this type of ball bearing?
Answer:
The above-given question:
The mean weight of ball bearing produces=28 grams
The mean absolute deviation=2.1 grams.
this can be calculated as:
2.1/28*100%
After calculating the above equation we get
=7.5%
Therefore, the estimated population mean weight is 28 grams with a MAD to mean ratio of 7.5%
Question 2.
You interviewed a random sample of 25 marathon runners and compiled the following statistics.
Mean time to complete the race = 220 minutes and MAD = 50 minutes What can you infer about the time to complete the race among the population of runners represented by your sample?
Answer:
The mean time to complete the race=220
The given MAD=50 min
This can be calculated as:
50/220*100%
After calculating the above equation we get
=22.72%
Therefore, the time to complete the race among the population of runners represented by your sample is 22.72%
Refer to the random sample below to answer the following. Round your answers to the nearest tenth.
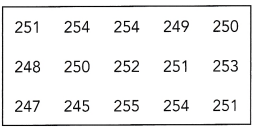
The table shows a random sample of the volume, in milliliters, of 15 servings of orange juice from a vending machine.
Question 3.
Use the sample mean volume to estimate the population mean volume of a serving of orange juice.
Answer:
The above-given data: 251, 254, 254, 249, 250, 248, 250, 252, 251, 253, 247, 245, 255, 254, 251
Mean is the average of the given numbers and is calculated by dividing the sum of given numbers by the total number of numbers.
Mean=Sum of observations/total number of observations
Mean=251+254+254+249+250+248+250+252+252+253+247+245+255+254+251/15
Mean=3764/15
Mean=250.93 ml
therefore, the sample means volume to estimate the population mean volume of a serving of orange juice is 250.93ml.
Question 4.
Calculate the MAD and the MAD to mean ratio.
Answer:
The ratio of the sum of all absolute values of deviation from central measure to the total number of observations.
M.A. D = (Σ Absolute Values of Deviation from Central Measure) / (Total Number of Observations)
How to calculate MAD:
Steps to find the mean deviation from mean:
(i)Find the mean of the given observations.
(ii)Calculate the difference between each observation and the calculated mean
(iii)Evaluate the mean of the differences obtained in the second step.
This gives you the mean deviation from the mean.
The above-given data: 251, 254, 254, 249, 250, 248, 250, 252, 251, 253, 247, 245, 255, 254, 251
Mean=250.9
Now subtract:
|251-250.9|=0.1
|254-250.9|=3.1
|254-250.9|=3.1
|249-250.9|=1.9
|250-250.9|=0.9
|248-250.9|=2.9
|250-250.9|=0.9
|252-250.9|=1.1
|251-250.9|=0.1
|253-250.9|=2.1
|247-250.9|=3.9
|245-250.9|=5.9
|255-250.9|=4.1
|254-250.9|=3.1
|251-250.9|=0.1
Now calculate the mean of obtained differences.
MAD=0.1+3.1+3.1+1.9+0.9+2.9+0.9+1.1+0.1+2.1+3.9+5.9+4.1+3.1+0.1/15
MAD=33.3/15
MAD=2.22
Now we know mean and MAD from this we can calculate ratio.
Ratio=2.22/250.9*100%
Ratio=0.88%
Question 5.
Use the MAD to informally infer whether the volume of orange juice in a serving varies greatly.
Answer:
The mean=250.9
The mean deviation=2.22
As the average deviation from the mean is less than 1%, the volume of orange juice per serving does not vary significantly.
Refer to the box plots at the right to answer the following.
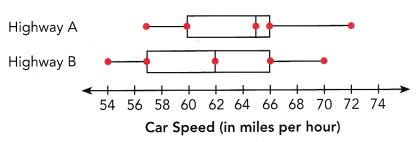
Two large random samples of car speeds on two highways from 4 P.M. to 6 P.M. were collected. The data were summarized in two box plots.
Question 6.
By comparing the interquartile ranges of the two box plots, what can you infer about car speeds on the two highways for the middle 50% of the cars?
Answer:
The above-given data:
The highway A data:
Lower value=57
Q1=60; Q2=65; Q3=66
Highest value=72
The Highway B data:
Lower value=54
Q1=57; Q2=62; Q3=66
Highest value=70
From this we can calculate the Interquartile range:
IQR=Q3-Q1
IQR of highway A=66-60
IQR of highway A=6
now calculate the interquartile range of highway B:
IQR of highway B=Q3-Q1
IQR of highway B= 66-57
IQR of highway B=9
By comparing the interquartile ranges of the two box plots, the highway B car speeds are more for 50% of the middle cars. Because the interquartile range of highway B is greater than that of highway A.
Question 7.
By comparing the medians of the two plots, what inference can you make?
Answer:
The above-given data:
The highway A data:
Lower value=57
Q1=60; Q2=65; Q3=66
Highest value=72
The Highway B data:
Lower value=54
Q1=57; Q2=62; Q3=66
Highest value=70
the median of highway A=65
the median of highway B=62
Therefore, the median car speeds on highway A is higher than that of highway B.
Question 8.
Suppose the speed limit on the two highways is 65 miles per hour. What per cent of the cars drove faster than the speed limit on the two highways?
Answer:
the above-given question:
The speed limit on the two highways=65 miles per hour.
The per cent of the cars drove faster than the speed limit on the two highways=X
X% of cars 65 we need to calcularte:
X/100*65
X/100=1/65
X=1/65*100
X=1.53
Therefore, 1.53% of the cars drove faster.
Question 9.
What can you infer about the overall car speeds on the two highways?
Answer:
50% of the cars on highway A go faster than the speed limit but less than 50% of the cars on highway B go faster than the speed limit.
Refer to the scenario below to answer the following.
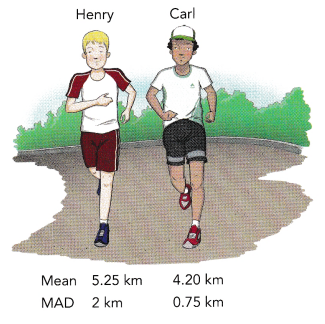
Henry and Carl go jogging every morning for several weeks. The following are the mean and the MAD of the distances they jog.
Question 10.
What would you infer about the distances they jog if you only compare their mean distances?
Answer:
the mean distance of henry=5.25km
The mean distance of Carl=4.20km
Henry jogs more than Carl
5.25-4.20=1.05
Henry jogs 1.05 km more than carl.
Question 11.
What can you conclude if you take into account both the mean and the MAD for your comparison?
Answer:
the mean distance of henry=5.25km
The mean distance of Carl=4.20km
the MAD distance of henry=2 kms
The MAD distance of Carl=0.75kms
By comparing all those distances, we can say Henry’s jogging distance is more varied than Carls jogging distance.
Refer to the random samples below to answer the following. Round your answers to the nearest tenth.
3 random samples of time taken, in seconds, to solve a crossword puzzle during a competition were collected.
S1 = {100, 87, 95, 103, 110, 90, 84, 88}
S2 = {75, 98, 120, 106, 70, 79, 100, 90}
S3 = {60, 68, 110, 88, 78, 90, 104, 73}
Question 12.
Calculate the mean time of each of the 3 samples.
Answer:
Mean is the average of the given numbers and is calculated by dividing the sum of given numbers by the total number of numbers.
Mean=Sum of observations/total number of observations
Mean of S1=100+87+95+103+110+90+84+88/8
Mean of S1=757/8
Mean of S1=94.625
Now calculate for S2
Mean of S2=75+98+120+106+70+79+100+90/8
Mean of S2=738/8
Mean os S2=92.25
Now calculate for S3
Mean of S3=60+68+110+88+78+90+104+73/8
Mean of S3=671/8
Mean of S3=83.875
Question 13.
Estimate the population mean time of the competition using the mean of the 3 sample means.
Answer:
Now we got 3 samples:
S1=94.625; S2=92.25; S3=83.875
Now we have to calculate for these 3 samples
Mean time=94.625+92.25+83.875/3
Mean time=270.75/3
Mean time=90.25
Mean time=90.3 (rounded to nearest number)
Therefore, the estimated population mean time f the competition using the mean of the 3 sample means is 90.3s
Question 14.
Combine S1, S2, and S3 into one sample and use the mean in question 13 to calculate the MAD of the combined sample.
Answer:
The ratio of the sum of all absolute values of deviation from central measure to the total number of observations.
M.A. D = (Σ Absolute Values of Deviation from Central Measure) / (Total Number of Observations)
How to calculate MAD:
Steps to find the mean deviation from mean:
(i)Find the mean of the given observations.
(ii)Calculate the difference between each observation and the calculated mean
(iii)Evaluate the mean of the differences obtained in the second step.
This gives you the mean deviation from the mean.
Mean=90.3
Now we got 3 samples:
S1=94.625; S2=92.25; S3=83.875
|94.625-90.3|=4.325
|92.25-90.3|=1.95
|83.875-90.3|=6.425
Now calculate the mean for obtained differences:
MAD=4.325+1.95+6.425/3
MAD=12.7/3
MAD=4.23
Question 15.
If you use the MAD found in question 14 to gauge the time variation among competitors, what can you infer?
Answer:
On average, time variation is from the mean is about 13.3% of the value of the meantime.
Refer to the random samples below to answer the following. Hound your answers to the nearest hundredth when you can.
Below are the history test scores of two classes of 20 students each.

Question 16.
Find the range of scores for each class.
Answer:
The range in statistics for a given data set is the difference between the highest and lowest values.
Range=highest observation-lowest observation
The given data set of class A is 84, 63, 90, 68, 42, 43, 31, 60, 88, 70, 25, 40, 32, 37, 79, 66, 55, 65, 35, 42
The given data set of class B is 63, 66, 62, 66, 80, 55, 72, 77, 66, 58, 66, 68, 44, 60, 70, 66, 76, 75, 71, 74
range of class A:
Maximum value=90
Minimum value=25
range=90-25
range of class A=65
Range of class B:
Maximum value=80
minimum value=44
Range=80-44
range of class B=36
Question 17.
Calculate the mean scores for each class.
Answer:
Mean is the average of the given numbers and is calculated by dividing the sum of given numbers by the total number of numbers.
Mean=Sum of observations/total number of observations
The given data set of class A is 84, 63, 90, 68, 42, 43, 31, 60, 88, 70, 25, 40, 32, 37, 79, 66, 55, 65, 35, 42
The given data set of class B is 63, 66, 62, 66, 80, 55, 72, 77, 66, 58, 66, 68, 44, 60, 70, 66, 76, 75, 71, 74
Mean=84+63+90+68+42+43+31+60+88+70+25+40+32+37+79+66+55+65+35+42/20
Mean of class A=1115/20
Mean of claa A=55.75
Now calculate mean of class B
Mean of class B=63+66+62+66+80+55+72+77+66+58+66+68+44+60+70+66+76+75+71+74/20
Mean of class B=1335/20
Mean of class B=66.75
Question 18.
Calculate the MAD for each class.
Answer:
The ratio of the sum of all absolute values of deviation from central measure to the total number of observations.
M.A. D = (Σ Absolute Values of Deviation from Central Measure) / (Total Number of Observations)
How to calculate MAD:
Steps to find the mean deviation from mean:
(i)Find the mean of the given observations.
(ii)Calculate the difference between each observation and the calculated mean
(iii)Evaluate the mean of the differences obtained in the second step.
This gives you the mean deviation from the mean.
The given data set of class A is 84, 63, 90, 68, 42, 43, 31, 60, 88, 70, 25, 40, 32, 37, 79, 66, 55, 65, 35, 42
Mean of class A=55.75
|84-55.75|=28.25
|63-55.75|=7.25
|90-55.75|=34.25
|68-55.75|=12.25
|42-55.75|=13.75
|43-55.75|=12.75
|31-55.75|=24.75
|60-55.75|=4.25
|88-55.75|=32.25
|70-55.75|=14.25
|25-55.75|=30.75
|40-55.75|=15.75
|32-55.75|=23.75
|37-55.75|=18.75
|79-55.75|=23.25
|66-55.75|=10.25
|55-55.75|=0.75
|65-55.75|=9.25
|35-55.75|=20.75
|42-55.75|=13.75
Now calculate the mean for obtained differences
MAD of class A=351/20
MAD of class A=17.55
Now likewise calculate for class B
Mean of class B=66.75
The given data set of class B is 63, 66, 62, 66, 80, 55, 72, 77, 66, 58, 66, 68, 44, 60, 70, 66, 76, 75, 71, 74
|63-66.75|=3.75
|66-66.75|=0.75
|62-66.75|=4.75
|66-66.75|=0.75
|80-66.75|=13.25
|55-66.75|=11.75
|72-66.75|=5.25
|77-66.75|=10.25
|66-66.75|=0.75
|68-66.75|=1.25
|44-66.75|=22.75
|60-66.75|=6.75
|70-66.75|=3.25
|66-66.75|=0.7
|76-66.75|=9.25
|75-66.75|=8.25
|71-66.75|=4.25
|74-66.75|=7.25
Now calculate the mean for obtained differences
MAD of class B=115/20
MAD of class B=5.75
Question 19.
By comparing the mean scores and the MADs of the two classes, what can you infer about the performance of the two classes?
Answer:
Mean of class A=55.75
Mean of class B=66.75
MAD of class A=17.55
MAD of class B=5.75
the mean score of class B is greater than the mean score of class A. In other words, class B’s performance on average is better than class A’s performance. In addition, the MAD shows that class B’s scores is less varied than class A’s scores.
Brain @ Work
The bar graph displays monthly rainfall, in milliliters, from April to August.
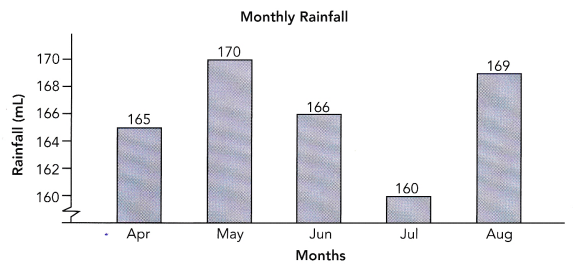
Alex draws the conclusion that rainfall varies greatly from April to August.
a) Find the mean rainfall.
Answer:
The given data: 165, 170, 166, 160, 169
Mean is the average of the given numbers and is calculated by dividing the sum of given numbers by the total number of numbers.
Mean=Sum of observations/total number of observations
Mean=165+170+166+160+169/5
Mean=830/5
Mean=166 ml
b) Calculate the mean absolute deviation.
Answer:
The ratio of the sum of all absolute values of deviation from central measure to the total number of observations.
M.A. D = (Σ Absolute Values of Deviation from Central Measure) / (Total Number of Observations)
How to calculate MAD:
Steps to find the mean deviation from mean:
(i)Find the mean of the given observations.
(ii)Calculate the difference between each observation and the calculated mean
(iii)Evaluate the mean of the differences obtained in the second step.
This gives you the mean deviation from the mean.
Mean=166
The given data: 165, 170, 166, 160, 169
|165-166|=1
|170-166|=4
|166-166|=0
|160-166|=6
|169-166|=3
Now calculate the mean for obtained differences:
MAD=1+4+0+6+3/5
MAD=14/5
MAD=2.8 ml
c) Based on your mean absolute deviation, do you agree with Alex’s conclusion? Explain why you agree or disagree.
Answer:
No, I disagree with Alex’s conclusion.
MAD to mean ratio:
2.8/166*100%
=1.69%
The MAD to mean ratio is 1.69%. It means that the average deviation from the mean is very insignificant. The vertical axis of the bar graph is not drawn to scale. As such, it creates a visual distortion of the differences in heights of the vertical bar.