This handy Math in Focus Grade 6 Workbook Answer Key Cumulative Review Chapters 12-14 detailed solutions for the textbook questions.
Math in Focus Grade 6 Course 1 B Cumulative Review Chapters 12-14 Answer Key
Concepts and Skills
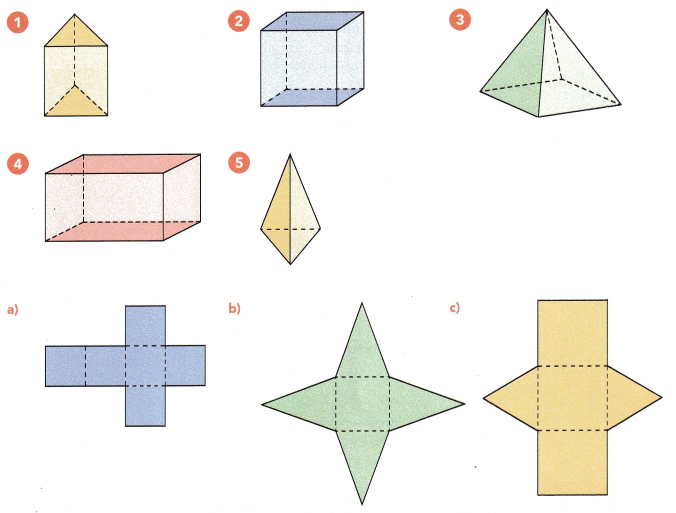
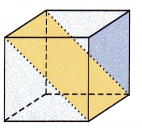
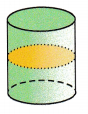
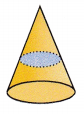
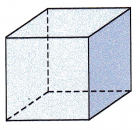
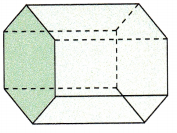
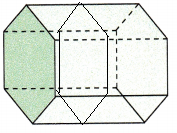
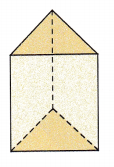
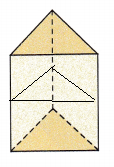
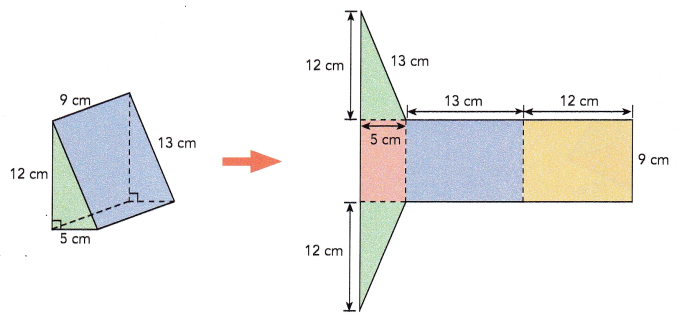
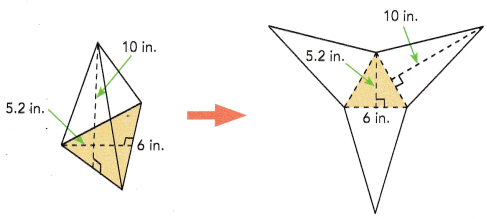
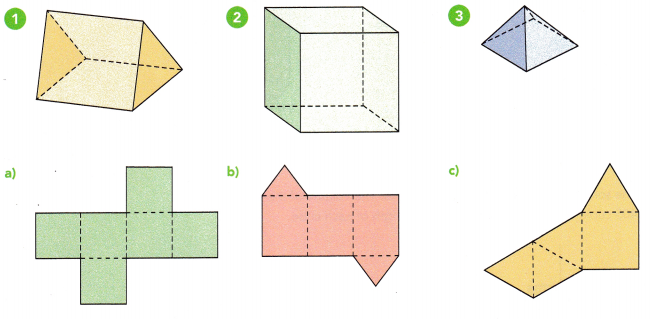
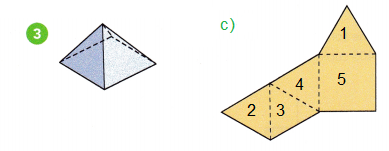
Match each of the solid figures to its net. (Lesson 12.1)
Question 1.
Answer:
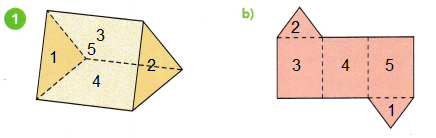
1 – b
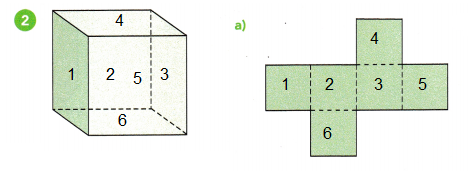
2 – a
3 – c
Explanation:
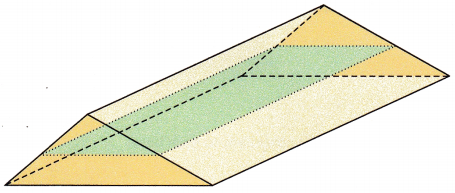
A triangular prism is a polyhedron made up of two triangular bases and three rectangular sides.
It is a three-dimensional shape that has three side faces and two base faces, connected to each other through the edges.
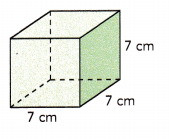
In geometry, a cube is a three-dimensional solid object bounded by six square faces, facets or sides, with three meeting at each vertex.
A pyramid is a three-dimensional figure. It has a flat polygon base.
All the other faces are triangles and are called lateral faces.
The number of lateral faces equals the number of sides on its base.
Its edges are the line segments formed by two intersecting faces.
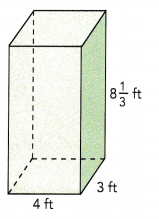
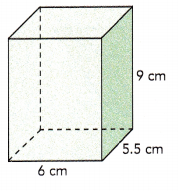
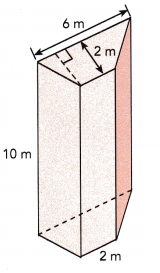
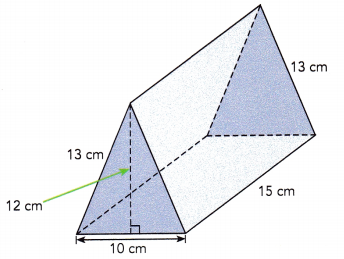
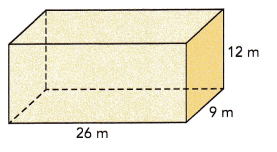
Find the surface area and volume of each prism. (Lesson 12.1, 12.2)
Question 4.
Answer:
Surface Area SA = 1308 square meter.
Volume V = 2808 cubic meters.
Explanation:
The surface area of a cuboid, add the areas of all 6 faces.
We can also label the length (l), width (w), and height (h) of the prism and use the formula, SA=2lw+2lh+2hw, to find the surface area.
SA=2lw+2lh+2hw
SA = 2x 26×9 + 2x 26×12 + 2x 9x 12
SA = 468 + 624 + 216
SA = 1308 sq meter
Volume of a cuboid:
The volume of cuboid is the quantity that is used to measure the space in a cuboid.
A cuboid is a three-dimensional shape that can be seen around us very often.
The term volume is used in measuring the capacity of any shape based on its dimensions such as: length, breadth, and, height. To calculate the volume of a cuboid,
V = l × b × h = lbh
V = 26 x 9 x 12
V = 2808 cubic meters.
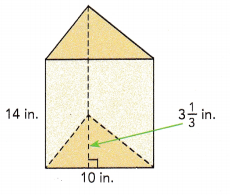
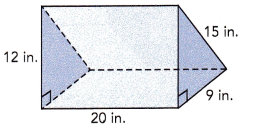
Question 5.
Answer:
Surface Area = 828 square inches.
Volume = 1080 cube inches.
Explanation:
The surface area of triangular prism is the total area of all its faces.
A triangular prism is a prism that has two congruent triangular faces and three rectangular faces that join the triangular faces.
has 6 vertices, 9 edges, and 5 faces. Let us learn more about the surface area of a triangular prism.
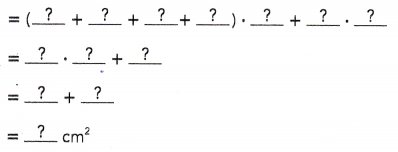
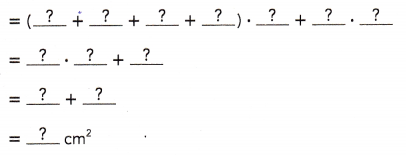
Surface area = (Perimeter of the base × Length of the prism) + (2 × Base Area)
= (S1 +S2 + S3)L + bh
=(12 + 15 + 9)20 + 15 x 20
= 720 + 108
= 828 square inches.
Volume:
V =(1/2)( l × b × h) = (0.5)lbh
V = 0.5 x 20 x 9 x 12
V = 1,080 cubic meters.
Solve. Show your work. (Lessons 14.1, 14.2)
Question 6.
The data set shows the lengths (in inches) of seven pieces of wire.
7.9, 6.8, 7.6, 9.9, 10.1,9.1, 10.9
Find the mean and median lengths of these seven pieces of wire.
Answer:
mean = 8.9
median = 9.1
Explanation:
Given set of data, 7.9, 6.8, 7.6, 9.9, 10.1,9.1, 10.9
arrange the given data in the ascending order,
6.8, 7.6, 7.9, 9.1, 9.9, 10.1, 10.9
Mean:
The mean = \(\frac{Sum of a set of items}{Number of items}\)
mean = \(\frac{6.8 + 7.6 + 7.9 + 9.1 + 9.9 + 10.1 + 10.9}{7}\)
mean = \(\frac{62.9}{7}\)
mean = 8.9
Median:
median : Middle value is the median of a given data set.
6.8, 7.6, 7.9, 9.1, 9.9, 10.1, 10.9
the above data has 7 observations,
So, 9.1 in the middle of the order sequence is the median.
median = 9.1
Question 7.
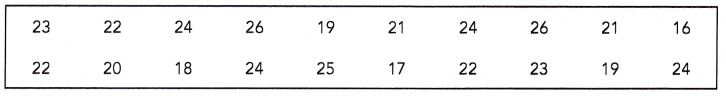
The data set shows the weights (in pounds) of 9 vases.
8.8, 8.3, 7.7, 11.6, 9.9, 8.9, 10.4, 9.6, 8.5
Find the mean and median weights of these 9 vases.
Answer:
Mean = 9.3lb
Median = 8.9lb
Explanation:
Given set of data, 8.8, 8.3, 7.7, 11.6, 9.9, 8.9, 10.4, 9.6, 8.5
arrange the given data in the ascending order,
7.7, 8.3, 8.5, 8.8, 8.9, 9.6, 9.9, 10.4, 11.6
Mean:
The mean = \(\frac{Sum of a set of items}{Number of items}\)
mean = \(\frac{7.7 + 8.3 + 8.5 + 8.8 + 8.9 + 9.6 + 9.9 + 10.4 + 11.6}{9}\)
mean = \(\frac{83.7}{9}\)
mean = 9.3
Median:
median : Middle value is the median of a given data set.
7.7, 8.3, 8.5, 8.8, 8.9, 9.6, 9.9, 10.4, 11.6
the above data has 9 observations,
8.9 in the middle of the order sequence is the median.
Question 8.
The data set shows the heights (in feet) of 8 trees.
53, 56, 65, 61, 67, 60, 52, 48
Find the mean and median heights of these 8 trees.
Answer:
Mean = 57.75
Median = 58
Explanation:
Given set of data, 53, 56, 65, 61, 67, 60, 52, 48
arrange the given data in the ascending order,
48, 52, 53, 56, 60, 61, 65, 67
Mean:
The mean = \(\frac{Sum of a set of items}{Number of items}\)
mean = \(\frac{48 + 52 + 53 + 56 + 60 + 61 + 65 + 67}{8}\)
mean = \(\frac{462}{8}\)
mean = 57.75
Median:
median : Middle value is the median of a given data set.
48, 52, 53, 56, 60, 61, 65, 67
the above data has 8 observations,
So, 56, 60 are in the middle of the order sequence is the median.
the average of (56 + 60)/2 = 116/2 = 58
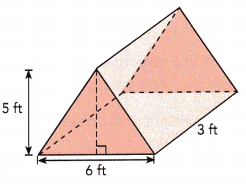
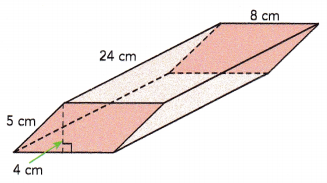
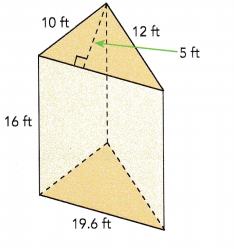
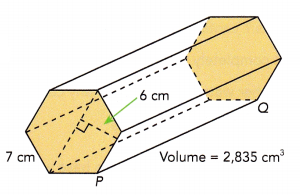
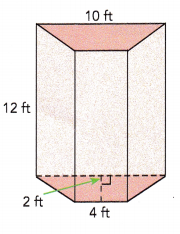
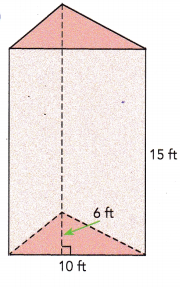
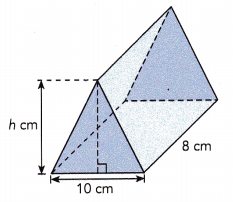
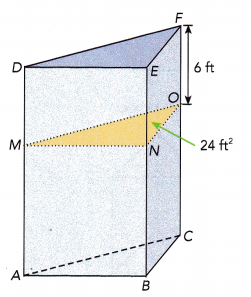
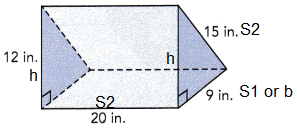
The volume of each triangular prism is 497 cubic feet. Find the height of the triangular base. Round your answers to the nearest tenth of a foot. (Lesson 12.3)
Question 9.
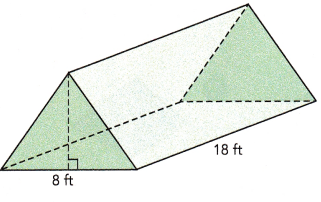
Answer:
6.9 feet.
Explanation:
Volume:
V =(1/2)( l × b × h) = (0.5) lbh
V = 0.5 x 18 x 8 x h
497 = 72h
h = \(\frac{497}{72}\)
h = 6.9 ft
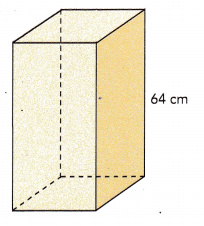
Question 10.
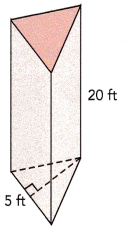
Answer:
9.94 ft
Explanation:
Volume:
V =(1/2)( l × b × h) = (0.5) lbh
V = 0.5 x 20 x 5 x h
497 = 50h
h = \(\frac{497}{50}\)
h = 9.94 ft
Solve. (Lesson 12.3)
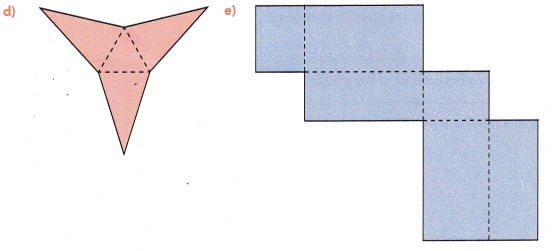
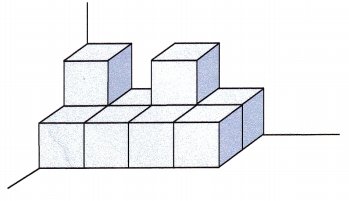
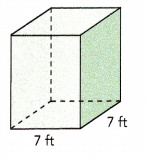
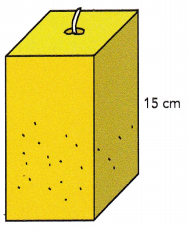
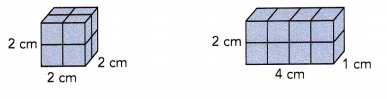
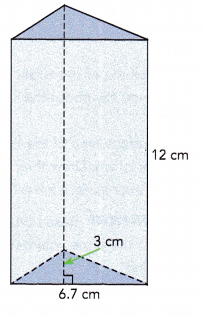
Question 11.
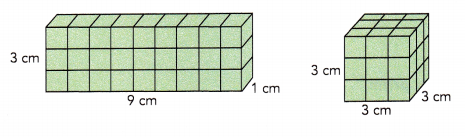
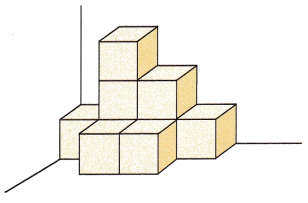
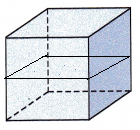
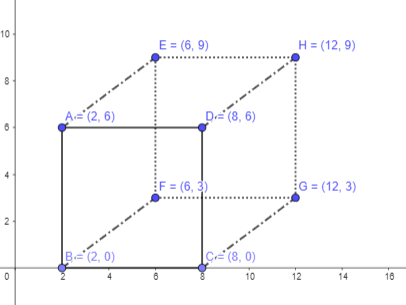
The solid below is made of identical cubes. The volume of the solid is 405 cubic centimeters. Find the edge length of each cube.
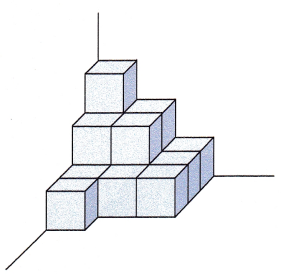
Answer:
3 cm
Explanation:
The volume of a cube is length x width x height.
Since it’s a cube, though, the length, width, and height are all equal, and equivalent to the length of one edge of the cube.
Therefore, to find the length of an edge of the cube,
just find the cube root of the volume.
Formula for volume of cube is given by V=a3
where a is edge of the cube.
Given,
volume = 405 cm3
The volume of the solid is 405 cubic centimeters, there are 15 cubes
405 /15 = 27
volume = 27 cm3
a3 = 27
a = 3 cm
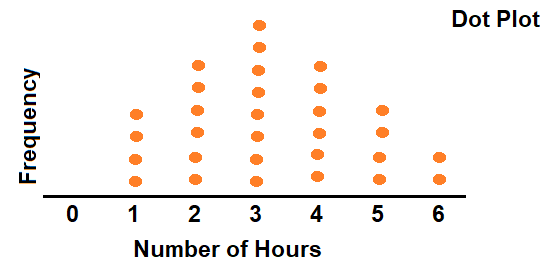
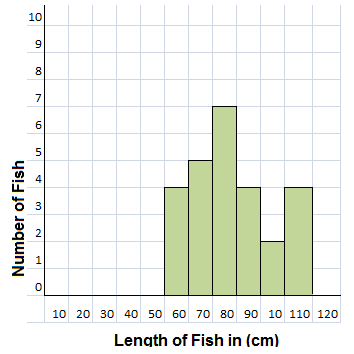
Draw a dot plot and a histogram for the set of data. Include a title. (Lessons 13.2, 13.3)
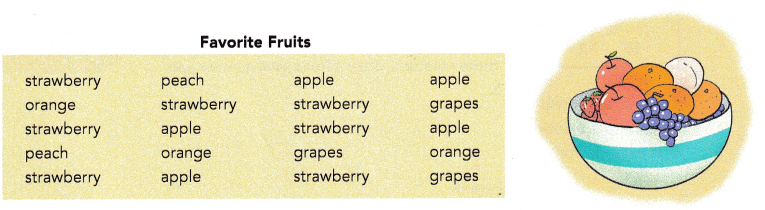
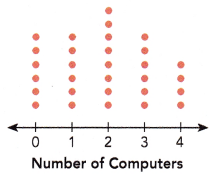
Question 12.
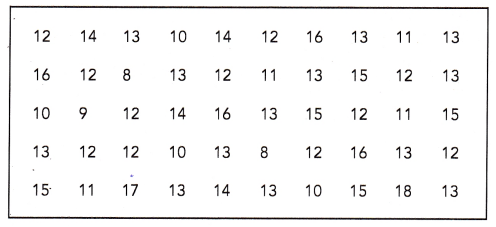
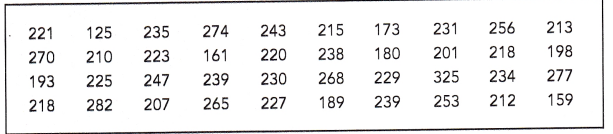
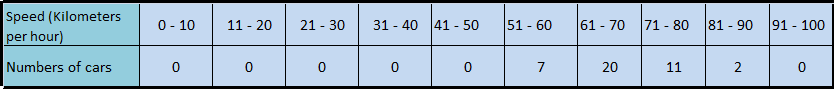
The number of pieces of fruits eaten in the past two days by each of 30 students was recorded below.
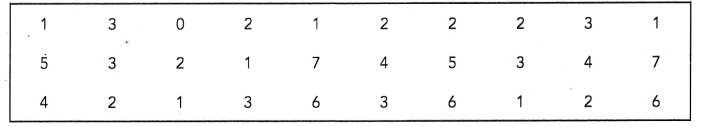
a) Represent the set of data with a dot plot.
Answer:
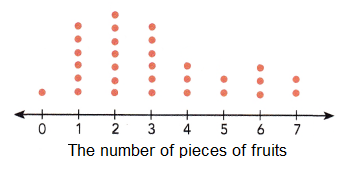
Explanation:
Each dot represent one children,
the number of pieces of fruits eaten in the past two days by each of 30 students was recorded with orange dots.
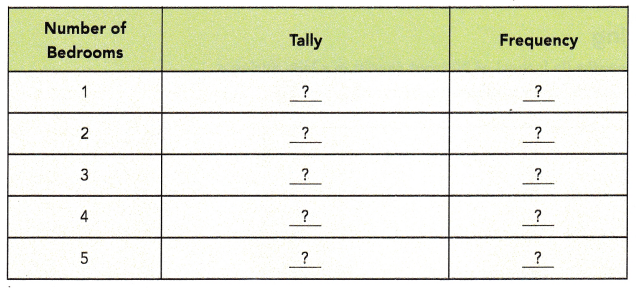
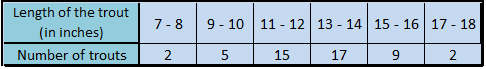
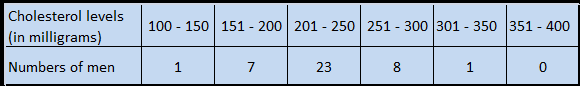
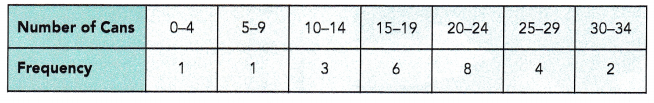
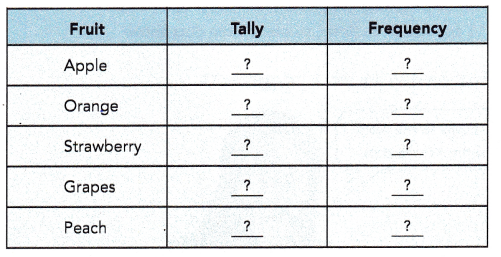
b) Group the data into suitable intervals and tabulate them.
Answer:

Explanation:
With an interval of one numbers all dots are tabulated in a table as shown in the above table for the above data given.
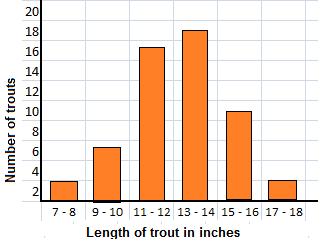
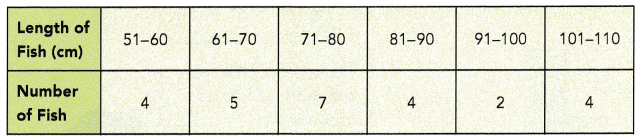
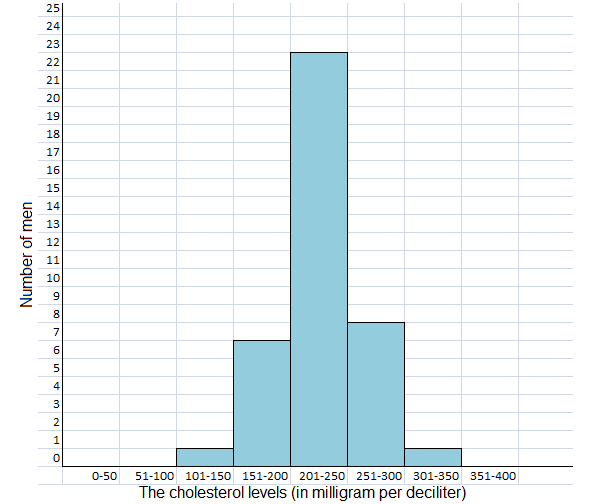
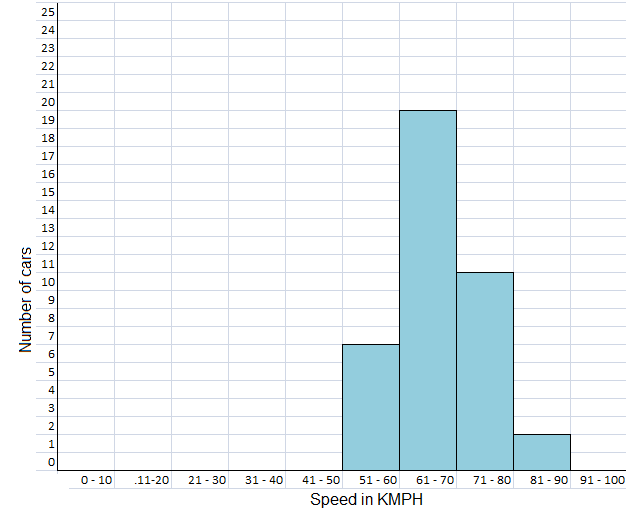
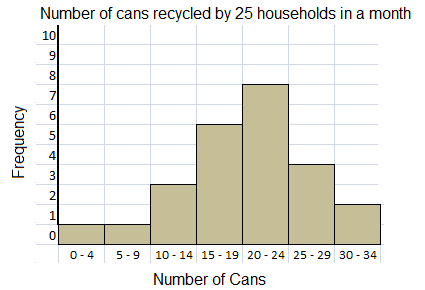
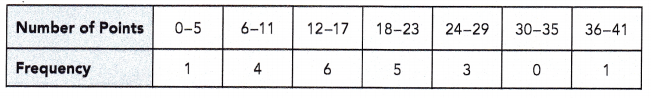
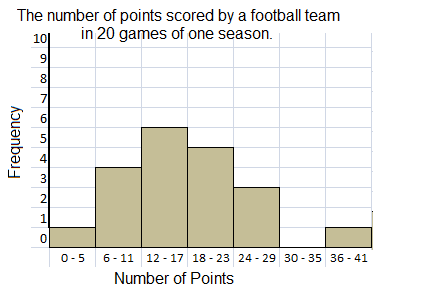
c) Draw a histogram using the intervals from part b). Briefly describe the data.
Answer:
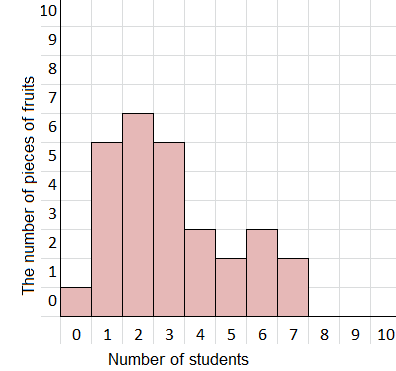
Explanation:
Histogram drawn using the intervals from the data in the table as shown in the above table.
x-axis shows the number of students and y-axis shows number of pieces of fruits.
With an interval of one number as shown above.
The shape of the histogram is right skewed.
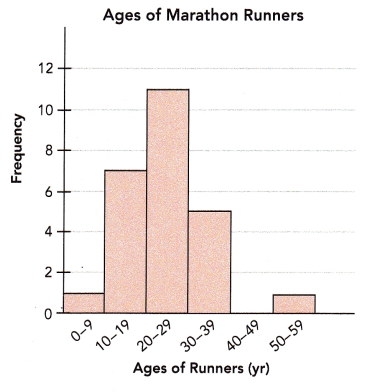
Describe the data. (Lesson 13.3)
Question 13.
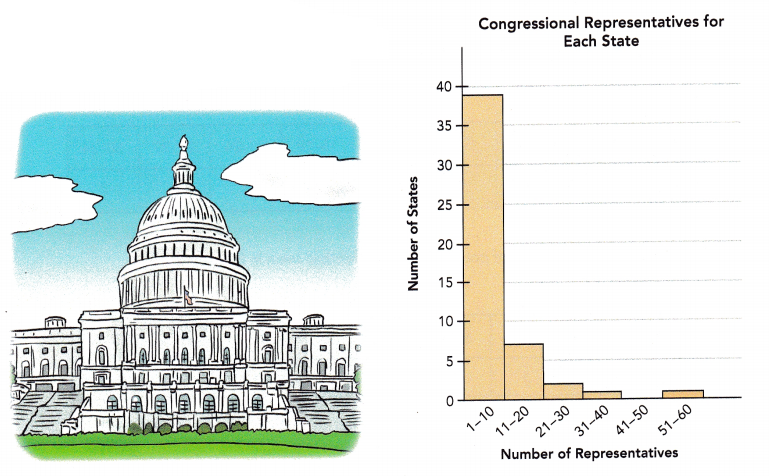
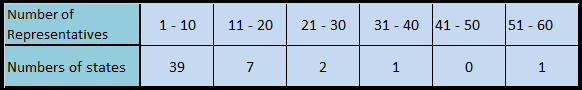
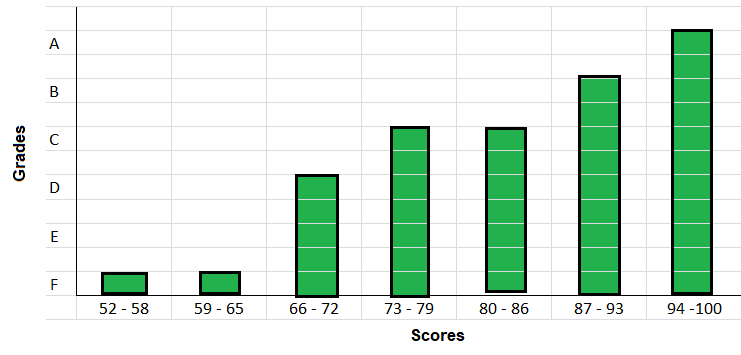
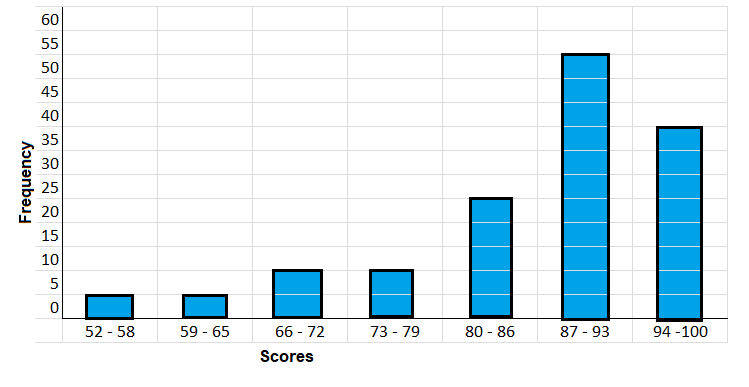
The histogram shows the number of floors each building has in a particular city. Briefly describe the data.
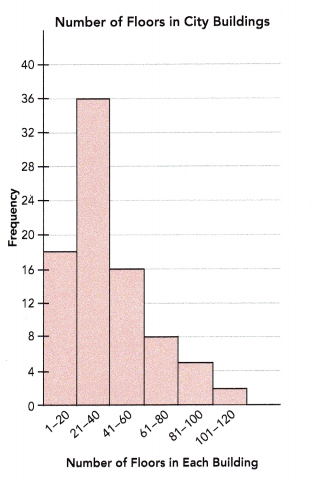
Answer:
Total buildings = 84
Most of the buildings have 21 to 40 floors.
The range of the data is 119.
Most of the data values are to the right of the interval 21-40,
The shape of the histogram is right skewed.
Explanation:

The above histogram shows the number of floors each building has in a particular city.
As, total buildings, range of the data, intervals of the data and shape of the histogram are described.
Problem Solving
Draw a dot plot for each set of data. Use your dot plot to answer each question. (Chapters 13, 14)
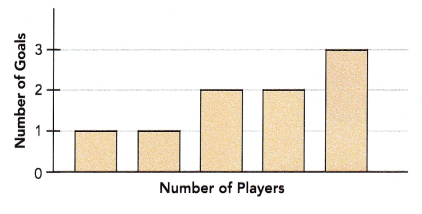
Question 14.
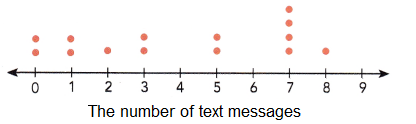
The data set shows the number of text messages sent by Emily in 14 days.
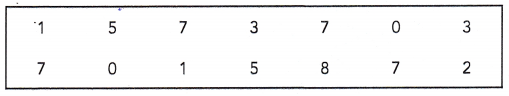
a) Represent the set of data with a dot plot.
Answer:
Explanation:
The above dot plot shows the data set and the number of text messages sent by Emily in 14 days.. Each dot represents one message.
b) Find the mean, median, and mode of the data set.
Answer:
Mean = 3
Mode = 7
Median = 4
Explanation:
The above dot plot shows the data set and the number of text messages sent by Emily in 14 days.. Each dot represents one message.
Mean:
The mean = \(\frac{Sum of a set of items}{Number of items}\)
mean = \(\frac{0x2 + 1×2 + 2×1 + 3×2 + 5×2 + 7×4 + 8×1 }{14}\)
mean = \(\frac{0 + 2 + 2 + 6 + 10 + 14 + 8 }{14}\)
mean = \(\frac{42}{14}\)
mean = 3
Mode:
Mode is the value which occurs the maximum number of times in a given data set.
It is the third measure of the central tendency.
0, 0, 1, 1, 2, 3, 3, 5, 5, 7, 7, 7, 7, 8
the above data has 14 observations,
So, 7 appears most frequently, is the mode of a given data.
Median:
median : Middle value is the median of a given data set.
0, 0, 1, 1, 2, 3, 3, 5, 5, 7, 7, 7, 7, 8
the above data has 14 observations,
Median is the average value of the 3 & 5
(3 + 5 )/2 = 8/2 = 4
So, 4 in the middle of the order sequence is the median.
Question 15.
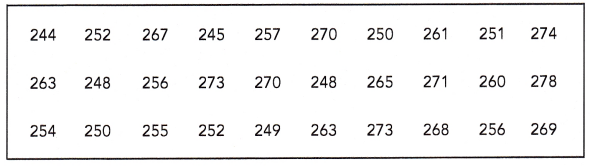
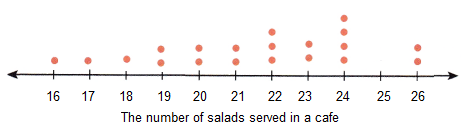
The data set shows the number of salads served in a cafe for each of 20 days.
a) Represent the set of data with a dot plot.
Answer:
Explanation:
The given data set shows the number of salads served in a Cafe for each of 20 days.
Each dot represents the number of salad served in Cafe.
b) Find the mean, median, and mode of the data set.
Answer:
Mean = 21.8
Median = 22
Mode = 24
Explanation:
The given data set shows the number of salads served in a Cafe for each of 20 days.
Mean:
The mean = \(\frac{Sum of a set of items}{Number of items}\)
mean = \(\frac{1×16 + 1×17 + 1×18 + 2×19 + 2×20 + 2×21 + 3×22 + 2×23 + 4x 24+ 2×26 }{14}\)
mean = \(\frac{16 + 17 + 18+ 38 + 40 + 42 + 66 + 46 + 96 + 52 }{14}\)
mean = \(\frac{431}{20}\)
mean = 22
Mode:
Mode is the value which occurs the maximum number of times in a given data set.
It is the third measure of the central tendency.
16, 17, 18, 19, 19, 20, 20, 21, 21, 22, 22, 22, 23, 23, 24, 24, 24, 24, 26, 26
the above data has 20 observations,
So, 24 appears most frequently, is the mode of a given data.
Median:
median : Middle value is the median of a given data set.
16, 17, 18, 19, 19, 20, 20, 21, 21, 22, 22, 22, 23, 23, 24, 24, 24, 24, 26, 26
the above data has 14 observations,
Median is the average value of the 3 & 5
(22 + 22 )/2 = 44/2 = 22
So, 22 in the middle of the order sequence is the median.
Solve. Show your work. (Chapter 12)
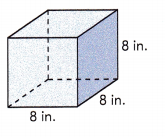
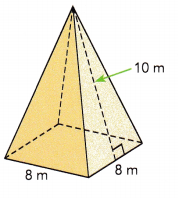
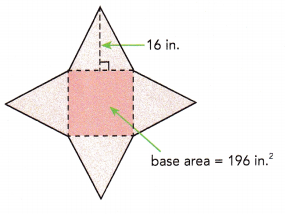
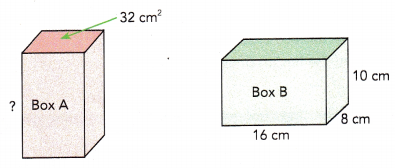
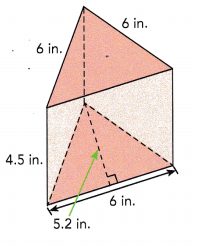
Question 16.
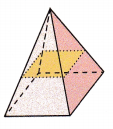
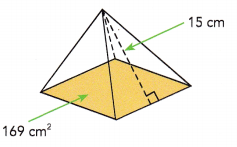
The square pyramid shown has congruent triangular faces. The area of one triangular face is 48 square inches. Find the surface area of the pyramid.
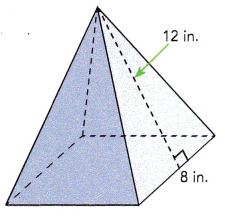
Answer:
112 Sq in
Explanation:
Surface Area = Base area + Lateral Area
Base area = Side X Side
BA = 8 x 8 = 64 Sq in
Lateral Area LA = (1/2) Side x Height
LA = (1/2) x 8 x 12
LA = 48
Surface Area SA= Base area + Lateral Area
SA = 64 + 48 = 112 Sq in
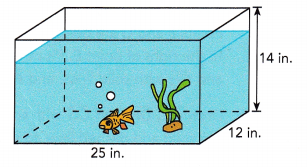
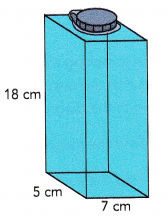
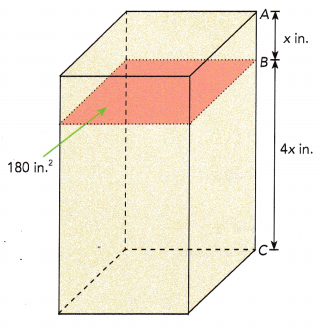
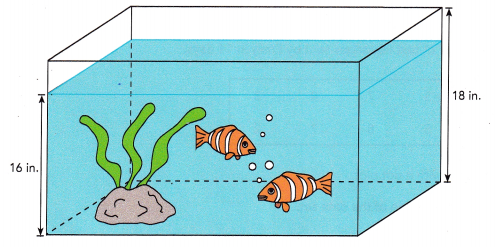
Question 17.
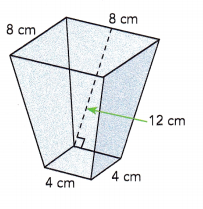
The length of the aquarium shown is two times its width. The height of the aquarium is 18 inches. The aquarium is filled with water to a height of 16 inches. The volume of the water is 7,200 cubic inches.
a) Find the length of the base of the aquarium.
Answer:
Length = 30 inches.
Explanation:
The height of the aquarium is 18 inches.
The aquarium is filled with water to a height of 16 inches.
The volume of the water is 7,200 cubic inches.
Volume V =Length X Width X Height
V = l.w.h
Let x be the length of the width, and length of base if 2x
V = 2w x w x 16
7200 =32 . w2
225 = w2
w = 15
width w = 15 inches
Length of the base = 2xw
l = 2 x 15
l =30 inches.
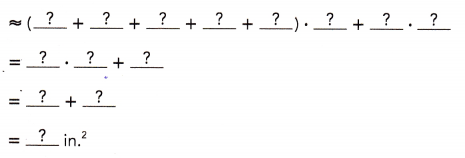
b) Then find the amount of glass, in square inches, used to make the bottom and sides of the aquarium.
Answer:
Surface Area = 2070 square inches.
Explanation:
The surface area of a cuboid, add the areas of all 6 faces.
We can also label the length (l), width (w), and height (h) of the prism and use the formula, SA=2lw+2lh+2hw, to find the surface area.
SA=2lw+2lh+2hw
SA = 30×15 + 2x 18×15 + 2x 30×18
SA = 450 + 540 + 1080
SA = 2,070 sq inches.
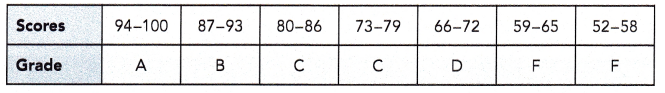
Solve. (Chapter 13)
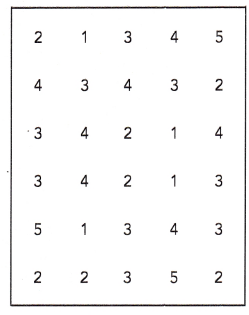
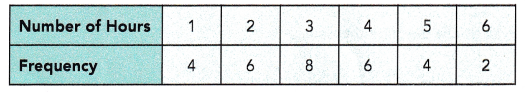
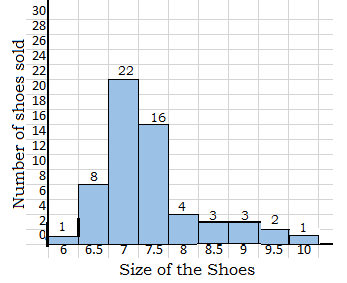
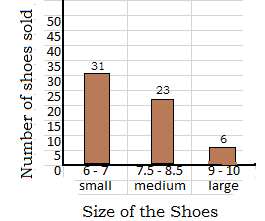
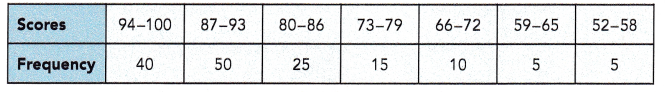
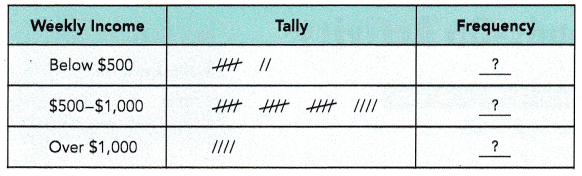
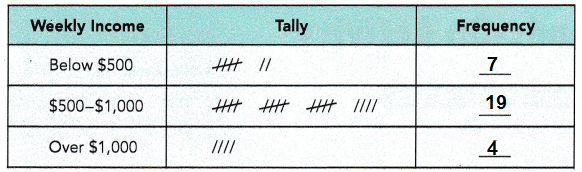
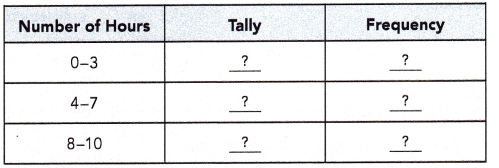
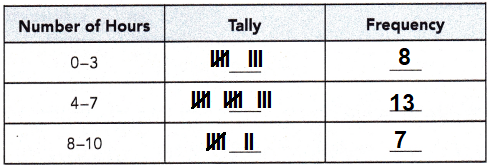
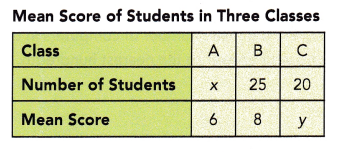
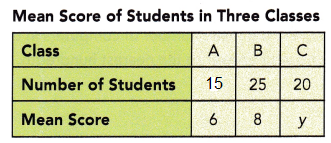
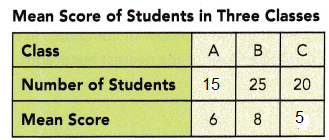
Question 18.
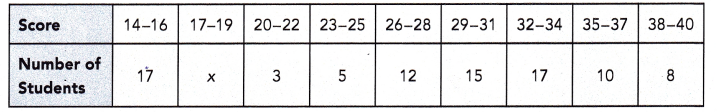
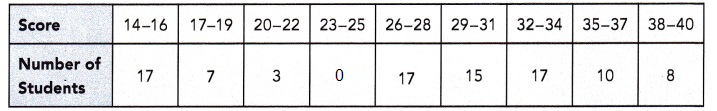
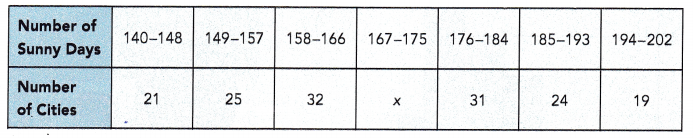
The table shows the number of hours each of 120 students spent helping their community in two months.
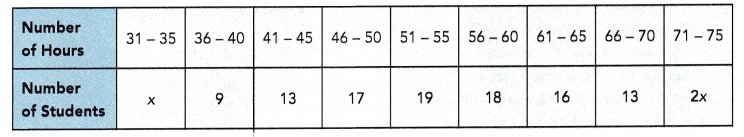
a) Find the value of x.
Answer:
x = 5
Explanation:
The given table shows the number of hours each of 120 students spent helping their community in two months.
x + 2x + 105 = 120
120 -105 = 3x
3x = 15
x = 5
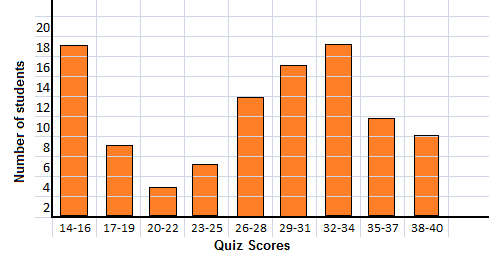
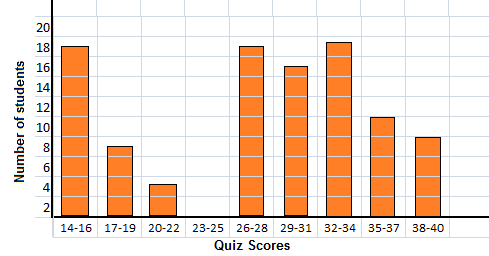
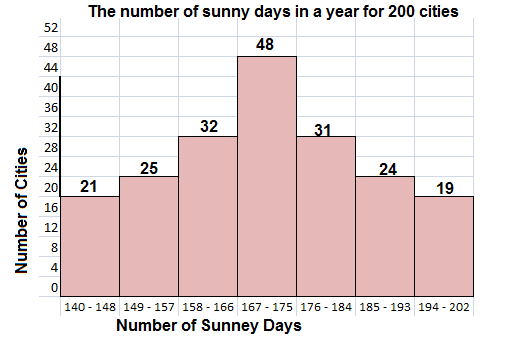
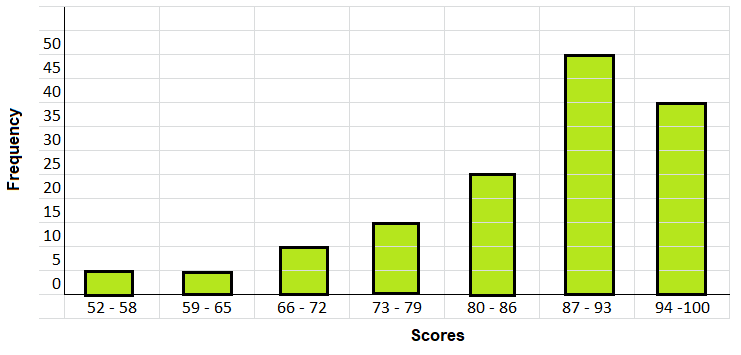
b) Draw a histogram to represent the data. Briefly describe the data.
Answer:
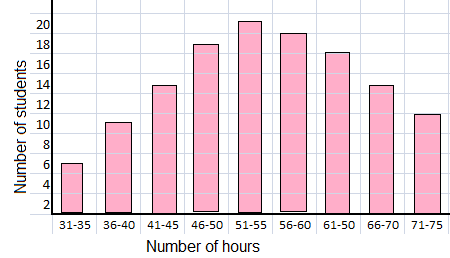
Explanation:
The given table shows the number of hours each of 120 students spent helping their community in two months.
Histogram drawn using the intervals from the data in the table as shown in the above table.
Number of students is on x-axis and number of hours on y-axis.
Most of the data values are to the right of the interval 31-75,
The shape of the histogram is right skewed.
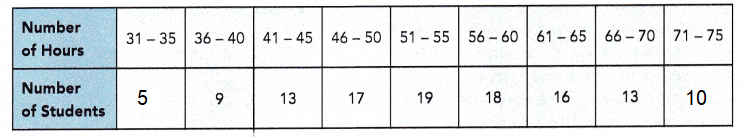
c) What percent of the students spent more than 55 hours helping their community?
Answer:
47.5 %
Explanation:
The given table shows the number of hours each of 120 students spent helping their community in two months.
The students spent more than 55 hours helping their community are,
18+16+13+10 = 57 hours
57 x 5 = 285 hours
Total 120 x 5 = 600 hours
The percent of the students spent more than 55 hours helping their community are,
57/120 = 0.475
0.475 x 100 = 47.5%
d) What percent of the students spent less than 46 hours helping their community?
Answer:
22.5%
Explanation:
The given table shows the number of hours each of 120 students spent helping their community in two months.
Number of the students spent less than 46 hours helping their community are,
5+9+13 = 27 hours.
27 x 5 = 135 hours.
Total 120 x 5 = 600 hours.
The percent of the students spent more than 55 hours helping their community are,
27/120 = 0.225
0.225 x 100 = 22.5%
Make a dot plot to show the data. Use your dot plot to answer each question. (Chapters 13, 14)
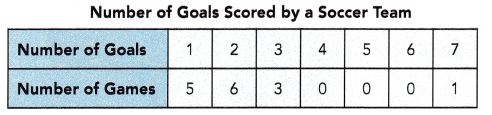
Question 19.
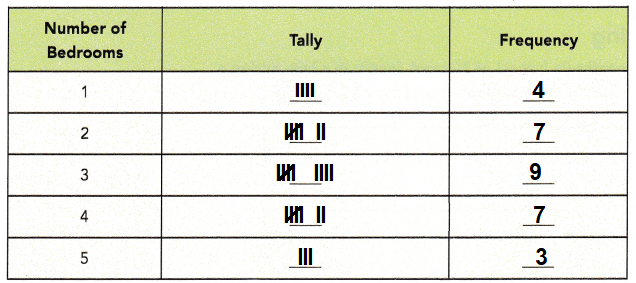
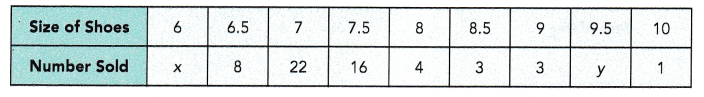
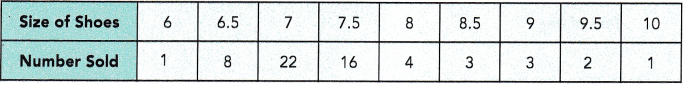
The table shows the results of a survey to find the number of television sets in 50 randomly chosen homes.
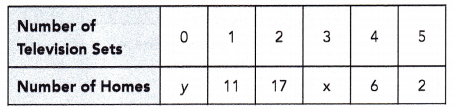
The total number of homes that have 0 or 1 television set is 15.
a) Find values of x and y. Then represent this set of data with a dot plot.
Answer:
x = 10
y = 4
Explanation:
The total number of homes that have 0 or 1 television set is 15.
y + 11 = 15
y = 4
total no of houses = 50
4 + 11 + 17 + x + 6 + 2 = 50
40 + x = 50
x = 10
b) Find the mean, median, and mode of the data set.
Answer:
Mean = 2.18
Median = 2
Mode = 2
Explanation:
mean = (0 x 4) + (1 x 11) + (2 x 17) + (3 x 10) + (4 x 6) + (5 x 2) ÷ 50
(11 + 34 + 30 + 24 + 10) ÷ 50
109 ÷ 50
Mean = 2.18
Median = no of houses ÷ 2 = 25
4 + 11 + 10 = 25
so the 25th home lies in the 17 homes which have 2 TV’s
Median = 2
Mode = 2
most of the houses have 2 TV’s
c) Briefly describe the data distribution and relate the measure of center to the shape of the dot plot.
Answer:
The given table shows the results of a survey to find the number of television sets in 50 randomly.
Histogram drawn using the intervals from the data in the table as shown in the above table.
Number of homes is on x-axis and number of televisions on y-axis.
Most of the data values are to the right of the interval only 1,
The shape of the histogram is right skewed.
d) A similar survey is carried out on another 30 randomly chosen homes and the mean number of television sets is found to be 1.9. If the two data sets are combined, find the mean number of television sets in the combined data set.
Answer:
Mean = 2.04
Explanation:
50 randomly chosen homes and the mean number of television sets is found to be 2.18.
30 randomly chosen homes and the mean number of television sets is found to be 1.9.
the mean number of television sets in the combined data set.
(2.18 + 1.9) ÷ 2
Mean = 2.04