This handy Math in Focus Grade 6 Workbook Answer Key Chapter 14 Lesson 14.3 Mode detailed solutions for the textbook questions.
Math in Focus Grade 6 Course 1 B Chapter 14 Lesson 14.3 Answer Key Mode
Math in Focus Grade 6 Chapter 14 Lesson 14.3 Guided Practice Answer Key
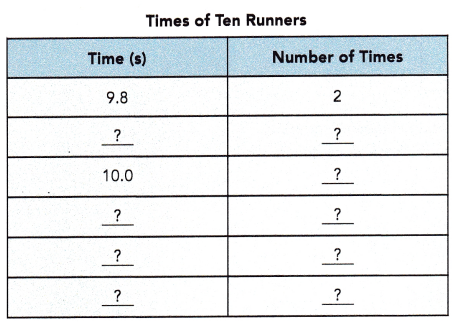
Use the data set to complete the table. Then complete the sentence.
Justin recorded the times for the ten runners on a track team when they ran the 100-meter dash. The data set shows the times that he recorded.
9.8 s, 9.9 s, 10.0 s, 9.9 s, 10.2 s, 10.1 s, 9.8 s, 10.3 s, 9.9 s, 10.1 s
Answer:
Explanation:
Given that,
Justin recorded the times for the ten runners on a track team when they ran the 100-meter dash. The data set shows the times that he recorded as..
9.8 s, 9.9 s, 10.0 s, 9.9 s, 10.2 s, 10.1 s, 9.8 s, 10.3 s, 9.9 s, 10.1 s
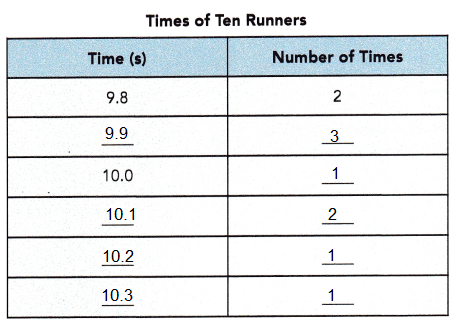
Number of times of ten runners are recorded in the table as shown above.
Question 1.
The mode of this data set is ![]() seconds.
seconds.
Answer:
9.9 seconds.
Explanation:
Mode is the value which occurs the maximum number of times in a given data set.
So, it is the third measure of the central tendency.
9.9s occurs the maximum number of times in a given data set.
Complete. Use data in the dot plot.
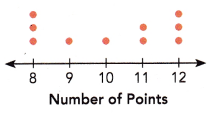
Elsie likes to bowl. The dot plot shows her scores for each of the ten frames that she bowled in one game. Each dot represents her scores for one frame.
Question 2.
Elsie scored 11 points in each of ![]() frames.
frames.
Answer:
2 frames.
Explanation:
A Dot Plot is a graphical display of data using dots.
As each dot represents her scores for one frame, there are 2 dots at 11 points.
So, Elsie scored 11 points in each of 2 frames.
Question 3.
The modes of this set of data are ![]() and
and ![]() .
.
Answer:
8, 12 are the modes.
Explanation:
The above dot plot shows her scores for each of the ten frames that she bowled in one game. Each dot represents her scores for one frame.
Mode is the value which occurs the maximum number of times in a given data set.
It is the third measure of the central tendency.
Three are 3 frames at 8 and three frames at the 12 point.
So, 3 is occurring more number of times.
Find the mode of each set of data.
Question 4.
There are 9 teachers, 88 boys, and 79 girls at a school camp.
Answer:
mode = boys.
Explanation:
Given that,
There are 9 teachers, 88 boys, and 79 girls at a school camp.
Mode is the value which occurs the maximum number of times in a given data set.
It is the third measure of the central tendency.
As boys are more number, which can see frequently more number of times.
So, in the above set of data boys are mode.
Question 5.
In a mall, there are 2 laundry shops, 14 garment shops, 3 photographic shops, 5 shoe shops, and 9 food stores.
Answer:
mode is garment shop.
Explanation:
Given that,
In a mall, there are 2 laundry shops, 14 garment shops, 3 photographic shops, 5 shoe shops, and 9 food stores.
Mode is the value which occurs the maximum number of times in a given data set.
It is the third measure of the central tendency.
As garment shops are more number, which can see frequently more number of times.
So, garment shop is mode.
Question 6.
The data set shows the masses of the school bags of some students.
5.5 kg, 6.6 kg, 4.8 kg, 4.3 kg, 5.5 kg, 4.3 kg, 5.5 kg, 6.6 kg, 4.5 kg, 5.5 kg
Answer:
mode is 5.5kg
Explanation:
Given that,
5.5 kg, 6.6 kg, 4.8 kg, 4.3 kg, 5.5 kg, 4.3 kg, 5.5 kg, 6.6 kg, 4.5 kg, 5.5 kg is to be written in the ascending order.
Mode is the value which occurs the maximum number of times in a given data set.
It is the third measure of the central tendency.
4.3, 4.3, 4.5, 4.8, 5.5, 5.5, 5.5, 5.5, 6.6, 6.6
So, 5.5 is more times observation is the mode of the given set of data.
Hands-On Activity
FINDING MEAN, MEDIAN, AND MODE
Materials:
- net of a rectangular prism, with pairs of opposite faces numbered 10, 11, or 12
- blank table
- tape
- scissors
- centimeter ruler
Work in pairs.
Step 1: Cut out, fold, and tape the net of the rectangular prism provided by your teacher.
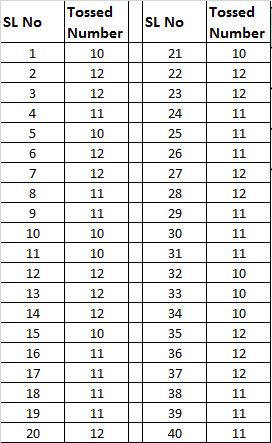
Step 2: Take turns to toss the rectangular prism 40 times and record the number tossed each time.
Step 3: Copy and complete your results in a table like the one below.
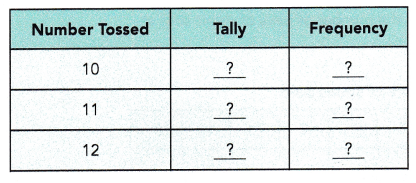
Step 4: From the set of data collected, find the
a) mean
b) median
c) mode.
Step 5:
a) Measure the area of each face to the nearest tenth of a square centimeter. Find the ratio of the total area of the faces numbered 10 to the total area of the faces numbered 11 to the total area of the faces numbered 12.
b) Find the ratio of the number of times the number 10 is tossed to the number of times the number 11 is tossed to the number of times the number 12 is tossed.
c) Compare the two ratios. Why do you think you get this result?
Step 6: Compare your findings with the other pairs.
Answer:
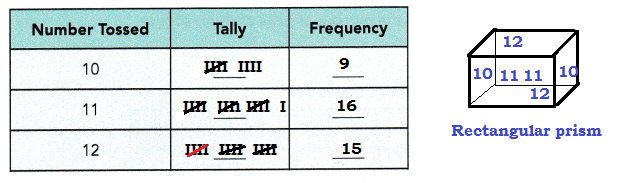
the ratio of the number of times the number 10 is tossed to the number of times the number 11 is tossed to the number of times the number 12 is tossed
10:11:12
9 : 16 : 15
Math in Focus Course 1B Practice 14.3 Answer Key
Find the mode or modes of each data set.
Question 1.
5, 6, 4, 5, 8, 9, 9, 3, 4, 5
Answer:
Mode : 5
Explanation:
Mode is the value which occurs the maximum number of times in a given data set.
It is the third measure of the central tendency.
Given 5, 6, 4, 5, 8, 9, 9, 3, 4, 5
The given data set is to be written in the ascending order.
3, 4, 4, 5, 5, 5, 6, 8, 9, 9
So, number 5 appears most frequently in the given set of data.
Question 2.
13, 31, 12, 45, 6, 19, 21, 12, 31
Answer:
12 and 31
Explanation:
Mode is the value which occurs the maximum number of times in a given data set.
It is the third measure of the central tendency.
Given 13, 31, 12, 45, 6, 19, 21, 12, 31
The given data set is to be written in the ascending order.
6, 12, 12, 13, 19, 21, 31, 31, 45
So,12 and 31 appears most frequently in the given set of data.
Question 3.
8.5, 6.5, 7.8, 6.5, 6.4, 2.3, 4.5, 5.4, 7.8, 5.5, 7.8
Answer:
7.8
Explanation:
Mode is the value which occurs the maximum number of times in a given data set.
It is the third measure of the central tendency.
Given 8.5, 6.5, 7.8, 6.5, 6.4, 2.3, 4.5, 5.4, 7.8, 5.5, 7.8
The given data set is to be written in the ascending order.
2.3, 4.5, 5.4, 5.5, 6.4, 6.5, 6.5, 7.8, 7.8, 7.8, 8.5
So, 7.8 appears most frequently in the given set of data.
Find the mode.
Question 4.
The scores of a basketball team in a series of games are 76, 85, 65, 58, 68, 72, 91, and 68. Find the mode.
Answer:
mode is 65
Explanation:
Mode is the value which occurs the maximum number of times in a given data set.
It is the third measure of the central tendency.
Given 76, 85, 65, 58, 68, 72, 91, and 68
arranging in the ascending order
58, 65, 68, 68, 72, 76, 85, 91
So, 68 appears most frequently in the given set of data.
Question 5.
The table shows sizes of shoes and the number of pairs of shoes sold at a shop last month.
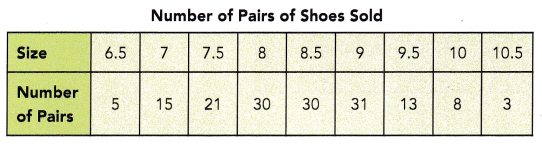
Find the mode.
Answer:
30
Explanation:
Mode is the value which occurs the maximum number of times in a given data set.
It is the third measure of the central tendency.
The above number of pairs of shoes sold are arranged in the ascending order as shown below.
3, 5, 8, 13, 15, 21, 30, 30, 31
In the above 9 observations of 30 is occurred more number of times.
So, mode = 30
Question 6.
Tickets for a concert are priced at $20, $30, $40, $50, or $100. The table shows the number of tickets sold at each price.
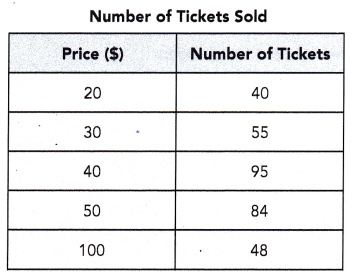
Find the mode.
Answer:
mode = 40
Explanation:
Mode is the value which occurs the maximum number of times in a given data set.
It is the third measure of the central tendency.
So, $40 is 95 tickets were sold, $40 appears most frequently.
Make a dot plot to show the data. Use your dot plot to answer each question.
The data set shows the number of goals scored by a soccer team in 17 matches. 3, 2, 1, 0, 2, 4, 1, 0, 2, 3, 4, 2, 3, 2, 1, 2, 5
Question 7.
What is the mean of the data set? Round your answer to the nearest number of goals.
Answer:
mean = 2
2 goals.
Explanation:
Given, 3, 2, 1, 0, 2, 4, 1, 0, 2, 3, 4, 2, 3, 2, 1, 2, 5
find the sum of the above data,
3+2+1+0+2+4+1+0+2+3+4+2+3+2+1+2+5 = 37
The mean = \(\frac{Sum of a set of items}{Number of items}\)
mean = \(\frac{3+2+1+0+2+4+1+0+2+3+4+2+3+2+1+2+5}{17}\)
mean = \(\frac{37}{17}\)
mean = 2.17
Round the answer to the nearest number of 2 goals.
Question 8.
What is the median of the data set?
Answer:
median =2
Explanation:
median: Middle value is the median of a given data set.
3, 2, 1, 0, 2, 4, 1, 0, 2, 3, 4, 2, 3, 2, 1, 2, 5
The above data is arranged in ascending order as shown below,
0, 0, 1, 1, 1, 2, 2, 2, 2, 2, 2, 3, 3, 3, 4, 4, 5
So, 2 in the middle of the order sequence is the median.
Question 9.
What is the mode of the data set?
Answer:
mode = 2
Explanation:
Mode is the value which occurs the maximum number of times in a given data set.
It is the third measure of the central tendency.
3, 2, 1, 0, 2, 4, 1, 0, 2, 3, 4, 2, 3, 2, 1, 2, 5
The above data is arranged in ascending order as shown below,
0, 0, 1, 1, 1, 2, 2, 2, 2, 2, 2, 3, 3, 3, 4, 4, 5
So, 2 appears most frequently in the given set of data.
Solve. Show your work.
Question 10.
A class of 15 students had a spelling test consisting of 10 words. The number of spelling mistakes made by each student in the class is listed in the data set.
1, 2, 1, 0, 3, 1, 2, 3, 1, 2, 0, 4, 2, 3, x
a) If there are two modes, what are the possible values for x?
Answer:
x = 0 and 4
Explanation:
Given, 1, 2, 1, 0, 3, 1, 2, 3, 1, 2, 0, 4, 2, 3, x
arrange the data in the ascending order,
0, 0, 1, 1, 1, 1, 2, 2, 2, 2, 3, 3, 3, 4, x
there are two modes,
As 1 and 2 appears most frequently in the given set of data.
So, the possible values of x is 0 and 4.
b) If there is exactly one mode, write a possible value for x, and the mode.
Answer:
1 or 2
Explanation:
Given set of data,
1, 2, 1, 0, 3, 1, 2, 3, 1, 2, 0, 4, 2, 3, x
arrange the data in the ascending order,
0, 0, 1, 1, 1, 1, 2, 2, 2, 2, 3, 3, 3, 4, 1
if the possible values for x = 1
As 1 appears most frequently in the given set of data,
mode is 1
if the possible values for x = 2
As 2 appears most frequently in the given set of data,
mode is 2.
Question 11.
The table shows the number of days of absences for 80 students in a school.
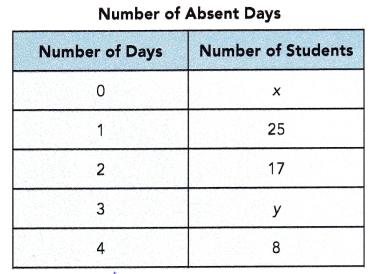
a) Find the value of x + y.
Answer:
30
Explanation:
As we know total number of students is 80 in the school.
x + 25 + 17 + y + 8 = 80
x + y = 80 – 50
x + y = 30
b) If the mode for this set of data is 3, write the possible values for the pair of numbers (x, y).
Answer:
(x, y)
Explanation:
x + 25 + 17 + y + 8 = 80
x + y = 80 – 50 = 30
we know total students are 80.
3 is mode, means y value should maximum value and x value should me minimum.
The sum of x + y = 30
(x, y) = (0, 30), (1, 29), (2, 28), (3, 27), (4, 26)
So, the possible values of the pair of numbers (x, y).
c) If the mode is equal to the median, write two possible values of x.
Answer:
25 and 27
Explanation:
median : Middle value is the median of a given data set.
x, 25, 17, y, 8
arrange the data in the ascending order,
8, 17, 25, x y
So, the possible numbers between are 16 to 24.
So, mode should be 25 and 17 if any one same numbers repeats.