This handy Math in Focus Grade 7 Workbook Answer Key Cumulative Review Chapters 9-10 detailed solutions for the textbook questions.
Math in Focus Grade 7 Course 2 B Cumulative Review Chapters 9-10 Answer Key
Concepts and Skills
Find the range, the three quartiles, and the interquartile range. (Lesson 9.1)
Question 1.
32, 65, 90, 25, 46, 81, 30, 57, 85, 104, 33, 48
Answer:
To calculate range follow the below steps:
1. List the elements of your data set.
2. Identify the highest and lowest numbers in the set.
3. Subtract the smallest number in your data set from the largest number.
4. Label the range clearly.
In the given set the highest number is 104
the lowest number is 25
Now subtract highest number-lowest number
104-25=79
therefore, the range is 79.
The three quartiles:
1. Order your data set from lowest to highest values
2. Find the median. This is the second quartile Q2.
3. At Q2 split the ordered data set into two halves.
4. The lower quartile Q1 is the median of the lower half of the data.
5. The upper quartile Q3 is the median of the upper half of the data.
the given data: 32, 65, 90, 25, 46, 81, 30, 57, 85, 104, 33, 48
write in ascending order:
25, 30, 32, 33, 46, 48, 57, 65, 81, 85, 90, 104
Now finding the median:
Q2=46, 48, 57, 65
Now add the middle values and divide by 2.
Q2=48+57/2
Q2=105/2
Q2=52.5
Now, look at the bottom half of the data. The median of this half is found between the second and fifth values:
25, 30, 32, 33, 46, 48
Thus the first quartile is found to equal Q1 = (32 +33)/2
Q1=65/2
Q1=32.5
To find the third quartile, look at the top half of the original data set. We need to find the median of:
57, 65, 81, 85, 90, 104
Here the median is (81 + 85)/2 = 83. Thus the third quartile Q3 = 83.
Interquartile range=Q3-Q1
Interquartile range=83-32.5
Interquartile range=50.5
Question 2.
12.6, 13.0, 15.5, 18.6, 14.4, 12.0, 11.0, 11.0, 15.6, 15.9
Answer:
11.0, 11.0, 12.0, 12.6, 13.0, 14.4, 15.5, 15.6, 15.9, 18.6
To calculate range follow the below steps:
1. List the elements of your data set.
2. Identify the highest and lowest numbers in the set.
3. Subtract the smallest number in your data set from the largest number.
4. Label the range clearly.
In the given set the highest number is 18.6
the lowest number is 11.0
Now subtract highest number-lowest number
18.6-11.0=7.6
therefore, the range is 7.6
The three quartiles:
1. Order your data set from lowest to highest values
2. Find the median. This is the second quartile Q2.
3. At Q2 split the ordered data set into two halves.
4. The lower quartile Q1 is the median of the lower half of the data.
5. The upper quartile Q3 is the median of the upper half of the data.
the given data: 12.6, 13.0, 15.5, 18.6, 14.4, 12.0, 11.0, 11.0, 15.6, 15.9
write in ascending order:
11.0, 11.0, 12.0, 12.6, 13.0, 14.4, 15.5, 15.6, 15.9, 18.6
Now finding the median:
Q2= 13.0, 14.4
Now add the middle values and divide by 2.
Q2=13.0+14.4/2
Q2=27.4/2
Q2=13.7
Now, look at the bottom half of the data. The median of this half is found between the second and fifth values:
11.0, 11.0, 12.0, 12.6, 13.0
Thus the first quartile is found to equal Q1 = 12.0
Q1=12.0
Note: If the size of the data set is odd, do not include the median when finding the first and third quartiles.
To find the third quartile, look at the top half of the original data set. We need to find the median of:
14.4, 15.5, 15.6, 15.9, 18.6
Here the median is 15.6. Thus the third quartile Q3 = 15.6.
Interquartile range=Q3-Q1
Interquartile range=15.6-12.0
Interquartile range=3.6
Find the mean absolute deviation. Round to the nearest hundredth. (Lesson 9.3)
Question 3.
103, 111, 150, 165, 192, 144, 144, 163, 121
Answer:
The mean absolute deviation (MAD) of a data set is the average distance between each data value and the mean.
Mean absolute deviation helps us get a sense of how “spread out” the values in a data set are.
Formula to calculate mean absolute deviation:
– Start by finding the mean of the data set.
– Find the absolute value of the difference between each data value and the mean.
– Find the sum of the absolute values and divide the sum by the number of data values.
the given values:
103, 111, 150, 165, 192, 144, 144, 163, 121
We’ll begin by finding the mean of the data set.
Mean: The word average mean middle or central point. Most of the time when we are required to calculate the average of a list of data we are supposed to calculate the ‘mean’ of the given data.
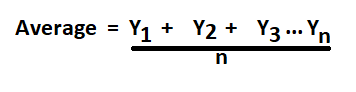
Formula to calculate average (mean) for ungrouped data:
Average is calculated by dividing the sum of the given data by the count of the same data.
n=9
Mean=103+111+150+165+192+144+144+163+121/9
Mean=1293/9
Mean=143.666666667
Mean=144
Then find the absolute value of the difference between each data value and the mean
1. |103-144|=41
2. |111-144|=33
3. |150-144|=6
4. |165-144|=21
5. |192-144|=48
6. |144-144|=0
7. |144-144|=0
8. |163-144|=19
9. |121-144|=23
Lastly, find the sum of the absolute values and divide by the number of the values.
MD=41+33+6+21+48+0+0+19+23/9
MD=191/2
MD=21.222
Question 4.
2.0, 3.2, 4.5, 5.6, 7.0, 7.9, 8.6, 9.1, 10.2, 12.3
Answer:
The mean absolute deviation (MAD) of a data set is the average distance between each data value and the mean.
Mean absolute deviation helps us get a sense of how “spread out” the values in a data set are.
Formula to calculate mean absolute deviation:
– Start by finding the mean of the data set.
– Find the absolute value of the difference between each data value and the mean.
– Find the sum of the absolute values and divide the sum by the number of data values.
the given values:
2.0, 3.2, 4.5, 5.6, 7.0, 7.9, 8.6, 9.1, 10.2, 12.3
We’ll begin by finding the mean of the data set.
Mean: The word average mean middle or central point. Most of the time when we are required to calculate the average of a list of data we are supposed to calculate the ‘mean’ of the given data.
Formula to calculate average (mean) for ungrouped data:
Average is calculated by dividing the sum of the given data by the count of the same data.
Average=X1+X2+…+Xn/n
n=10
Mean=2.0+3.2+4.5+5.6+7.0+7.9+8.6+9.1+10.2+12.3/10
Mean=70.4
Mean=7.04
Mean=7 (rounded to 100)
Then find the absolute value of the difference between each data value and the mean
1. |2.0-7|=5
2. |3.2-7|=3.8
3. |4.5-7|=2.5
4. |5.6-7|=1.4
5. |7.0-7|=0
6. |7.9-7|=0.9
7. |8.6-7|=1.6
8. |9.1-7|=2.1
9. |10.2-7|=3.2
10. |12.3-7|=5.3
Lastly, find the sum of the absolute values and divide by the number of the values.
MD=5+3.8+2.5+1.4+0+0.9+1.6+2.1+3.2+5.3/10
MD=25.8/10
MD=2.58
Use the information below to answer questions 5 to 10. (Lessons 9.1, 9.2)
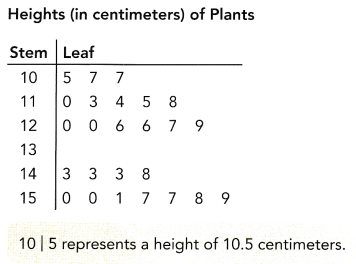
The heights of plants, in centimeters, are shown in a stem-and-leaf plot.
Question 5.
Find the range of the data.
Answer:
To calculate range follow the below steps:
1. List the elements of your data set.
2. Identify the highest and lowest numbers in the set.
3. Subtract the smallest number in your data set from the largest number.
4. Label the range clearly.
You can use a stem-and-leaf plot to figure out the range of a set of data. The range is the difference between the maximum score and the minimum score.
Let’s look at the above diagram:
The smallest number in the stem-and-leaf plot is 10.5. You can see that by looking at the first stem and the first leaf. The greatest number is the last stem and the last leaf on the chart. In this case, the largest number is 15.9
To find the range, subtract the smallest number from the largest number. This difference will give you the range.
15.9-10.5=5.4 cm
The range is 5.4 for this set of data.
Question 6.
Find the mode of the data.
Answer:
Mode: The mode is the value that appears most often in a set of data. The mode of a discrete probability distribution is the value x at which its probability mass function takes its maximum value. In other words, it is the value that is most likely to be sampled.
1. Now write the numbers in the data set:
{10.5, 10.7, 10.7, 11.0, 11.3, 11.4, 11.5, 11.8, 12.0, 12.0, 12.6, 12.6, 12.7, 12.9, 14.3, 14.3, 14.3, 14.8, 15.0, 15.0, 15.1, 15.7, 15.7, 15.8, 15.9}
2. Order the numbers from smallest to largest:
{10.5, 10.7, 10.7, 11.0, 11.3, 11.4, 11.5, 11.8, 12.0, 12.0, 12.6, 12.6, 12.7, 12.9, 14.3, 14.3, 14.3, 14.8, 15.0, 15.0, 15.1, 15.7, 15.7, 15.8, 15.9}
3. Count the number of times each number is repeated:
10.5 – 1; 10.7 – 2; 11.0 – 1; 11.3 – 1; 11.4 – 1; 11.5 – 1; 11.8 – 1; 12.0 – 2; 12.6 – 2; 12.7 – 1; 12.9 – 1; 14.3 – 3; 14.8 – 1; 15.0 – 2;
15.1 – 1; 15.7 – 2; 15.8 – 1; 15.9 – 1}
4. Identify the value(or values) that occur most often:
When you know how many times each value occurs in your data set, find the value that occurs the greatest number of times. This is your data set’s mode. Note that there can be more than one mode in a data set. If the two values are tied for being the most common values in the set, the data set can be said to be bimodal, whereas if three values are tied, the set is trimodal, and so on.
– In the above-given data set, 14.3 occurs more times than any other value, 14.3 is the mode.
– If a value besides 14.3 had also occurred three times, (like, for instance, if there were one more 15.0 in the data set), 14.3 and this other number would both be the mode.
Question 7.
Find the median height.
Answer:
Median: The median is the value separating the higher half of a data sample, a population, or a probability distribution, from the lower half. In simple terms, it may be thought of as the “middle” value of a data set.
The given data set:
{10.5, 10.7, 10.7, 11.0, 11.3, 11.4, 11.5, 11.8, 12.0, 12.0, 12.6, 12.6, 12.7, 12.9, 14.3, 14.3, 14.3, 14.8, 15.0, 15.0, 15.1, 15.7, 15.7, 15.8, 15.9}
The number of data set=25
Now divide the numbers bottom half and lower half.
{10.5, 10.7, 10.7, 11.0, 11.3, 11.4, 11.5, 11.8, 12.0, 12.0, 12.6, 12.6, 12.7, 12.9, 14.3, 14.3, 14.3, 14.8, 15.0, 15.0, 15.1, 15.7, 15.7, 15.8, 15.9}
– The bottom half is 12 and the lower half is 12.
– And the median is the middle number that is 12.7
Therefore, 12.7 is the median.
Question 8.
Find the mean height.
Answer:
Mean: The word average mean middle or central point. Most of the time when we are required to calculate the average of a list of data we are supposed to calculate the ‘mean’ of the given data.
Formula to calculate average (mean) for ungrouped data:
Average is calculated by dividing the sum of the given data by the count of the same data.
Average=X1+X2+…+Xn/n
n=25
Average=10.5+10.7+10.7+11.0+11.3+11.4+11.5+11.8+12.0+12.0+12.6+12.6+12.7+12.9+14.3+14.3+14.3+14.8+15.0+15.0+15.1+15.7+15.7+15.8+15.9/25
Average=410.8/25
Average (mean)=16.432
Question 9.
Calculate Q1 and Q3.
Answer:
The three quartiles:
1. Order your data set from lowest to highest values
2. Find the median. This is the second quartile Q2.
3. At Q2 split the ordered data set into two halves.
4. The lower quartile Q1 is the median of the lower half of the data.
5. The upper quartile Q3 is the median of the upper half of the data.
the given data: {10.5, 10.7, 10.7, 11.0, 11.3, 11.4, 11.5, 11.8, 12.0, 12.0, 12.6, 12.6, 12.7, 12.9, 14.3, 14.3, 14.3, 14.8, 15.0, 15.0, 15.1, 15.7, 15.7, 15.8, 15.9}
write in ascending order:
{10.5, 10.7, 10.7, 11.0, 11.3, 11.4, 11.5, 11.8, 12.0, 12.0, 12.6, 12.6, 12.7, 12.9, 14.3, 14.3, 14.3, 14.8, 15.0, 15.0, 15.1, 15.7, 15.7, 15.8, 15.9}
The second quartile Q2 is easy to find. It is the median of any data set and it divides an ordered data set into upper and lower halves.
The first quartile Q1 is the median of the lower half not including the value of Q2. The third quartile Q3 is the median of the upper half not including the value of Q2.
Data set divided for finding Q1: 10.5, 10.7, 10.7, 11.0, 11.3, 11.4, 11.5, 11.8, 12.0, 12.0, 12.6, 12.6
Q1=11.4+11.5/2
Q1=22.9/2
Q1=11.45
Q2 data set: 12.7, 12.9, 14.3, 14.3, 14.3, 14.8, 15.0, 15.0, 15.1, 15.7, 15.7, 15.8, 15.9
n=13 (odd); If the size of the data set is odd, do not include the median when finding the first and third quartiles.
Q3=15.0 cm
Question 10.
Find the interquartile range.
Answer:
The interquartile range IQR is the range in values from the first quartile Q1 to the third quartile Q3. Find the IQR by subtracting Q1 from Q3.
IQR=Q3-Q1
IQR=15.0-11.45
IQR=3.55
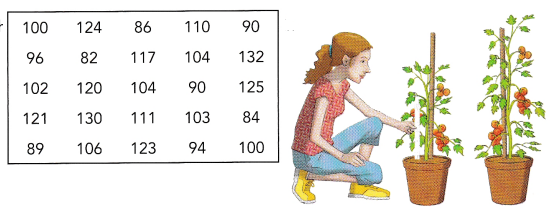
Use the following information to answer questions 11 to 14. (Lessons 9.1, 9.3)
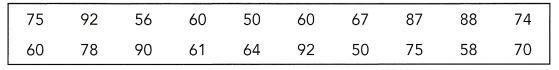
The history test scores of twenty students are tabulated below.
Question 11.
Find the range of the scores.
Answer:
To calculate range follow the below steps:
1. List the elements of your data set.
2. Identify the highest and lowest numbers in the set.
3. Subtract the smallest number in your data set from the largest number.
4. Label the range clearly.
The highest number is:92
The lowest number is: 50
range=highest number-lowest number
range=92-50
range=42
Question 12.
Find the 3 quartiles of the scores.
Answer:
the given data set: 75, 92, 56, 60, 50, 60, 67, 87, 88, 74, 60, 78, 90, 61, 64, 92, 50, 75, 58, 70.
1. Order your data set from lowest to highest values
2. Find the median. This is the second quartile Q2.
3. At Q2 split the ordered data set into two halves.
4. The lower quartile Q1 is the median of the lower half of the data.
5. The upper quartile Q3 is the median of the upper half of the data.
Now write in an ascending order:
50, 50, 56, 58, 60, 60, 60, 61, 64, 67, 70, 74, 75, 75, 78, 87, 88, 90, 92, 92.
Q2=67+70/2
Q2=137/2
Q2=68.5
The first quartile Q1 is the median of the lower half not including the value of Q2. The third quartile Q3 is the median of the upper half not including the value of Q2.
Now, look at the bottom half of the data.
50, 50, 56, 58, 60, 60, 60, 61, 64, 67
Q1=60+60/2
Q1=120/2
Q1=60
Thus the first quartile is found to equal Q1 = 60
Q3 data set: 70, 74, 75, 75, 78, 87, 88, 90, 92, 92
Q3=78+87/2
Q3=165/2
Q3=82.5
Thus the third quartile is found to equal Q3 = 82.5
Question 13.
Find the interquartile range of the scores.
Answer:
The interquartile range IQR is the range in values from the first quartile Q1 to the third quartile Q3. Find the IQR by subtracting Q1 from Q3.
IQR=Q3-Q1
IQR=82.5-60
IQR=22.5
Question 14.
Find the mean absolute deviation of the scores. Round to the nearest hundredth.
Answer:
The mean absolute deviation (MAD) of a data set is the average distance between each data value and the mean.
Mean absolute deviation helps us get a sense of how “spread out” the values in a data set are.
Formula to calculate mean absolute deviation:
– Start by finding the mean of the data set.
– Find the absolute value of the difference between each data value and the mean.
– Find the sum of the absolute values and divide the sum by the number of data values.
the given values:
50, 50, 56, 58, 60, 60, 60, 61, 64, 67, 70, 74, 75, 75, 78, 87, 88, 90, 92, 92.
We’ll begin by finding the mean of the data set.
Mean: The word average mean middle or central point. Most of the time when we are required to calculate the average of a list of data we are supposed to calculate the ‘mean’ of the given data.
Formula to calculate average (mean) for ungrouped data:
Average is calculated by dividing the sum of the given data by the count of the same data.
Average=x1+x2+…+x3/n
n=20
Mean=50+50+56+58+60+60+60+61+64+67+70+74+75+75+78+87+88+90+92+92/20
Mean=1407/20
Mean=70.35
Mean=70 (round to 100)
Then find the absolute value of the difference between each data value and the mean
|50-70| = 20
|50-70| = 20
|56-70| = 14
|58-70| = 12
|60-70| = 10
|60-70| = 10
|60-70| = 10
|61-70| = 9
|64-70| = 6
|67-70| = 3
|70-70| = 0
|74-70| = 4
|75-70| = 5
|75-70| = 5
|78-70| = 8
|87-70| = 17
|88-70| = 18
|90-70| = 20
|92-70| = 22
|92-70| = 22
Lastly, find the sum of the absolute values and divide by the number of the values.
MD=20+20+14+12+10+10+10+9+6+3+0+4+5+5+8+17+18+20+22+22/20
MD=235/20
MD=11.75
Use the data in the table to answer questions 15 to 17. (Lesson 9.3)
The table shows the speeds, ¡n miles per hour, of twelve vehicles.

Question 15.
Calculate Q1, Q2, and Q3.
Answer:
The given data set: 80, 65, 72, 58, 60, 70, 75, 68, 48, 51, 88, 90
1. Order your data set from lowest to highest values
2. Find the median. This is the second quartile Q2.
3. At Q2 split the ordered data set into two halves.
4. The lower quartile Q1 is the median of the lower half of the data.
5. The upper quartile Q3 is the median of the upper half of the data.
Now write in ascending order:
48, 51, 58, 60, 65, 68, 70, 72, 75, 80, 88, 90.
The second quartile Q2 is easy to find. It is the median of any data set and it divides an ordered data set into upper and lower halves.
Q2=68+70/2
Q2=138/2
Q2=69
Now calculate Q1 and Q3
The first quartile Q1 is the median of the lower half not including the value of Q2. The third quartile Q3 is the median of the upper half not including the value of Q2.
Q1 data set: 48, 51, 58, 60, 65, 68
Q1=58+60/2
Q1=118/2
Q1=59
Thus, the first quartile is found to equal Q1 = 59
Q3 data set: 70, 72, 75, 80, 88, 90
Q3=75+80/2
Q3=155/2
Q3=77.5
Thus, the third quartile is found to equal Q3 = 77.5
Question 16.
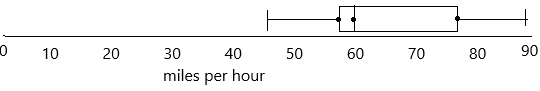
Draw a box plot of the speeds of the vehicles.
Answer:
The given data set: 80, 65, 72, 58, 60, 70, 75, 68, 48, 51, 88, 90
Now write in ascending order:
48, 51, 58, 60, 65, 68, 70, 72, 75, 80, 88, 90.
Q1=59, Q2=60, Q3=77.5
Question 17.
Calculate the mean absolute deviation of the speeds of vehicles. Round to the nearest hundredth.
Answer:
The mean absolute deviation (MAD) of a data set is the average distance between each data value and the mean.
Mean absolute deviation helps us get a sense of how “spread out” the values in a data set are.
Formula to calculate mean absolute deviation:
– Start by finding the mean of the data set.
– Find the absolute value of the difference between each data value and the mean.
– Find the sum of the absolute values and divide the sum by the number of data values.
the given values:
80, 65, 72, 58, 60, 70, 75, 68, 48, 51, 88, 90
We’ll begin by finding the mean of the data set.
Mean: The word average mean middle or central point. Most of the time when we are required to calculate the average of a list of data we are supposed to calculate the ‘mean’ of the given data.
Formula to calculate average (mean) for ungrouped data:
Average is calculated by dividing the sum of the given data by the count of the same data.
Average=x1+x2+…+x3/n
n=12
Mean=80+65+72+58+60+70+75+68+48+51+88+90/12
Mean=825/12
Mean=68.75
Mean=69 (round to nearest 100)
Then find the absolute value of the difference between each data value and the mean
|80-69| = 11
|65-69| = 4
|72-69| = 3
|58-69| = 11
|60-69| = 9
|70-69| = 1
|75-69| = 6
|68-69| = 1
|48-69| = 21
|51-69| = 18
|88-69| = 19
|90-69| = 21
Lastly, find the sum of the absolute values and divide by the number of the values.
MD=11+4+3+11+9+1+6+1+21+18+19+21/12
MD=125/12
MD=10.41
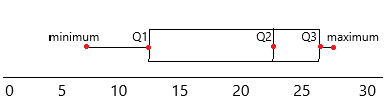
Use the box plot to answer questions 18 to 20 (Lesson 9.3)
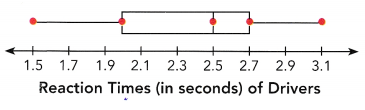
The box plot below summarizes the reaction times, in seconds, of 300 drivers in an experiment.
Question 18.
State the 5-point summary.
Answer:
– When we display the data distribution in a standardized way using 5 summary – minimum, Q1 (First Quartile), median, Q3(third Quartile), and maximum, it is called a Box plot.
– The method to summarize a set of data that is measured using an interval scale is called a box and whisker plot. These are the maximum used for data analysis.
– It does not show the distribution in particular as much as a stem and leaf plot or histogram does.
– In simple words, we can define the box plot in terms of descriptive statistics related concepts. That means box or whiskers plot is a method used for depicting groups of numerical data through their quartiles graphically.
– These may also have some lines extending from the boxes or whiskers which indicates the variability outside the lower and upper quartiles, hence the terms box-and-whisker plot and box-and-whisker diagram. Outliers can be indicated as individual points.
– It helps to find out how much the data values vary or spread out with the help of graphs. As we need more information than just knowing the measures of central tendency, this is where the box plot helps. This also takes less space. It is also a type of pictorial representation of data.
From the above-given box plot, we need to summarize the points.
according to the definition:
The first point represents the minimum, the point is 1.5
The second point represents Q1 (First Quartile), the Q1 point is 2.0
The third point represents Q2 (Median), the Q2 point is 2.5
The fourth point represents Q3 (third quartile), the Q3 point is 2.7
The fifth point represents the maximum, Thus the maximum point is 3.1
Question 19.
How many drivers have reaction time more than 2 seconds?
Answer: 225 drivers.
Question 20.
If a driver with reaction time less than 2 seconds is considered fast, how many drivers are fast?
Answer:
Solve. Show your work. (Lesson 9.5)
Question 21.
Six random samples of inner diameters, in millimeters, of metal pipes were collected. The sample means are 112, 103.5, 98.4, 106.2, 110, and 99.7. Use the 6 sample means to generate a mean length to estimate the population mean diameter of the pipes. Round your answer to the nearest tenth.
Answer:
The given sample means are 112, 103.5, 98.4, 106.2, 110, and 99.7
Mean length=112+103.5+98.4+106.2+110+99.7/6
Mean length=629.8/6
Mean length=104.96
Therefore, mean length=105 mm (round to nearest 10).
Question 22.
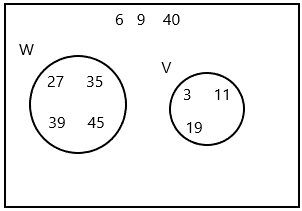
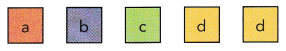
A bag contains 5 red cards, 4 yellow cards, and 7 blue cards. A card is randomly drawn from the bag. (Lessons 10.1, 10.2)
a) How many outcomes are in the sample space?
Answer:
The total number of cards=16 cards.
The number of red cards=5
The number of yellow cards=4
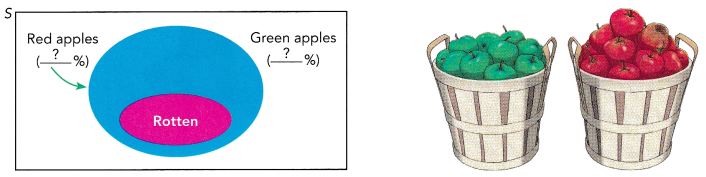
The number of blue cards=7
A sample space is a collection of a set of possible outcomes of a random experiment. The sample space is represented using the symbol, “S”. The subset of possible outcomes of an experiment is called events. A sample space may contain a number of outcomes that depends on the experiment. If it contains a finite number of outcomes, then it is known as discrete or finite sample spaces.
The outcomes are {R, R, R, R, R, Y, Y, Y, Y, B, B, B, B, B, B, B}
the number of possibles is 16
b) If X is the event of drawing a card which is not yellow, what are the outcomes favorable to X?
Answer:
If not drawing yellow means then there is the chance of taking blue and red
The possible outcome of event x is { R, R, R, R, R, B, B, B, B, B, B, B}
c) Find P(X).
Answer:
This formula is the number of favourable outcomes to the total number of all the possible outcomes that we have already decided in the Sample Space.
The probability of an Event = (Number of favourable outcomes) / (Total number of possible outcomes)
P(A) = n(E) / n(S)
P(A) < 1
Here, P(A) means finding the probability of an event A, n(E) means the number of favourable outcomes of an event and n(S) means the set of all possible outcomes of an event.
The possible outcome of event x is { R, R, R, R, R, B, B, B, B, B, B, B}
the total number of possible outcomes=16
the favourable outcomes=12
P(X)=n(E)/n(S)
P(X)=12/16
P(X)=3/4
P(X)=0.75
Therefore, the probability of event X is 0.75
d) If Y is the event of drawing a blue card, what does the complement of Y mean?
Answer:
If the probability of occurring an event is P(A) then the probability of not occurring an event is
P(A’) = 1- P(A)
P(Y)=7/16
The number of favourable outcomes is 7
We need to find out the not occurring of an event.
The complement of event Y is:
P(Y’)=1-P(Y)
P(Y’)=1-7/16
P(Y’)=16-7/16
P(Y’)=9/16
P(Y’)=0.5
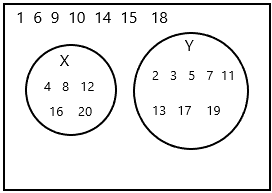
Question 23.
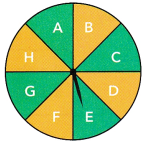
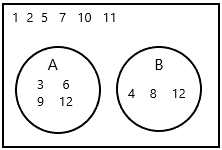
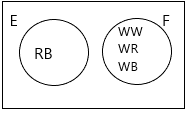
The numbers in the Venn diagram indicate the number of outcomes favorable to the events. For example, there are 12 outcomes favorable to event A. (Lesson 10.2)
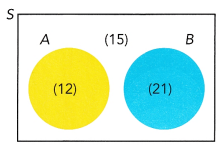
a) What is the total number of possible outcomes?
Answer: 48
Explanation:
The number of outcomes to event A=12
The number of outcomes to event B=21
the number of outcomes that are not event A and event B=15
Now add all the outcomes=12+21+15
The total number of possible outcomes are 48.
b) Find P(A), P(B), and P(B’).
Answer:
This formula is the number of favourable outcomes to the total number of all the possible outcomes that we have already decided in the Sample Space.
The probability of an Event = (Number of favourable outcomes) / (Total number of possible outcomes)
P(A) = n(E) / n(S)
P(A) < 1
Here, P(A) means finding the probability of an event A, n(E) means the number of favourable outcomes of an event and n(S) means the set of all possible outcomes of an event.
The total number of possible outcomes=48
The number of favourable outcomes of event A=12
P(A)=12/48
P(A)=1/4
The number of favourable outcomes of event B=21
P(B)=21/48
P(B)=7/16
If the probability of occurring an event is P(B) then the probability of not occurring an event is
P(B’) = 1- P( B)
Here we know P(B) is 7/16, then we can find the complement of B.
P(B’)=1-7/16
P(Y’)=16-7/16
P(Y’)=9/16
P(Y’)=0.5
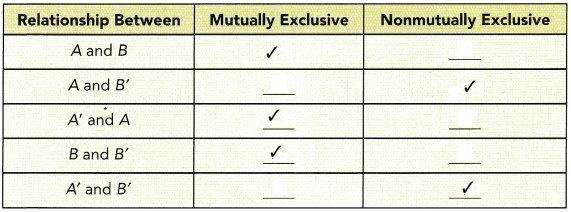
c) Copy and complete the table.
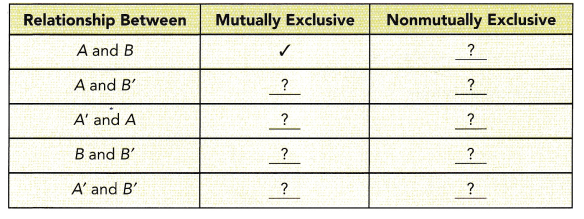
Answer:
The number of outcomes to event A=12
The number of outcomes to event B=21
the number of outcomes that are not event A and event B=15
Now add all the outcomes=12+21+15
The total number of possible outcomes is 48.
Definition of Mutually Non-Exclusive Events: Two events A and B are said to be mutually non-exclusive events if both events A and B have at least one common outcome between them. The event of getting an ‘odd-face’ and the event of getting ‘less than 4’ occur when we get either 1 or 3.
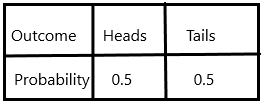
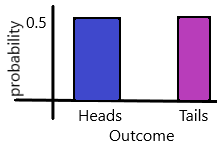
In logic and probability theory, two events (or propositions) are mutually exclusive or disjoint if they cannot both occur at the same time. A clear example is the set of outcomes of a single coin toss, which can result in either heads or tails, but not both.
according to the above definitions we can fill the table:
Question 24.
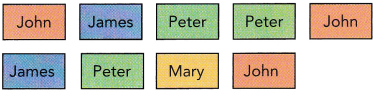
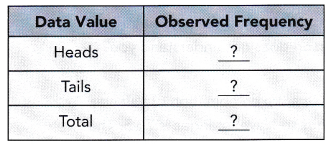
A coin is flipped repeatedly and the outcomes are HTTHHHTHTHTHTHHTHHTH. What is the experimental probability that the coin lands on heads when you flip the coin again? (Lesson 10.3)
Answer:
The total outcomes came when the coin was flipped repeatedly=20
The number of times coin lands on the head when the coin is flipped again=12
Experimental Probability is the probability of an event based on exact recordings or experiments of an event. The calculation is done by dividing the number of times an event occurred by the total number of trials in an experiment. We can express experimental probability mathematically as,
experimental probability=Number of times a particular event occurs/Number of total trails.
P(Heads)=12/20
P(Heads)=3/5
P(Heads0=0.6
Therefore, the experimental probability that the coin lands on heads when you flip the coin again is 0.6 or 3/5
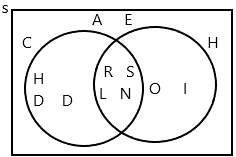
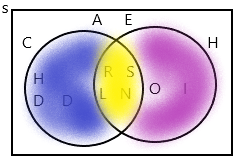
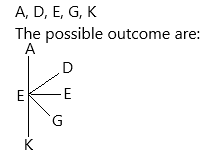
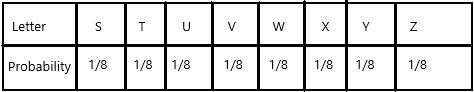
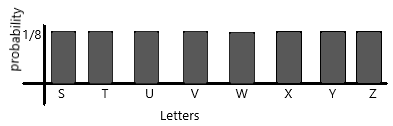
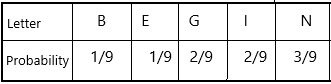
Question 25.
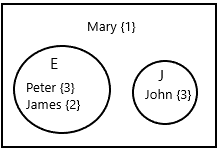
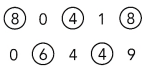
A spinner with outcomes A, E, O, and B is spun and the letter at which the arrow is pointing is recorded. After spinning the spinner several times, it generates the following outcomes: OABBBEAOOBAA. What is the experimental probability that the arrow points at a vowel if you spin the spinner again? (Lesson 10.3)
Answer:
Experimental Probability is the probability of an event based on exact recordings or experiments of an event. The calculation is done by dividing the number of times an event occurred by the total number of trials in an experiment. We can express experimental probability mathematically as
experimental probability=Number of times a particular event occurs/Number of total trails.
The total number of outcomes=12
The number of times a particular event occurs=8 (favourable outcomes of vowels)
According to the definition:
P(Vowels)=8/12
P(Vowels)=2/3
Problem Solving
Solve. Show your work.
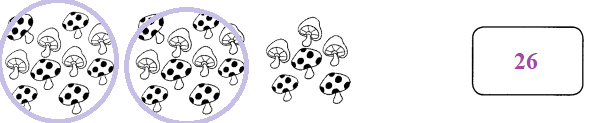
Question 26.
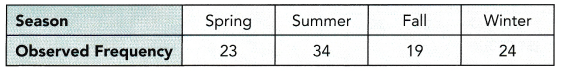
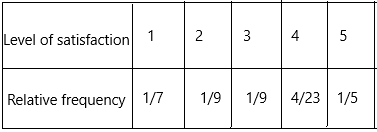
The table shows 100 responses on the level of satisfaction of a service. Customers evaluate their experiences, as 1 very dissatisfied, 2 somewhat dissatisfied, 3 neutral, 4 somewhat satisfied or 5 very satisfied. (Chapters 9, 10)
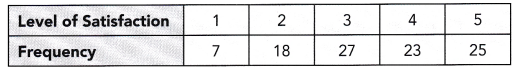
a) Find the lower quartile, median, and upper quartile.
Answer:
the given data set: 7, 18, 27, 23, 25.
1. Order your data set from lowest to highest values
2. Find the median. This is the second quartile Q2.
3. At Q2 split the ordered data set into two halves.
4. The lower quartile Q1 is the median of the lower half of the data.
5. The upper quartile Q3 is the median of the upper half of the data.
Now write in ascending order:
7, 18, 23, 25, 27
Q2=23
The first quartile Q1 is the median of the lower half not including the value of Q2. The third quartile Q3 is the median of the upper half not including the value of Q2.
Now, look at the bottom half of the data.
Q1=7+8/2
Q1=25/2
Q1=12.5
Thus the first quartile is found to equal Q1 = 12.5
Q3=25+27/2
Q3=52/2
Q3=26
Thus the third quartile is found to equal Q3 = 26
b) Draw a box plot of the level of satisfaction.
Answer:
– When we display the data distribution in a standardized way using 5 summary – minimum, Q1 (First Quartile), median, Q3(third Quartile), and maximum, it is called a Box plot.
– The method to summarize a set of data that is measured using an interval scale is called a box and whisker plot. These are the maximum used for data analysis.
c) If a customer’s response is randomly selected, what is the probability that the level of satisfaction is at least 4?
Answer:
The frequency of 4 and 5 are 23 and 25
The favourable outcomes are 2
The total outcomes are 23+25=48
This formula is the number of favourable outcomes to the total number of all the possible outcomes that we have already decided in the Sample Space.
The probability of an Event = (Number of favourable outcomes) / (Total number of possible outcomes)
P(A) = n(E) / n(S)
P(A) < 1
Here, P(A) means finding the probability of an event A, n(E) means the number of favourable outcomes of an event and n(S) means the set of all possible outcomes of an event.
P(satisfaction)=2/48
P(satisfaction)=1/24
In decimals, we can write as 0.04
Therefore, the probability that the level of satisfaction is at least 4 is 1/24 or 0.04
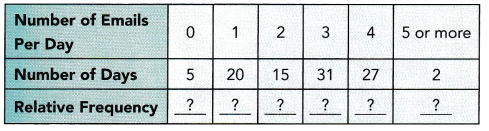
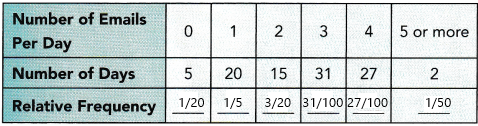
d) Construct a relative frequency table. Write each relative frequency as a percent.
Answer:
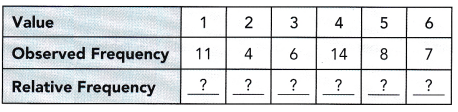
The number of times an event occurs is called a frequency. Relative frequency is an experimental one, but not a theoretical one. Since it is an experimental one, it is possible to obtain different relative frequencies when we repeat the experiments. To calculate the frequency we need
– Frequency count for the total population
– Frequency count for a subgroup of the population
We can find the relative frequency probability in the following way if we know the above two frequencies. The formula for a subgroup is;
Relative Frequency = Subgroup Count / Total Count
The relative frequency of very dissatisfied=1/7
The relative frequency of dissatisfied=2/18=1/9
The relative frequency of neutral=3/27=1/9
The relative frequency of somewhat satisfied=4/23
the relative frequency of very satisfied=5/25=1/5
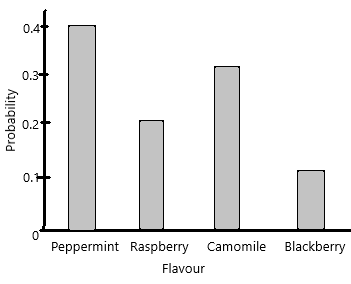
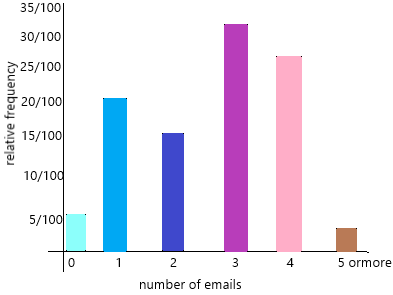
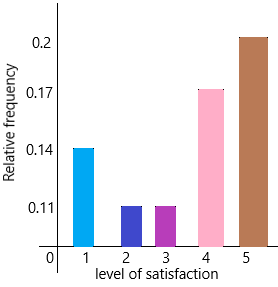
e) Present the relative frequency in a bar graph.
Answer:
The relative frequency of very dissatisfied=1/7=0.14
The relative frequency of dissatisfied=2/18=1/9=0.11
The relative frequency of neutral=3/27=1/9=0.11
The relative frequency of somewhat satisfied=4/23=0.17
the relative frequency of very satisfied=5/25=1/5=0.2
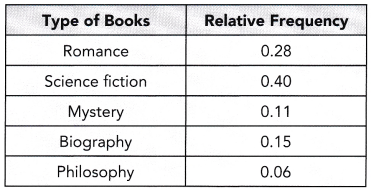
Question 27.
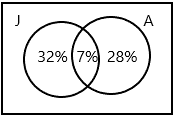
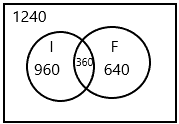
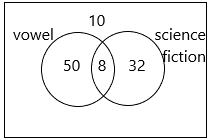
A survey was conducted on 100 randomly selected people about the types of books they usually read. The survey results show that 58 people read novels, 40 people read science fiction, and 10 people read neither. (Chapter 10)
a) Find the number of people surveyed who read both novels and science fiction.
Answer:8
The number of people who read novels is 58
The number of people who reads science fiction is 40
The number of people read none=10
Therefore, 100-10=90
The remaining people are 90.
If we subtract science fiction people from the remaining people then we get the people who read novels.
90-40=50
Thus, 50 people read novels.
But we have 58 people read the novel
: 58-50=8
8 people read both novels and science fiction.
So, a number of people who read only science fiction: 40-8=32.
b) Draw a Venn diagram to represent the different types of books read.
Answer:
A diagram used to represent all possible relations of different sets. A Venn diagram can be represented by any closed figure, whether it be a Circle or a Polygon (square, hexagon, etc.). But usually, we use circles to represent each set.
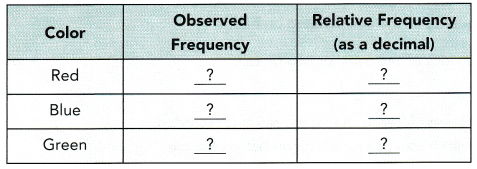
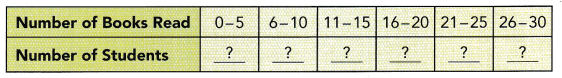
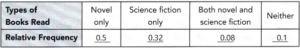
c) Copy and complete the following relative frequency table. Write each relative frequency as a decimal.
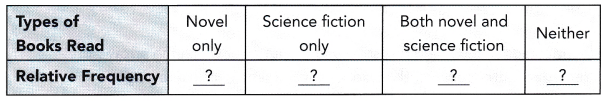
Answer:
relative frequency: We come across repetitive data in observation all the time. When repetitive data is given, then the number of times it has been in the observation is called its frequency. Relative frequency is the comparison between the number of times a number has been repeated to the total frequencies of all the numbers. Mathematically speaking, relative frequency is the division between the individual frequency of an item by the total number of repetition that has occurred.
The formula for the relative frequency is given as:
relative frequency=f/n
Here,
f is the number of times the data occurred in an observation
n = total frequencies
The relative frequency of reading novel=50/100=0.5
The relative frequency of science fiction=32/100=0.32
The relative frequency of both novel and science fiction=8/100=0.08
The relative frequency of reading neither=10/100=0.1
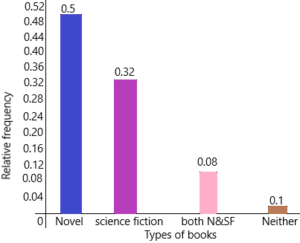
d) Draw a relative frequency bar graph using decimals.
Answer:
The line plot is a useful graph for examining small sets of data. It’s especially helpful as a device for learning basic statistical ideas. But for larger data sets, it can be awkward to create, since for each data value there is a corresponding dot. That’s a lot of dots for data sets with hundreds or thousands of values! You can, however, replace a line plot with a frequency bar graph.
e) If a person is randomly selected from this population to do the survey, what is the probability that the selected person reads novels?
Answer: 0.58
Explanation:
This formula is the number of favourable outcomes to the total number of all the possible outcomes that we have already decided in the Sample Space.
The probability of an Event = (Number of favourable outcomes) / (Total number of possible outcomes)
P(A) = n(E) / n(S)
P(A) < 1
Here, P(A) means finding the probability of an event A, n(E) means the number of favourable outcomes of an event and n(S) means the set of all possible outcomes of an event.
the number of people who read novels=58
The total number of people=100
P(novels)=58/100
P(novels)=0.58
Therefore, the probability is o.58
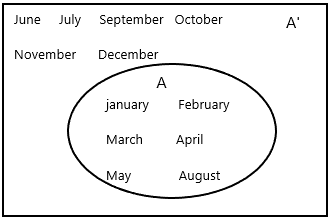
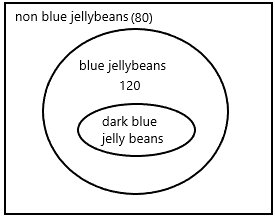
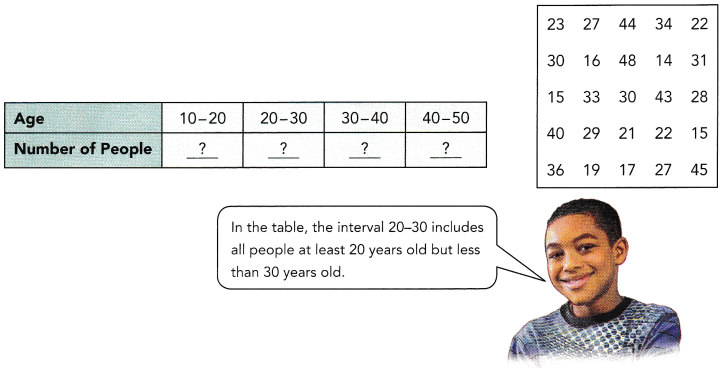
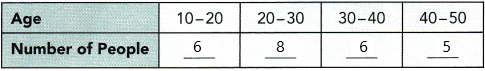
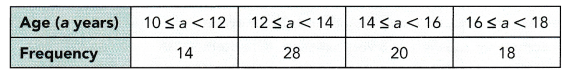
Question 28.
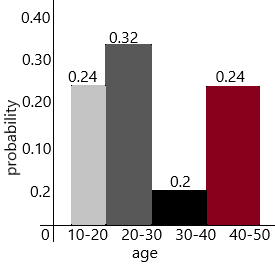
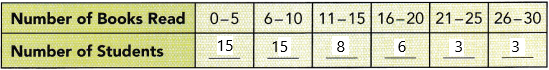
The table shows the number of children surveyed for each age group. (Chapter 10)
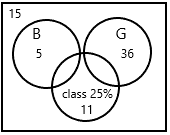
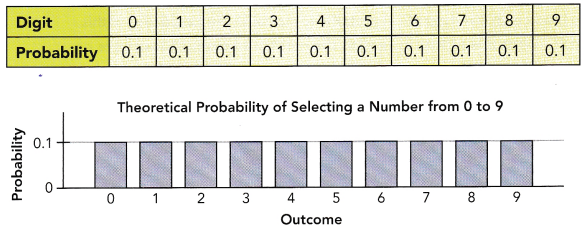
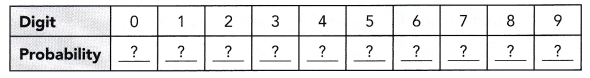
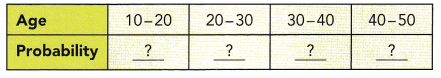
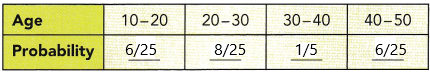
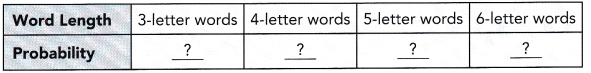
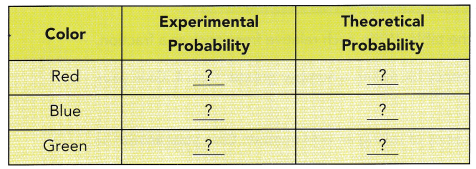
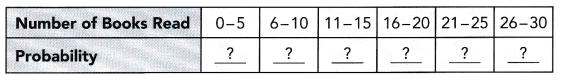
a) Construct a probability model. Express each probability of the age groups as a percent.
Answer:
A probability model is a mathematical representation of a random phenomenon. It is defined by its sample space, events within the sample space, and probabilities associated with each event. The sample space S for a probability model is the set of all possible outcomes.
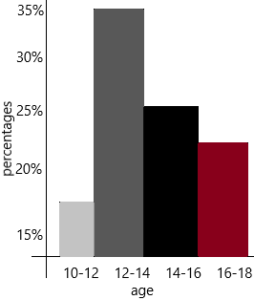
The probability 0f age group 10 to 12=14/80=0.175=17.5%
The probability of age group 12 to 14=28/80=0.35=35%
The probability of age group 14 to 16=20/80=0.25=25%
The probability of age group 16 to 18=18/80=0.225=22.5%
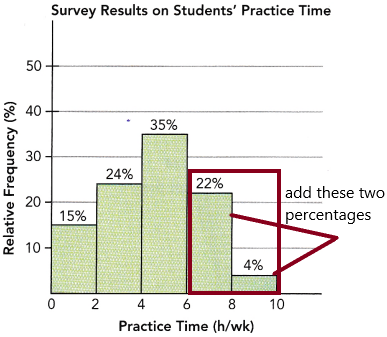
b) If a child is randomly selected, what is the probability that the selected child is at least 10 years old but not yet 14 years old?
Answer:
The probability 0f age group 10 to 12=14
The probability 0f age group 12 to 14=28
here asked the question that we need to find out the probability that the selected child is at least 10 years old but not yet 14 years old.
This formula is the number of favourable outcomes to the total number of all the possible outcomes that we have already decided in the Sample Space.
The probability of an Event = (Number of favourable outcomes) / (Total number of possible outcomes)
P(A) = n(E) / n(S)
P(A) < 1
Here, P(A) means finding the probability of an event A, n(E) means the number of favourable outcomes of an event and n(S) means the set of all possible outcomes of an event.
The number of favourable outcomes is 14+28=42
The total number of possible outcomes=80
P(age)=42/80
P(age)=0.525
Therefore, the probability is 0.525
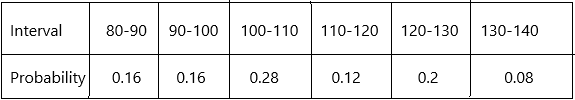
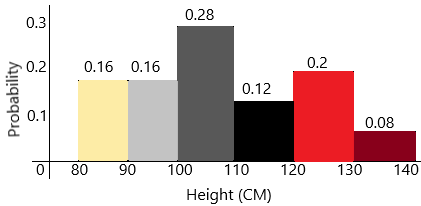
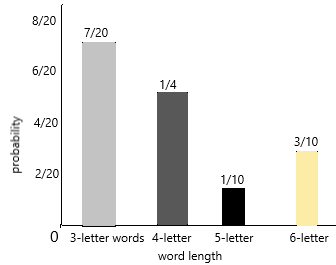
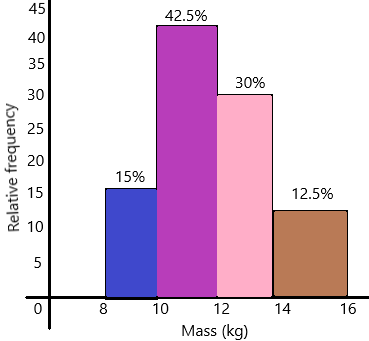
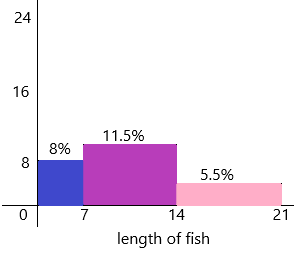
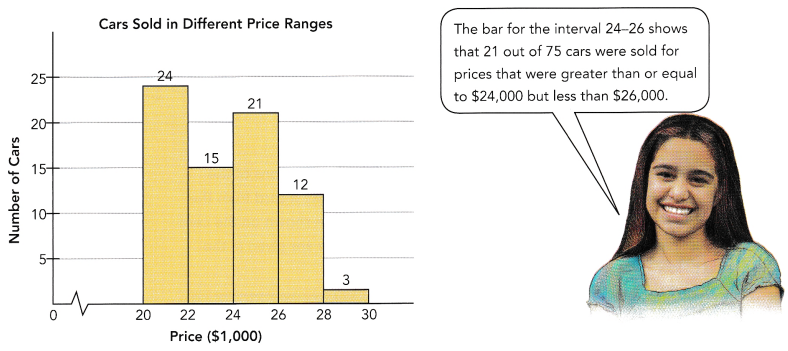
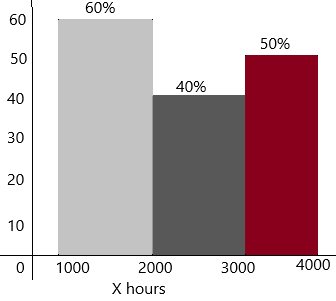
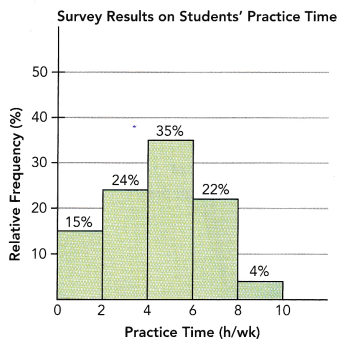
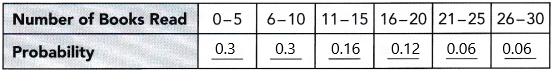
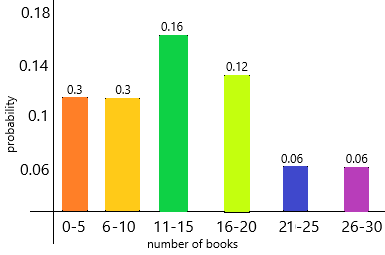
c) Display the probability distribution in a histogram using percent.
Answer:
Probability distribution yields the possible outcomes for any random event. It is also defined based on the underlying sample space as a set of possible outcomes of any random experiment. These settings could be a set of real numbers or a set of vectors or a set of any entities. It is a part of probability and statistics.
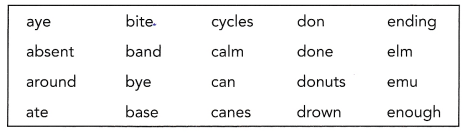
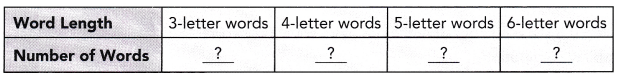
Question 29.
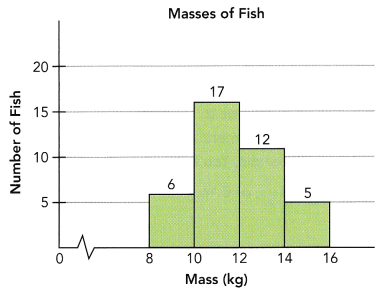
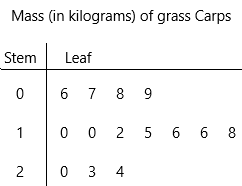
The data show the masses, in kilograms, of 14 grass carps. (Chapters 9, 10)
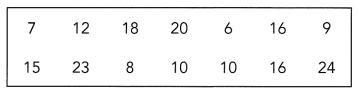
a) Construct a stem-and-leaf plot of the masses of the grass carps.
Answer:
Definition: The Stem and Leaf plot is a way of organizing data into a form that makes it easy to see the frequency of different values. In other words, we can say that a Stem and Leaf Plot is a table in which each data value is split into a “stem” and a “leaf.” The “stem” is the left-hand column that has the tens of digits. The “leaves” are listed in the right-hand column, showing all the ones digit for each of the tens, the twenties, thirties, and forties.
Remember that Stem and Leaf plots are a pictorial representation of grouped data, but they can also be called a modal representation. Because, by quick visual inspection at the Stem and Leaf plot, we can determine the mode.
Steps for making stem-and-leaf plot:
– First, determine the smallest and largest number in the data.
– Identify the stems.
– Draw a with two columns and name them as “Stem” and “Leaf”.
– Fill in the leaf data.
– Remember, a Stem and Leaf plot can have multiple sets of leaves.
By using the above-given data, we can make a stem-and-leaf plot:
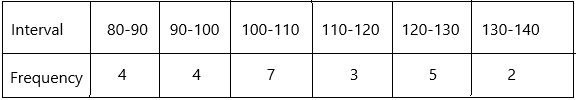
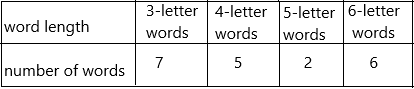
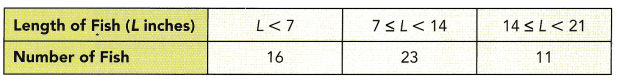
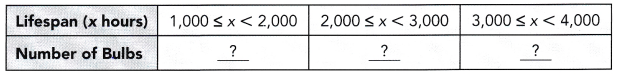
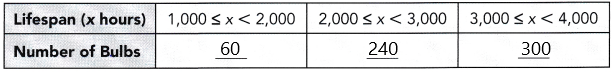
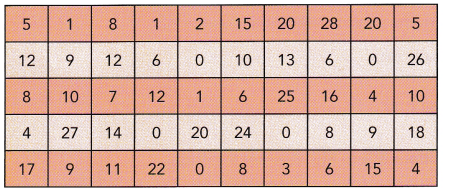
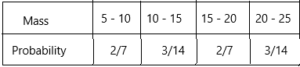
b) Make a frequency table. Group the data into 4 intervals: 5-10, 10-15, 15-20, and 20 — 25. Note: The interval 5 — 10 includes masses greater than or equal to 5 kilograms, but less than 10 kilograms.
Answer:
Frequency refers to the number of times an event or a value occurs. A frequency table is a table that lists items and shows the number of times the items occur. We represent the frequency by the English alphabet ‘f’.
Creating a frequency table:
Step 1: Make three columns. The first column carries the data values in ascending order (from lesser to large values).
Step 2: The second column contains the number of times the data value occurs using tally marks. Count for every row in the table. Use tally marks for counting.
Step 3: Count the number of tally marks for each data value and write it in the third column.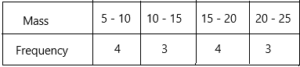
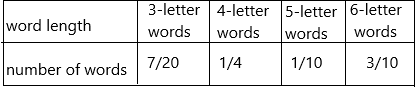
c) Draw a probability model. Give probabilities in fractions.
Answer:
A probability model is a mathematical representation of a random phenomenon. It is defined by its sample space, events within the sample space, and probabilities associated with each event. The sample space S for a probability model is the set of all possible outcomes.
– Identify every outcome.
– Determine the total number of possible outcomes.
– Compare each outcome to the total number of possible outcomes.
The probability of mass 5-10 is 4/14=2/7
The probability of mass 10-15 is 3/14
The probability of mass 15-20 is 4/14=2/7
The probability of mass 20-25 is 3/14
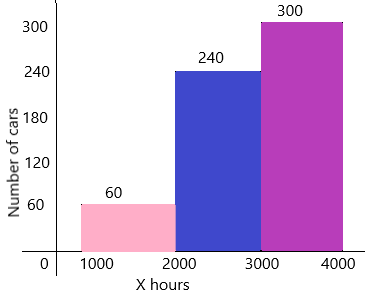
d) Present the probability distribution, in fractions, in a histogram.
Answer:
Probability distribution yields the possible outcomes for any random event. It is also defined based on the underlying sample space as a set of possible outcomes of any random experiment. These settings could be a set of real numbers or a set of vectors or a set of any entities. It is a part of probability and statistics.
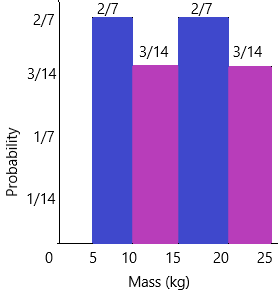
e) Is the model a uniform probability model? Explain your answer.
Answer: No, all possible outcomes do not have the same relative frequency.
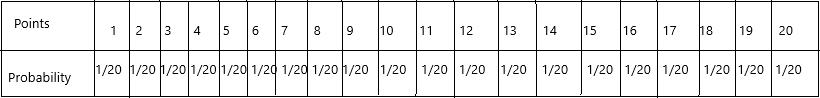
A discrete uniform probability distribution is one in which all elementary events in the sample space have an equal opportunity of occurring. As a result, for a finite sample space of size n, the probability of an elementary event occurring is 1/n. Uniform distributions are very common for initial studies of probability. The histogram of this distribution will look rectangular in shape.
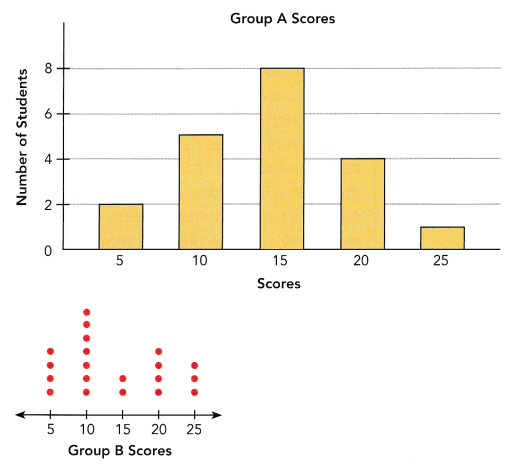
Question 30.
In a game, the scores given to each student are in multiples of 5 up to a maximum of 25. The bar graph and dot plot show the scores of Groups A and B, respectively. (Chapters 9, 10)
a) Calculate the mean score of each group.
Answer:
Mean: The word average mean middle or central point. Most of the time when we are required to calculate the average of a list of data we are supposed to calculate the ‘mean’ of the given data.
Formula to calculate average (mean) for ungrouped data:
Average is calculated by dividing the sum of the given data by the count of the same data.
Average=X1+X2+…+Xn/n
n=5
Finding mean for Group A:
The given data is 2, 5, 8, 4, 1
Mean=2+5+8+4+1/5
Mean=20/5
Mean of group A=4
Finding mean for group B:
The given data is 4, 7, 2, 4, 3
Mean=4+7+2+4+3/5
mean=20/5
Mean of group B=4
b) Calculate the mean absolute deviation of the scores of each group.
Answer:
The mean absolute deviation (MAD) of a data set is the average distance between each data value and the mean.
Mean absolute deviation helps us get a sense of how “spread out” the values in a data set are.
Formula to calculate mean absolute deviation:
– Start by finding the mean of the data set.
– Find the absolute value of the difference between each data value and the mean.
– Find the sum of the absolute values and divide the sum by the number of data values.
the given values of group A: 2, 5, 8, 4, 1
Mean=4
|2 – 4|=2
|5 – 4|=1
|8 – 4|=4
|4 – 4|=0
|1 – 4|=3
MAD=2+1+4+0+3/5
MAD=10/5
MAD of group A=2
The given values of group B: 4, 7, 2, 4, 3
Mean=4
|4 – 4|=0
|7 – 4|=3|
|2 – 4|=2
|4 – 4|=0
|3 – 4|=1
MAD=0+3+2+0+1/5
MAD=6/5
MAD of group B is 1.2
c) Which group’s scores deviate more about its mean score?
Answer:
The mean of group A is 4
The mean of group B is 4
The mean deviation of group A is 2
The mean deviation of Group B is 1.2
By comparing all these Group A score deviate is more.
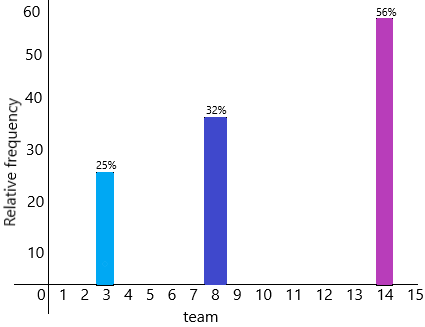
d) A randomly selected student from one of these groups has a score of 10 or 15. Which group is the student likely to be selected from? Explain your answer using probability.
Answer:
This formula is the number of favourable outcomes to the total number of all the possible outcomes that we have already decided in the Sample Space.
The probability of an Event = (Number of favourable outcomes) / (Total number of possible outcomes)
P(A) = n(E) / n(S)
P(A) < 1
Here, P(A) means finding the probability of an event A, n(E) means the number of favourable outcomes of an event and n(S) means the set of all possible outcomes of an event.
The number of students of 10 or 15 in group A is 5+8=13
the number of students 0f 10 or 15 in group B is 7+2=9
The favourable outcomes of group A are 13
The total number of students=20
P(Group A)=13/20
The favourable outcomes of group B are 9
The total number of students =20
P(Group B)=9/20
Question 31.
The table shows the place of origin of incoming freshman students at a university. (Chapter 9)
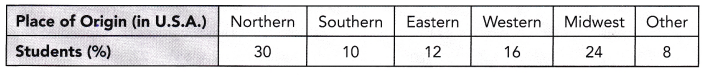
Describe how you would conduct a stratified random sampling of 500 of the 6,000 incoming freshman, considering the student distribution within their place of origins.
Answer:
Use the per cent to determine how many of the 500-student samples will be selected from each region. Then conduct a simple random sampling within each region. The total number of students sampled will be 500.