This handy Math in Focus Grade 7 Workbook Answer Key Chapter 10 Lesson 10.2 Finding Probability of Events detailed solutions for the textbook questions.
Math in Focus Grade 7 Course 2 B Chapter 10 Lesson 10.2 Answer Key Finding Probability of Events
Math in Focus Grade 7 Chapter 10 Lesson 10.2 Guided Practice Answer Key
Copy and complete. Solve.
Question 1.
You roll a fair number die.
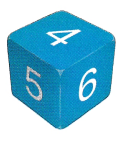
a) Find the probability of getting a four.
There are ![]() outcomes when you roll a number die. All the outcomes are equally likely.
outcomes when you roll a number die. All the outcomes are equally likely.
So, the probability of getting a four is ![]() .
.
Answer:6 outcomes; 1/6.
Explanation:
There are 6 possible outcomes: {1, 2, 3, 4, 5, 6}
For each number, we throw a dice once then the probability of getting each number is 1/6.
The probability of number 1 is 1/6
The probability of number 2 is 1/6
The probability of number 3 is 1/6
The probability of number 4 is 1/6
The probability of number 5 is 1/6
The probability of number 6 is 1/6.
b) Find the probability of getting a seven.
It is impossible to get a seven when you roll a standard number die.
So, the probability of getting a seven is ![]() .
.
Answer: 0
Explanation:
Yes, it is impossible to get seven when you roll a standard number die. In a rolling dice there will be no 7. Therefore, the probability of getting seven is 0.
Solve.
Question 2.
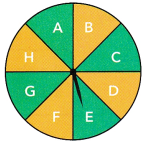
When you spin the spinner, what is the probability that the arrow will point to a number?
Answer: 0
Explanation:
Observe the spinner carefully,
In the spinner, all the sections are having alphabets only.
There are no numbers in the spinner. The arrow cannot show the number when we spin.
Complete.
Question 3.
Max has 4 short-sleeved shirts and 5 long-sleeved shirts in his closet. X is the event of Max randomly choosing a long-sleeved shirt. Find P(X). Express the probability as a fraction.

Event X has ![]() favorable outcomes.
favorable outcomes.
P(X) = \(\frac{\text { Number of outcomes favorable to event } X}{\text { Total number of equally likely outcomes }}\). Use the formula.
= ![]()
There are ![]() long-sleeved shirts out of 9 shirts.
long-sleeved shirts out of 9 shirts.
Answer:
The number of short-sleeved shirts=4
The number of long-sleeved shirts=5
The total number of shirts=4+5=9
Event X be choosing randomly long-sleeved shirts.
Event X=5
There are 5 long-sleeved shirts.
Here we need to find out the probability.
Formula:
The most common formula used to determine the likelihood of an event is given below:
probability=number of favourable events/total number of outcomes
P(X)=n(X)/n(S)
Where P(X)=probability
n(X)=number of favourable events
n(S)=total number of outcomes (shirts).
P(X)=5/9.
Therefore, the probability is 5/9.
Solve.
Question 4.
A box contains 28 pink ribbons and 12 green ribbons. You randomly take a ribbon from the box without looking. Find the probability of picking a pink ribbon. Express the probability as a percent.
Answer: 70%
Explanation:
The number of pink ribbons is there in a box=28
The number of green ribbons is there in a box=12
The total number of ribbons=28+12=40
The probability of finding of picking the pink ribbon=X
P(X)=n(X)/n(R)
P(X)=28/40
p(X)=0.7
Here asked that percentage. So we need to write the answer in percentage.
To find the probability of percentage:
Finally, take the answer you got and move the decimal point to the right two places or multiply the decimal by 100. Your answer will be the per cent probability that the desired outcome will take place.
Probability of percentage=0.7 x 100 = 70%
Therefore, the probability of percentage is 70%.
Question 5.
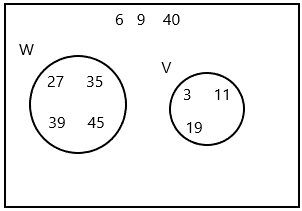
Ten cards have the following numbers printed on them: 3, 6, 9, 11, 19, 27, 35, 39, 40, and 45. A card is randomly drawn from the ten cards. Let W be the event of getting a number that is an odd number greater than 20. Let V be the event of getting a prime number.
a) List all the outcomes favourable to events W and V.
Answer:
Odd numbers: Odd numbers are the numbers that cannot be divided by 2 evenly. It cannot be divided into two separate integers evenly. If we divide an odd number by 2, then it will leave a remainder. The examples of odd numbers are 1, 3, 5, 7, etc.
Event W is the getting a number that is an odd number greater than 20
W={27, 35, 39, 45}
Prime numbers: A prime number is an integer, or whole number, greater than 1 that is only divisible by 1 and itself. In other words, a prime number only has two factors, 1 and itself.
Event V is the getting a prime number.
V= {3, 11, 9}
b) Draw a Venn diagram for the sample space and the two events. Place all possible outcomes in the Venn diagram.
Answer:
Venn diagram: Venn diagrams are the diagrams that are used to represent the sets, relation between the sets and operation performed on them, in a pictorial way. Venn diagram, introduced by John Venn (1834-1883), uses circles (overlapping, intersecting and non-intersecting), to denote the relationship between sets. A Venn diagram is also called a set diagram or a logic diagram showing different set operations such as the intersection of sets, the union of sets and the difference of sets. It is also used to depict subsets of a set.
Event W is getting a number that is an odd number greater than 20
W={27, 35, 39, 45}
Event V is getting a prime number.
V= {3, 11, 9}
representation of Venn diagram:
c) Are events Wand V mutually exclusive? Explain.
Answer: Yes, W and V events are mutually exclusive. Because they are disjoint sets.
Explanation:
Mutually exclusive: In probability theory, two events are said to be mutually exclusive if they cannot occur at the same time or simultaneously. In other words, mutually exclusive events are called disjoint events. If two events are considered disjoint events, then the probability of both events occurring at the same time will be zero.
If A and B are the two events, then the probability of disjoint of event A and B is written by:
Probability of Disjoint (or) Mutually Exclusive Event = P ( A and B) = 0.
If A and B are mutually exclusive events then its probability is given by P(A Or B) or P (A U B).
d) Find P(W) and P(V).
Answer:2/5; 3/10
The above-given numbers: 3, 6, 9, 11, 19, 27, 35, 39, 40, and 45.
Event W is getting a number that is an odd number greater than 20
W={27, 35, 39, 45}
P(W)=N(W)/N(T)
P(W)=4/10
P9W)=2/5
Event V is getting a prime number.
V= {3, 11, 9}
P(V)=N(V)/N(T)
P(V)=3/10
Question 6.
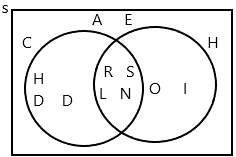
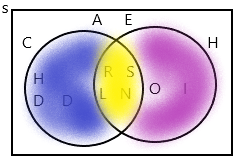
A letter is selected at random from the state name RHODE ISLAND. Let C be the event of getting a consonant. Let H be the event of getting a letter that comes after H in the alphabet.
a) Draw a Venn diagram for the sample space and the two events. Place all possible outcomes in the Venn diagram.
Answer:
Explanation:
Event C is getting a consonant.
Consonants are R, H, D, S, L, N
Vowels are A, E, I, O
Event H be the getting a letter that comes after H in the alphabet.
H after the alphabets are I, O
Note: A ∩ B = B ∩ A
b) Are events C and H mutually exclusive? Explain.
Answer: No, C and H are not mutually exclusive because they overlapped each other.
Two sets are said to be joint sets when they have at least one common element.
c) Find P(C) and P(H).
Answer:7/11;6/11
Explanation:
The above-given word: RHODE ISLAND
The total number of letters in a word=11
The number of consonants= 7
P(C)=N(C)/N(T)
P(C)=7/11
Event H be the getting a letter that comes after H in the alphabet.
P(H)=N(H)/N(T)
P(H)=6/11.
Question 7.
You randomly choose a month from the twelve months in a year. Let A be the event of randomly choosing a month that has the letter a in its name.
a) Draw a Venn diagram to represent events A and A’. Give the meaning of event A’, the complement of event A.
Answer:
Venn diagram: Venn diagrams are the diagrams that are used to represent the sets, relation between the sets and operation performed on them, in a pictorial way. Venn diagram, introduced by John Venn (1834-1883), uses circles (overlapping, intersecting and non-intersecting), to denote the relationship between sets. A Venn diagram is also called a set diagram or a logic diagram showing different set operations such as the intersection of sets, the union of sets and the difference of sets. It is also used to depict subsets of a set.
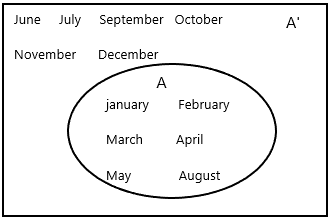
A={January, February, March, April, May, August]
A’={June, July, September, October, November, December}
A’ is the complement of A. This represents elements that are neither in set A.
A’ represents the months are having without letter ‘a’.
b) What outcomes are favourable to event A’?
Answer:
A’={June, July, September, October, November, December}
A’ is the complement of A. This represents elements that are neither in set A.
c) Find P(A) and P(A’).
Answer:
Probability means possibility. It is a branch of mathematics that deals with the occurrence of a random event. The value is expressed from zero to one. Probability has been introduced in Maths to predict how likely events are to happen. The meaning of probability is basically the extent to which something is likely to happen. This is the basic probability theory, which is also used in the probability distribution, where you will learn the possibility of outcomes for a random experiment. To find the probability of a single event to occur, first, we should know the total number of possible outcomes.
The formula for probability: The probability formula is defined as the possibility of an event to happen is equal to the ratio of the number of favourable outcomes and the total number of outcomes.
probability of an event to happen P(E)=number of favourable events/total number of outcomes.
A be the event of randomly choosing a month that has the letter ‘a’ in its name.
P(A)=N(A)/N(T)
P(A)=6/12
P(A)=1/2
A’ is the event having no letter in the month that is choosen.
P(A’)=N(A’)/N(T)
P(A’)=6/12
P(A’)=1/2.
Complete.
Question 8.
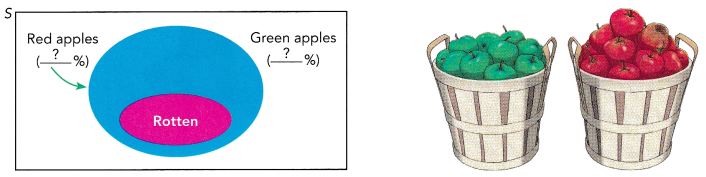
40% of the apples in an orchard are green and the rest of the apples are red. 5% of the red apples are rotten.
a) Copy the Venn diagram to represent the information.
Answer:
The above-given question:
Assume the total apples percentage=100%
The percentage of green apples=40%
The percentage of red apples=100-40=60%
The percentage of red apples are rotten=5%
According to the Venn diagram:
Therefore, the red apples are 60%
the green apples are 40%
b) If you pick an apple at random in the orchard, what is the probability the apple you pick is red that is not rotten? Give your answer as a decimal and as a percent.
Of all the red apples, ![]() of them are not rotten.
of them are not rotten.
![]() of 60% =
of 60% = ![]() • 0.60 Write percents as decimals and multiply.
• 0.60 Write percents as decimals and multiply.
= ![]() Simplify.
Simplify.
= ![]() % Write as a percent.
% Write as a percent.
The probability of picking a red apple that is not rotten is ![]() .
.
Answer: 57%
Of all the red apples 95 of them are not rotten.
In simplification:
95 of 60%
=95*60/100
=57%
Solve.
Question 9.
Among the 200 jellybeans in a bag, 3 out of every 5 are blue jellybeans. The blue jellybeans consist of light blue ones and dark blue ones in the ratio 2:1.
a) Draw a Venn diagram to represent the information.
Answer:
Venn diagrams are the diagrams that are used to represent the sets, relation between the sets and operation performed on them, in a pictorial way. Venn diagram, introduced by John Venn (1834-1883), uses circles (overlapping, intersecting and non-intersecting), to denote the relationship between sets. A Venn diagram is also called a set diagram or a logic diagram showing different set operations such as the intersection of sets, the union of sets and the difference of sets. It is also used to depict subsets of a set.
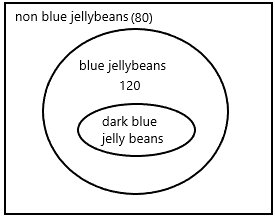
The total number of jellybeans=200
In that every 5 jellybeans we have 3 blue jellybeans. from this, we can write the number of jellybeans.
Divide 200/5=40
And multiply 3 by 40.
40*3=120.
Therefore, the number of blue jellybeans=120.
The rest of the bags means which are not blue=200-120=80.
b) What fraction of the jellybeans are light blue?
Answer:2/5
Explanation:
The ratio is already given=2:1
The light blue jellybeans ratio is 2
The dark blue jellybeans ratio is 1
We are taking 5 bags every time in that every 3 bags is blue colour only.
According to the question, the light blue was asked.
So the light blue ratio is 2 and the total is 5.
Therefore, the fraction of the light blue jellybeans is 2/5.
c) If you pick a jellybean randomly from the bag, what is the probability that a jellybean that is light blue is selected? Give your answer as a decimal.
Answer:0.4
Explanation:
The ratio is already given=2:1
The light blue jellybeans ratio is 2
The dark blue jellybeans ratio is 1
We are taking 5 bags every time in that every 3 bags is blue colour only.
According to the question, the light blue was asked.
So the light blue ratio is 2 and the total is 5.
Therefore, the fraction of the light blue jellybeans is 2/5.
P(A)=N(A)/N(T)
P(A)=2/5
P(A)=0.4
Therefore, the probability is 0.4
Math in Focus Course 2B Practice 10.2 Answer Key
Solve.
Question 1.
You roll a fair number die with faces labeled 1 to 6.
a) What is the probability of rolling an odd number?
Answer:
Probability when a dice is rolled:
total number of possible outcomes=6 (1, 2, 3, 4, 5, 6)
Probability of having 1 on the roll-up of dice:
Occurrence of 1 on top of dice/ Total number of possible outcomes of dice
= 1/6
Each of the outcomes of the dice has an equal probability of 1/6. Each outcome is equally likely to come on the top when the dice is rolled. Hence, the rolling of dice can be considered to be a fair probability scenario.
The odd numbers present on the die is 1, 3, 5
Therefore, out of the 6 total occurrences, the possible outcomes are 3.
Probability of obtaining an odd number = 3/6 = 1/2.
b) What is the probability of rolling a number less than 3?
Answer: 1/3
The probability of rolling a number less than 3 (so, 1 or 2) is 2 out of 6, or 1/3
Therefore, out of the 6 total occurrences, the possible outcomes are 2
Probability of obtaining a number less than 3=2/6=1/3.
c) What is the probability of rolling a prime number?
Answer:
total numbers that can occur=1, 2, 3, 4, 5, 6
Prime numbers that can occur in a roll=2, 3, 5
Total sample space n=6
Total favourable cases= m=3
P(prime number)=m/n=3/6
P(prime number)=1/2
therefore, the probability of rolling a prime number=1/2.
d) What is the probability of rolling a number greater than 1?
Answer:5/6
The total numbers that can occur=1, 2, 3, 4, 5, 6
The numbers that can occur in a roll that are greater than 1=2, 3, 4, 5, 6
The total sample space n =6
Total favourable cases= m = 5
P(greater than 1)=m/n=5/6
Therefore, the probability of rolling a dice greater than 1 is 5/6.
Question 2.
Abigail randomly chooses a disk from 6 green, 4 black, 2 red, and 2 white disks of the same size and shape.
a) What is the probability of getting a red disk?
Answer:
The total number of disks= n =6+4+2+2=14
The favourable cases=m=2
P(red disk)=m/n=2/14
P(red disk)=1/7
Therefore, the probability of getting a red disk=1/7.
b) What is the probability of not getting a green or white disk?
Answer:
The total number of disks= n =6+4+2+2=14
The number of disks that are green=6
The number of disks that are white=2
The disks that are not getting=m =6+2=8
P(not getting)=m/n
P(not getting)=8/14
P(not getting)=4/7
therefore, the probability of not getting green and white disks are 4/7.
c) What is the probability of getting a black disk?
Answer:
The total number of disks= n =6+4+2+2=14
The favourable cases=m=4
P(black disk)=m/n=4/14
P(black disk)=2/7
Therefore, the probability of getting a black disk=2/7.
Question 3.
A letter is randomly chosen from the word MATHEMATICS. What is the probability of choosing letter M?
Answer:
The above-given word: MATHEMATICS
The total number of letters = n = 11
The letter we need to select is ‘M’.
The favourable cases = m = 2
because we can select M two times.
P(letter M)=m/n
P(letter M)=2/11
Therefore, the probability of choosing letter M is 2/11.
Question 4.
There are 6 red marbles and 10 white marbles in a bag. What is probability of randomly choosing a white marble from the bag?
Answer:5/8
Explanation:
The number of red marbles=6
The number of white marbles=10
The total number of marbles=n=16
The favourable cases=m=10
The probability of choosing white marbles=P
P(white marbles)=m/n
P(white marbles)=10/16
P(white marbles)=5/8
Therefore, the probability of choosing white marbles are 5/8.
Question 5.
Numbers made up of two digits are formed using the digits 2, 3, and 4 with no repeating digits.
a) List all possible outcomes.
Answer:
The above-given numbers:2, 3, and 4
The possible outcomes are 23, 24, 32, 34, 42, 43
b) Find the probability of randomly forming a number greater than 32.
Answer:1/2
Explanation:
sample space={3, 4}
The total number= n= 2
According to the given numbers above, numbers obtained greater than 32 randomly=m=1 (34)
P(greater than 32)=m/n
P(greater than 32)=1/2.
Therefore, the probability of randomly forming a number greater than 32 is 1/2.
c) Find the probability of randomly forming a number divisible by 4.
Answer:1/3
The two-digit numbers formed using the given numbers 2, 3, and 4
The possible outcomes are 23, 24, 32, 34, 42, 43
Sample space={23, 24, 32, 34, 42, 43}
The total number of outcomes= n = 6
The total favourable cases= m = 2
Those cases are 24, 32 which are divisible by 4.
P(divisible by 4)=m/n
P(divisible by 4)=2/3
P(divisible by 4)=1/3.
Therefore, 1/3 is the probability of randomly forming a number divisible by 4.
Question 6.
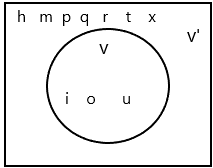
Jack picks a letter randomly from the following list: h, i, m, o, p, q, r, t, u, and x.
The event V occurs when Jack picks a vowel.
a) Draw a Venn diagram to represent the information. Explain the meaning of the complement of event V.
Answer:
The probability of an event is a measure of the chance of occurrence of an event when an experiment is done. Complementary events occur when there are only two outcomes, for example clearing an exam or not clearing an exam. The complement means the exact opposite of an event.
Definition: For any event A, there exists another event A‘ which shows the remaining elements of the sample space S. A’ denotes complementary event of A.
: A’ = S – A.
Event A and A’ are mutually exclusive and exhaustive.
Consider the example of tossing a coin. Let P(E) denote the probability of getting a tail when a coin is tossed.
Then the probability of getting ahead is denoted by P(E’)
According to the definition, the complement of event V is the exact opposite of event V.
In complement of V (V’) all the letters are consonants, not vowels.
b) Find P(V) and P(V’).
Answer:
The number of consonants is nothing but the complement of V
The total number of letters=10
The number of vowels= V =3 (i, o, u)
P(V)=m/n
P(V)=3/10
Therefore, the probability of P(V) is 3/10
The number of consonants (V’)= 7 (h, m, p, q, r, t, x)
P(V’)=7/10
Thus the probability of the complement of V is 7/10.
Question 7.
A number is randomly selected from 1 to 20. X is the event of selecting a number divisible by 4. Y is the event of getting a prime number.
a) Draw a Venn diagram to represent the information.
Answer:
Venn diagram: Venn diagrams are the diagrams that are used to represent the sets, relation between the sets and operation performed on them, in a pictorial way. Venn diagram, introduced by John Venn (1834-1883), uses circles (overlapping, intersecting and non-intersecting), to denote the relationship between sets. A Venn diagram is also called a set diagram or a logic diagram showing different set operations such as the intersection of sets, the union of sets and the difference of sets. It is also used to depict subsets of a set.
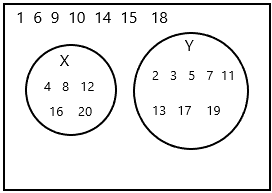
Event X is selecting a number divisible by 4.
Event Y is getting a prime number.
N(X)={4, 8, 12, 16, 20}
N(Y)={2, 3, 5, 7, 11, 13, 17, 19}
b) Are events X and Y mutually exclusive? Explain.
Answer: Yes, X and Y events are mutually exclusive. Because they are disjoint sets.
Explanation:
Mutually exclusive: In probability theory, two events are said to be mutually exclusive if they cannot occur at the same time or simultaneously. In other words, mutually exclusive events are called disjoint events. If two events are considered disjoint events, then the probability of both events occurring at the same time will be zero.
If A and B are the two events, then the probability of disjoint of event A and B is written by:
Probability of Disjoint (or) Mutually Exclusive Event = P ( A and B) = 0.
If A and B are mutually exclusive events then its probability is given by P(A Or B) or P (A U B).
c) Find P(X) and P(Y).
Answer:
sample space X={4, 8, 12, 16, 20}
sample space Y={2, 3, 5, 7, 11, 13, 17, 19}
The total numbers=n=20
The number of numbers divisible by 4=m=5
P(divisible by 4)=m/n
P(divisible by 4)=5/20
P(divisible by 4)=1/4
Therefore the probability of the numbers divisible by 4 is 1/4.
The number of prime numbers=8
P(prime numbers)=8/20
P(prime numbers)=2/5
Therefore, the probability of getting prime numbers is 2/5.
Question 8.
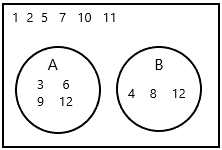
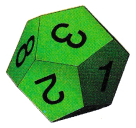
A dodecahedron number die has 12 faces. Each face is printed with one of the numbers from 1 to 12. Suppose you roll a fair dodecahedron number die and record the value on the top face. Let A be the event of rolling a number that is a multiple of 3. Let B be the event of rolling a number that is a multiple of 4.
a) Draw a Venn diagram to represent the information.
Answer:
The numbers will get when we roll a dice=1, 2, 3, 4, 5, 6, 7, 8, 9, 10, 11, 12.
Probability of having 1 on the roll-up of dice:
Occurrence of 1 on top of dice/ Total number of possible outcomes of dice
= 1/12
Each of the outcomes of the dice has an equal probability of 1/12. Each outcome is equally likely to come on the top when the dice is rolled. Hence, the rolling of dice can be considered to be a fair probability scenario.
The possible outcome for 1 is 1/12
The possible outcome for 2 is 1/12
E(A) is the rolling number that is a multiple of 3.
E(B) in the event of rolling a number that is a multiple of 4.
The numbers multiple of 3 is 3, 6, 9, 12
The numbers multiple of 4 is 4, 8, 12
b) From the Venn diagram, tell whether events A and B are mutually exclusive. Explain your answer.
Answer: Yes, A and B events are mutually exclusive. Because they are disjoint sets.
Explanation:
Mutually exclusive: In probability theory, two events are said to be mutually exclusive if they cannot occur at the same time or simultaneously. In other words, mutually exclusive events are called disjoint events. If two events are considered disjoint events, then the probability of both events occurring at the same time will be zero.
If A and B are the two events, then the probability of disjoint of event A and B is written by:
Probability of Disjoint (or) Mutually Exclusive Event = P ( A and B) = 0.
If A and B are mutually exclusive events then its probability is given by P(A Or B) or P (A U B).
c) Find P(A) and P(B).
Answer:
E(A) is the rolling number that is a multiple of 3.
E(B) in the event of rolling a number that is a multiple of 4.
The numbers multiple of 3 is 3, 6, 9, 12
The numbers multiple of 4 is 4, 8, 12
P(A)=E(A)/N(T)
P(A) is the probability of numbers that are multiples of 3
E(A)= the number of multiples that occurred in an event.
N(T) is the total number that is in the dice.
P(A)=4/12
P(A)=1/3
Therefore, the probability is 1/3.
P(B)=E(B)/N(T)
P(B) is the probability of numbers that are multiples of 4
E(B)= the number of multiples that occurred in an event.
N(T) is the total number that is in the dice.
P(B)=3/12
P(B)=1/4
Therefore, the probability is 1/4.
Question 9.
This year, some students in the Drama Club have the same first names. Name tags for the students are shown below.
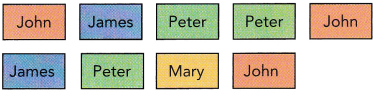
One of the name tags is selected at random. Event E occurs when the name has the letter e. Event J occurs when the name tag is ![]() .
.
a) Draw a Venn diagram to represent the information.
Answer:
Venn diagram: Venn diagrams are the diagrams that are used to represent the sets, relation between the sets and operation performed on them, in a pictorial way. Venn diagram, introduced by John Venn (1834-1883), uses circles (overlapping, intersecting and non-intersecting), to denote the relationship between sets. A Venn diagram is also called a set diagram or a logic diagram showing different set operations such as the intersection of sets, the union of sets and the difference of sets. It is also used to depict subsets of a set.
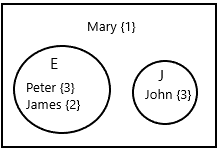
E(E) is the name having with letter ‘e’.
E(J) is when the name tag occurred ‘John’.
b) List all the types of outcomes of event E’, the complement of event E.
Answer: John, Mary
Explanation:
The probability of an event is a measure of the chance of occurrence of an event when an experiment is done. Complementary events occur when there are only two outcomes, for example clearing an exam or not clearing an exam. The complement means the exact opposite of an event.
Definition: For any event A, there exists another event A‘ which shows the remaining elements of the sample space S. A’ denotes complementary event of A.
: A’ = S – A.
Event A and A’ are mutually exclusive and exhaustive.
Consider the example of tossing a coin. Let P(E) denote the probability of getting a tail when a coin is tossed.
Then the probability of getting ahead is denoted by P(E’)
According to the definition, the complement of an event E is the exact opposite of event E.
In complement of E (E’) in a word not having letter ‘e’.
c) Are events E and J mutually exclusive? Explain your answer.
Answer: Yes, E and J events are mutually exclusive. Because they are disjoint sets.
Explanation:
Mutually exclusive: In probability theory, two events are said to be mutually exclusive if they cannot occur at the same time or simultaneously. In other words, mutually exclusive events are called disjoint events. If two events are considered disjoint events, then the probability of both events occurring at the same time will be zero.
If A and B are the two events, then the probability of disjoint of event A and B is written by:
Probability of Disjoint (or) Mutually Exclusive Event = P ( A and B) = 0.
If A and B are mutually exclusive events then its probability is given by P(A Or B) or P (A U B).
d) Find P(E), P(E’), and P(J).
Answer:
sample space={Peter, Peter, Peter, James, James}
The number of event E occurs= N(E) = 5
The n\total number of names= N(T)= 9
P(E)=N(E)/N(T)
P(E)=5/9
Therefore, the probability of P(E) is 5/9.
P(E’)=N(E’)/N(T)
E’=John, Mary
The number of event E’ occurs=2
P(E’)=2/9
Therefore, the probability of E’ is 2/9.
P(J)=N(J)/N(T)
The number of event J occurs=3
P(J)=3/9
P(J)=1/3
therefore, the probability of J is 1/3.
Question 10.
Math Journal Explain why mutually exclusive events are not necessarily complementary.
Answer:
mutually exclusive events are not necessarily complementary because there will be two independent events.
Two events associated with a random experiment are said to be mutually exclusive if both cannot occur together in the same trial. Mutually-exclusive events are also known as disjoint events.
It is also important to distinguish between independent and mutually exclusive events. Independent events are those which do not depend on one another; while mutually exclusive events cannot occur together at one time.
For example: In the experiment of throwing a die, the events A = {1, 4} and B = {2, 5, 6} are mutually exclusive events.
In the same experiment, the events A = {1, 4} and C = {2, 4, 5, 6} are not mutually exclusive because, if 4 appears on the die, then it is favourable to both events A and C.
If A and B are two events, then A or B or (A ⋃ B) denotes the event of the occurrence of at least one of the events A or B.
A and B or (A ⋂ B) is the event of the occurrence of both events A and B.
If A and B happen to be mutually exclusive events, then P(A ⋂ B) = 0.
Question 11.
At a middle school, 39% of the student’s jog and 35% of the students do aerobic exercise. One out of every five students who do aerobic exercise also jogs.

a) Draw a Venn diagram to represent the information.
Answer:
Venn diagrams are the diagrams that are used to represent the sets, relation between the sets and operations performed on them, in a pictorial way. Venn diagram, introduced by John Venn (1834-1883), uses circles (overlapping, intersecting and non-intersecting), to denote the relationship between sets. A Venn diagram is also called a set diagram or a logic diagram showing different set operations such as the intersection of sets, the union of sets and the difference of sets. It is also used to depict subsets of a set.
Jog=39%; aerobic=35%
One out of every five students who do aerobic exercise also jogs
– so if you divide students into set of 5 :
Jog=5*7=35; Aerobic=5*7=35
so 7 sets we have.
And subtract one student from every set of 7; so 39-7=32 and 35-7=28
Common students who do both are 7%
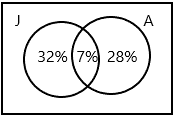
b) What per cent of the students do both activities?
Answer: 7%
Jog=39%; aerobic=35%
One out of every five students who do aerobic exercise also jogs
– so if you divide students into sets of 5 :
Jog=5*7=35; Aerobic=5*7=35
so 7 sets we have.
And subtract one student from every set of 7; so 39-7=32 and 35-7=28
Common students who do both are 7%
c) What fraction of the students only jog?
Answer:8/25
Only jog students in fractions=32/100
Therefore, the fraction of students only jog is 8/25
d) What is the probability that a randomly selected student at the middle school does neither activity? Give your answer as a decimal.
Answer:0.33
Neither do any activity=100-(32+7+28)
=100-67
=33
In decimals,
=33/100
=0.33
Question 12.
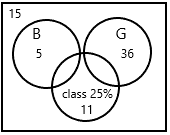
A teacher chooses a student at random from a class with 20 boys and 36 girls. 25% of the students wear glasses. 15 boys in the class do not wear glasses.
a) Draw a Venn diagram to represent the information.
Answer:
the total number of students in a class=56
The number of boys=20
The number of girls=36
The number of boys does not wear glasses=15
The remaining boys who do not wear glasses=20-15=5
Now there is a chance for 5 boys and 36 girls wearing glasses.(36+5=41)
The number of students wearing glasses=25/100*41=10.56 (nearest to 11)
b) What fraction of the students in the class are girls who do not wear glasses?
Answer:
the total number of students in a class=56
The number of boys=20
The number of girls=36
The fraction of students in the class are girls who do not wear glasses=X
25% are wearing glasses remaining 75% may not wear
X=75*36/100
X=27/56
X=1/2
c) What is the probability that a randomly selected student is a boy who wears glasses?
Answer:
The probability of an event is a measure of the chance of occurrence of an event when an experiment is done.
P(A)=N(A)/N(T)
P(A)=5/56
P(A)=11.2
therefore, 11.2 is the probability that a randomly selected student is a boy who wears glasses
Question 13.
Alex has a pair of red socks, a pair of white socks, and a pair of black socks in his drawer. Unfortunately, the socks are not matched up with each other. Alex reaches into the drawer in the dark and pulls out two socks.
a) What ¡s the probability that the two socks are the same color?
Answer:1/5
Explanation:
Alex has pair of red socks, white socks, black socks.
He can take out the possible outcomes={RR, WW, BB}
Probability of drawing socks:
Picking the first sock of the two with the same colour has the probability of 2/6, and therefore picking the second sock with the same colour has a probability of (2−1)/(6−1)=1/5 respectively.
Occurrence of 1 pair of socks/ Total number of possible outcomes
= 1/5
Each of the outcomes of the same socks has an equal probability of 1/5. Each outcome is equally likely to come on the top when the same colour of socks is drawn. Hence, it can be considered to be a fair probability scenario.
b) What is the probability that the two socks are different colors?
Answer: 4/5
Alex has pair of red socks, white socks, black socks.
He can take out the possible outcomes of two different socks={RW, WB, RB}
Picking the first sock of the two with the different colours has the probability of 2/6, and therefore picking the second sock with the different colour has a probability of (6−2)/(6−1)=4/5 respectively.
c) Are the two events described in a) and b) complementary? Explain.
Answer: yes, the vents are complementary because two socks either match or do not match.
The probability of an event is a measure of the chance of occurrence of an event when an experiment is done. Complementary events occur when there are only two outcomes, for example clearing an exam or not clearing an exam. The complement means the exact opposite of an event.
Definition: For any event A, there exists another event A‘ which shows the remaining elements of the sample space S. A’ denotes complementary event of A.
: A’ = S – A.
Event A and A’ are mutually exclusive and exhaustive.
Consider the example of tossing a coin. Let P(E) denote the probability of getting a tail when a coin is tossed.
Then the probability of getting ahead is denoted by P(E’)
Question 14.
A small town has a population of 3,200. 30% of the townspeople speak Italian, 20% speak French, and the rest do not speak either of these languages 360 people speak both Italian and French.
a) Draw a Venn diagram to represent the information.
Answer:
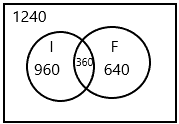
The total population of small town=3,200
The number of people who speaks italian=3200*30/100=960
The number of people who speaks French=3200*20/100=640
The number of people who speak both Italian and French=360
The rest of the people do not speak both languages=X
X=960+640+360-3200
X=1960-3200
X=1240
Therefore, 1240 people do not speak both languages.
b) What per cent of the townspeople speak only Italian?
Answer:
We already know that 30% of the people speak only Italian.
The above-given the percentage of the people who speaks only Italian.
c) If you randomly pick a person in the town and speak to the person in Italian, what is the probability that the person does not understand you?
Answer:
The total population of small town=3,200
The number of people who speaks italian=3200*30/100=960
The number of people who speaks French=3200*20/100=640
The number of people who speak both Italian and French=360
The rest of the people do not speak both languages=X
X=960+640+360-3200
X=1960-3200
X=1240
Randomly picking a person and speaking Italian to that person and asking the probability that he does not understand the Italian.
It means there is a chance of picking the person who speaks French and cannot speak both Italian and French.
So here 2 possible cases.
The total people for these 2 possible cases=640+1240=1880
P(A)=2/1880
P(A)=1/940.
Question 15.
The 6,000 oranges harvested at an orange grove are a combination of Valencia and Navel oranges. The ratio of Valencia oranges to Navel oranges is 7 : 5. The owner of the orange grove finds that 1 in every 20 Valencia oranges and 1 in every 25 Navel oranges are rotten.
a) What fraction of the oranges is not rotten?
Answer:229/240
the total number of oranges=6000
The ratio of valencia oranges=7
The ratio of Navel oranges=5
The total number of valencia oranges=X
X=6000*7/12
X=3500
1 in every 20 valencia oranges are rotten:
Valencia oranges rotten=3500/20
Valencia oranges rotten=175
Valencia oranges are not rotten=3500-175
valencia oranges not rotten=3325
Total navel oranges=6000*5/(7+5)
=6000*5/12
=2500
Navel oranges rotten=2500/25
Navel oranges rotten=100
navel oranges, not rotten=2500-100
navel oranges, not rotten=2400
Fraction of oranges not rotten:
=6000-(175+100)/6000
=6000-275/6000
=5725/6000
=229/240
b) What is the probability that a randomly selected orange is a good orange?
Answer:
This formula is the number of favourable outcomes to the total number of all the possible outcomes that we have already decided in the Sample Space.
The probability of an Event = (Number of favourable outcomes) / (Total number of possible outcomes)
P(A) = n(E) / n(S)
P(A) < 1
Here, P(A) means finding the probability of an event A, n(E) means the number of favourable outcomes of an event and n(S) means the set of all possible outcomes of an event.
the probability that a randomly selected orange is a good orange=P(A)
oranges that are not rotten=229/240.
P(A)=229/240
c) What is the probability that a randomly selected orange is a rotten Valencia?
Answer:7/240
The probability of an Event = (Number of favourable outcomes) / (Total number of possible outcomes)
P(A) = n(E) / n(S)
P(A) < 1
Here, P(A) means finding the probability of an event A, n(E) means the number of favourable outcomes of an event and n(S) means the set of all possible outcomes of an event.
Probability that a randomly selected orange is rotten valencia
valencia oranges rotten=175/2000
P(Valencia oranges rotten)=7/240