This handy Math in Focus Grade 7 Workbook Answer Key Chapter 10 Review Test detailed solutions for the textbook questions.
Math in Focus Grade 7 Course 2 B Chapter 10 Review Test Answer Key
Concepts and Skills
Solve.
Question 1.
You select a card at random from 50 cards numbered from 1 to 50. What are the possible outcomes for the event of choosing a number that is a multiple of 6?
Answer:
The numbers are:1, 2, 3, 4, 5, 6, 7, 8, 9, 10, 11, 12, 13, 14, 15, 16, 17, 18, 19, 20, 21, 22, 23, 24, 25, 26, 27, 28, 29, 30, 31, 32, 33, 34, 35, 36, 37, 38, 39, 40, 41, 42, 43, 44, 45, 46, 47, 48, 49, 50.
This formula is the number of favourable outcomes to the total number of all the possible outcomes that we have already decided in the Sample Space.
The probability of an Event = (Number of favourable outcomes) / (Total number of possible outcomes)
P(A) = n(E) / n(S)
P(A) < 1
Here, P(A) means finding the probability of an event A, n(E) means the number of favourable outcomes of an event and n(S) means the set of all possible outcomes of an event.
The total number of outcomes=50
The possible outcomes are 6, 12, 18, 24, 30, 36, 42, 48.
the event is choosing a number that is multiple of 6.
the numbers which are multiple of 6 are 6, 12, 18, 24, 30, 36, 42, 48.
Question 2.
Three fair coins are tossed together once. List the outcomes that are favorable for the event of only two of the coins landing on heads.
Answer:
When 3 coins are tossed, the possible outcomes are HHH, TTT, HTT, THT, TTH, THH, HTH, HHT.
The sample space is S = { HHH, TTT, HTT, THT, TTH, THH, HTH, HHT}
Number of elements in sample space, n(S) = 8
Let E2 denotes the event of getting two heads.
E2 = {HHT, HTH, THH}
n(E2) = 3
P(getting two heads) = n(E2)/ n(S)
= 3/8
Hence the required probability is 3/8.
Question 3.
Daniel wants to write all the 2-digit numbers with no repeating digits that can be formed using the digits 5, 6, and 7.
a) List all the possible outcomes.
Answer:
The above-given numbers are 5, 6, and 7
The possible numbers will come without repeating digits that can be formed 2-digit numbers=56, 57, 65, 67, 75, 76
b) X is the event that the 2-digit number is divisible by 5. How many of the outcomes are favorable to event X?
Answer: 2 outcomes.
Explanation:
The possible outcomes we got in the above question=56, 57, 65, 67, 75, 76
Event X is the numbers divisible by 5.
The favourable outcomes we need to find.
5*12=65
5*15=75
E(X)=65, 75
Therefore, the number of outcomes is 2
Question 4.
Amy writes a computer program that will choose two letters from her own name to make a two-letter “string.” The order of the letters matters. For example, AM and MA are different strings.
a) List all the possible outcomes for forming a two-letter string.
Answer:
The above-given name: Amy
If we choose the letters A and Y then the possible outcomes for forming a two-letter string are:
AY and YA.
b) What is the probability that Amy forms a two-letter string with the letter M in it?
Answer:
The above-given name: Amy
Now letter M is given
This formula is the number of favourable outcomes to the total number of all the possible outcomes that we have already decided in the Sample Space.
The probability of an Event = (Number of favourable outcomes) / (Total number of possible outcomes)
P(A) = n(E) / n(S)
P(A) < 1
Here, P(A) means finding the probability of an event A, n(E) means the number of favourable outcomes of an event and n(S) means the set of all possible outcomes of an event.
The outcomes are 2 [AM, MY]
The total number of letters in the name=3
P(A)=2/3
therefore, the probability is 2/3.
Question 5.
Two-digit numbers are formed using digits 2, 3, and 4, with no repeating digits.
a) List all the possible outcomes.
Answer:
The above-given numbers are 2, 3, and 4
The possible numbers will come without repeating digits that can be formed 2-digit numbers=23, 24, 32, 34, 42, 43
b) What is the probability of forming a number greater than 32?
Answer:
This formula is the number of favourable outcomes to the total number of all the possible outcomes that we have already decided in the Sample Space.
The probability of an Event = (Number of favourable outcomes) / (Total number of possible outcomes)
P(A) = n(E) / n(S)
P(A) < 1
Here, P(A) means finding the probability of an event A, n(E) means the number of favourable outcomes of an event and n(S) means the set of all possible outcomes of an event.
The numbers we formed using the 2, 3, and 4 are 23, 24, 32, 34, 42, 43
The numbers greater than 32 are 34, 42, 43
the possible outcomes are 3
The total number of outcomes=6
P(greater than 32)=3/6
P(greater than 32)=1/2=0.5
therefore, the probability is 0.5 or 1/2.
Question 6.
Tim has three DVDs. One is a science fiction movie, one is an action movie, and the other is a documentary. If he stacks the DVDs randomly, what is the probability that the science fiction movie is on top, the action movie is in the middle, and the documentary is on the bottom?
Answer:1/3
The above-given data:
The DVDs Tim has science fiction movies, action movies, documentaries.
If he kept randomly on the shelves then the probability of the DVDs keeping in a given order.
This formula is the number of favourable outcomes to the total number of all the possible outcomes that we have already decided in the Sample Space.
The probability of an Event = (Number of favourable outcomes) / (Total number of possible outcomes)
P(A) = n(E) / n(S)
P(A) < 1
Here, P(A) means finding the probability of an event A, n(E) means the number of favourable outcomes of an event and n(S) means the set of all possible outcomes of an event.
the total number of DVDs=3
The possible number of outcomes keeping in the DVDs=1
P(science fiction)=1/3
P(action movie)=1/3
P(documentaries)=1/3
Question 7.
A ribbon is selected at random out of a total of 4 orange ribbons, 5 yellow ribbons, and 3 red ribbons. What is the probability of selecting an orange ribbon?
Answer:
The total ribbons=12
This formula is the number of favourable outcomes to the total number of all the possible outcomes that we have already decided in the Sample Space.
The probability of an Event = (Number of favourable outcomes) / (Total number of possible outcomes)
P(A) = n(E) / n(S)
P(A) < 1
Here, P(A) means finding the probability of an event A, n(E) means the number of favourable outcomes of an event and n(S) means the set of all possible outcomes of an event.
The possible outcomes of orange ribbons=4
P(orange ribbons)=4/12
P(orange ribbons)=1/3
Therefore, the probability of orange ribbons=1/3.
Question 8.
Use the spinner shown.
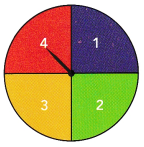
a) What is the probability of landing on an even number?
Answer:1/2
The above-given numbers 1, 2, 3, and 4
the even numbers are 2 and 4
the possibilities are 2
the total number of outcomes=4
The probability of an Event = (Number of favourable outcomes) / (Total number of possible outcomes)
P(A) = n(E) / n(S)
P(A) < 1
Here, P(A) means finding the probability of an event A, n(E) means the number of favourable outcomes of an event and n(S) means the set of all possible outcomes of an event.
P(even number)=2/4
P(even number)=1/2
therefore, the probability of landing an even number is 1/2 or 0.5
b) What is the probability of landing on a number less than 4?
Answer:
The above-given numbers 1, 2, 3, and 4
the numbers less than 4 are 1, 2, 3
the possibilities are 3
the total number of outcomes=4
The probability of an Event = (Number of favourable outcomes) / (Total number of possible outcomes)
P(A) = n(E) / n(S)
P(A) < 1
Here, P(A) means finding the probability of an event A, n(E) means the number of favourable outcomes of an event and n(S) means the set of all possible outcomes of an event.
P(less than 4)=3/4
therefore, the probability is 3/4.
Problem Solving
Solve.
Question 9.
Olivia and Jackie played a game with the spinner shown.
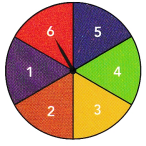
Olivia spun a 2 on 12 spins out of 50, while Jackie spun a 2 on 19 spins out of 100.
a) Find each person’s experimental probability of spinning a 2. Express your answers as decimals.
Answer:0.24; 0.19
explanation:
The above-given data
Olivia spun 12 spins on 2 out of 50.
While Jackie spun 19 spins on 2 out of 2
Experimental Probability is the probability of an event based on exact recordings or experiments of an event. The calculation is done by dividing the number of times an event occurred by the total number of trials in an experiment. We can express experimental probability mathematically as,
Experimental Probability = Number of times a particular event occurs/ Number of total trials)
The number of times a particular event occurs for Olivia=12
The number of times a particular event occurs for Jackie=19
The total number of spins of Olivia=50
the total number of spins of Jackie=100
P(Olivia)=12/50
P(Olivia)=6/25
P(Olivia)=0.24
P(Jackie)=19/100
P(Jackie)=0.19
b) Suppose the spinner is fair, meaning that it is equally likely to land on any of the numbers. What is the theoretical probability of spinning a 2?
Answer:1/6
Theoretical Probability describes the probability of the happening of certain events that are not in an experimental way of an occurrence. An example of this is drawing a red stone out of a bag etc. We can express theoretical probability mathematically as,
theoretical Probability = Total number of desired outcomes/ Total number of outcomes
Total number of the desired outcomes=1
Total number of outcomes=6
Theoretical probability=1/6
therefore, the probability of spinning 2 is 1/6.
c) Assuming the spinner is fair, what do you predict will happen to the experimental probability of getting a 2 if the spinner is spun 500 times?
Answer:
It is closer to the theoretical probability.
Theoretical Probability describes the probability of the happening of certain events that are not in an experimental way of an occurrence. An example of this is drawing a red stone out of a bag etc. We can express theoretical probability mathematically as,
theoretical Probability = Total number of desired outcomes/ Total number of outcomes.
Question 10.
A red number die and a green number die each have faces labeled 1 to 6. Suppose you roll the number dice and record the values for each die as an ordered pair of numbers: (red value, green value). The event E is the event of getting a pair of values in which the number on the green die is greater than the number on the red die.
a) Find all the outcomes favorable to event E.
Answer:
The numbers are on the green die=1, 2, 3, 4, 5, 6
The numbers are on the red die=1, 2, 3, 4, 5, 6
The possible outcomes are:
{ (2, 1) (3, 2) (3, 1) (4, 1) (4, 2) (4, 3) (5, 1) (5, 2) (5, 3) (5, 4) (6, 1) (6, 2) (6, 3) (6, 4) (6, 50)}
b) Find P(E).
Answer:
The probability of an Event = (Number of favourable outcomes) / (Total number of possible outcomes)
P(A) = n(E) / n(S)
P(A) < 1
Here, P(A) means finding the probability of an event A, n(E) means the number of favourable outcomes of an event and n(S) means the set of all possible outcomes of an event.
The event E is the event of getting a pair of values in which the number on the green die is greater than the number on the red die.
the number of favourable outcomes=5 (2, 3, 4, 5, 6)
The total number of possible outcomes=15
{ (2, 1) (3, 2) (3, 1) (4, 1) (4, 2) (4, 3) (5, 1) (5, 2) (5, 3) (5, 4) (6, 1) (6, 2) (6, 3) (6, 4) (6, 50)}
P(E)=5/15
P(E)=1/3
In decimals, we can write as 0.3
Therefore, the probability is 0.3 or 1/3.
Question 11.
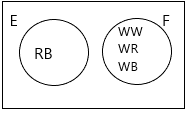
Two fair counters are tossed together. One of the counters is white on one side and black on the other side, the other counter is white on one side, and red on the other side. They are tossed together and the face up colors of the two counters are noted. Let F be the event that red and black appear, and F be the event that at least one is white.
a) Define the sample space of the experiment.
Answer:
A sample space is a collection of a set of possible outcomes of a random experiment. The sample space is represented using the symbol, “S”. The subset of possible outcomes of an experiment is called events. A sample space may contain a number of outcomes that depends on the experiment. If it contains a finite number of outcomes, then it is known as discrete or finite sample spaces.
The samples spaces for a random experiment is written within curly braces “ { } “. There is a difference between the sample space and the events. For rolling a die, we will get the sample space, S as {1, 2, 3, 4, 5, 6 } whereas the event can be written as {1, 3, 5 } which represents the set of odd numbers and { 2, 4, 6 } which represents the set of even numbers. The outcomes of an experiment are random and the sample space becomes the universal set for some particular experiments.
Let W, B and R represent white, black and red respectively.
the sample space is {WW, WR, BW, BR}.
b) Calculate the probability of each outcome.
Answer:1/4
The probability of an Event = (Number of favourable outcomes) / (Total number of possible outcomes)
P(A) = n(E) / n(S)
P(A) < 1
Here, P(A) means finding the probability of an event A, n(E) means the number of favourable outcomes of an event and n(S) means the set of all possible outcomes of an event.
Total number of possible outcomes=4
The number of a favourable outcomes for red=1
The number of a favourable outcome for black=1
The number of a favourable outcome for white=1
P(red)=1/4
P(black)=1/4
P(white)=1/4
c) Construct the probability distribution table. Is it a uniform probability model?
Answer:
A probability distribution table is a table that displays the probability that a random variable takes on certain values.
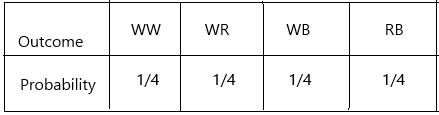
Uniform in Probability. A discrete uniform probability distribution is one in which all elementary events in the sample space have an equal opportunity of occurring. As a result, for a finite sample space of size n, the probability of an elementary event occurring is 1/ n.
yes, all the outcomes have an equal probability of occurring.
d) Draw a Venn diagram for events E and F. Are they mutually exclusive?
Answer:
A diagram is used to represent all possible relations of different sets. A Venn diagram can be represented by any closed figure, whether it be a Circle or a Polygon (square, hexagon, etc.). But usually, we use circles to represent each set.
In probability theory, two events are said to be mutually exclusive if they cannot occur at the same time or simultaneously. In other words, mutually exclusive events are called disjoint events. If two events are considered disjoint events, then the probability of both events occurring at the same time will be zero.
Probability of Disjoint (or) Mutually Exclusive Event = P ( A and B) = 0
According to the above definition:
Yes, the events are mutually exclusive.
e) Calculate P(E) and P(F).
Answer:
The probability of an Event = (Number of favourable outcomes) / (Total number of possible outcomes)
P(A) = n(E) / n(S)
P(A) < 1
Here, P(A) means finding the probability of an event A, n(E) means the number of favourable outcomes of an event and n(S) means the set of all possible outcomes of an event.
The number of favourable outcomes of event E=1
The total number of possible outcomes=4
P(E)=1/4
The number of favourable outcomes of event F=1
P(F)=3/4
Question 12.
Joan keeps track of the number of emails she receives each day for 100 days. She then makes a table showing how many days she received 0 emails, 1 email, 2 emails, and so on, as shown in the table.
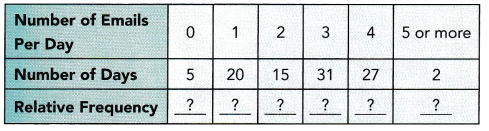
a) Copy and complete the table above by finding each relative frequency.
Answer:
The number of times an event occurs is called a frequency. The number of times an event occurs is called a frequency. Relative frequency is an experimental one, but not a theoretical one. Since it is an experimental one, it is possible to obtain different relative frequencies when we repeat the experiments. To calculate the frequency we need
– Frequency count for the total population
– Frequency count for a subgroup of the population
We can find the relative frequency probability in the following way if we know the above two frequencies. The formula for a subgroup is;
Relative Frequency = Subgroup Count / Total Count
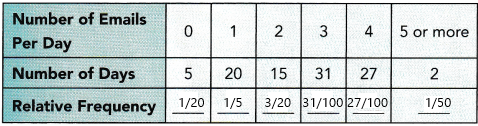
The relative frequency of the number of days(5)=5/100=1/20
The relative frequency of the number of days(20)=20/100=1/5
The relative frequency of the number of days(15)=15/100=3/20
The relative frequency of the number of days(31)=31/100
The relative frequency of the number of days(27)=27/100
The relative frequency of the number of days(22)=2/100=1/50
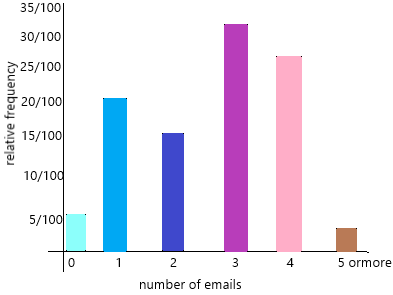
b) Present the relative frequencies in a bar graph.
Answer:
Relative Frequency Graph Maker A relative frequency graph shows the relative frequencies corresponding to the values in a sample, with respect to the total sample data.
Question 13.
At a music school, 400 students were given a survey on the number of hours they practice each week. The results of this survey are shown in the relative frequency histogram.
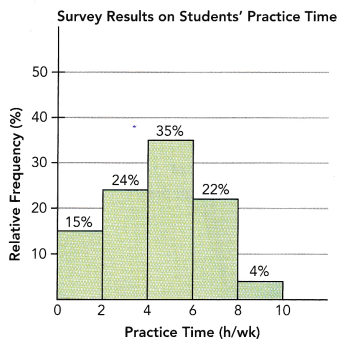
a) How many students practiced at least 2 hours but less than 4 hours per week?
Answer: 96
Explanation:
The above-given question:
The total number of students was given a survey on the number of hours they practise each week=400
The number of students practised at least 2 hours but less than 4 hours per week=X
at least 2 means 2 or more than 2.
The percentage of students practised at least 2 hours but less than 4 hours per week=24%
By using the given data we need to calculate the number of students practised between the given time in the question
X=24*400/100
X=96.
Therefore, the number of students practised at least 2 hours but less than 4 hours per week is 96.
b) One of the students is selected at random. What is the probability that this student has practiced 6 or more hours per week?
Answer:0.26 or 13/50
Explanation:
The probability of an Event = (Number of favourable outcomes) / (Total number of possible outcomes)
P(A) = n(E) / n(S)
P(A) < 1
Here, P(A) means finding the probability of an event A, n(E) means the number of favourable outcomes of an event and n(S) means the set of all possible outcomes of an event.
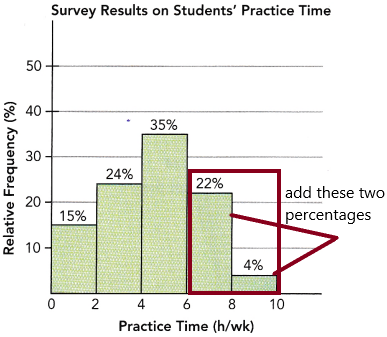
The probability that this student has practised 6 or more hours per week=P(A)
The total number of students (total possible outcomes)=n(S)=400
The number of favourable outcomes(6 0r more)=22%+4%=26%
26% of 400
=26*400/100
=104
P(A)=104/400
P(A)=13/50
In decimals, we can write as 0.26
Therefore, the probability is 0.26 or 13/50
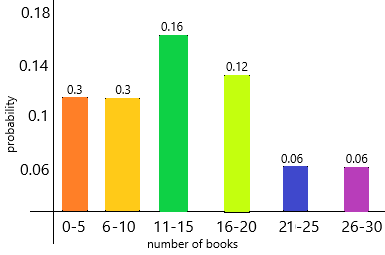
Question 14.
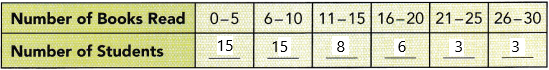
Fifty students at a school kept track of how many books they read last semester. Each student wrote the number of books he or she read in a table provided by the school librarian.
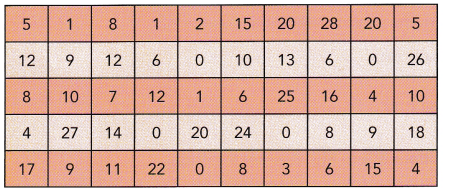
a) Copy and complete the frequency table.
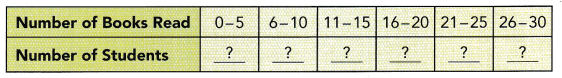
Answer:
Frequency table: Frequency means the number of times a value appears in the data. A table can quickly show us how many times each value appears. If the data has many different values, it is easier to use intervals of values to present them in a table.
b) Copy and complete the probability distribution table below.
Answer:
A probability distribution table is a table that displays the probability that a random variable takes on certain values.
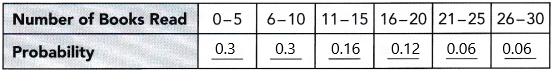
The probability of students read books 0-5=15/50=0.3
The probability of students read books 6-10=15/50=0.3
The probability of students reading books 11-15=8/50=0.16
The probability of students reading books 16-20=6/50=0.12
The probability of students reading books 21-25=3/50=0.06
The probability of students reading books 21-25=3/50=0.06
c) Suppose the librarian selects one of the students at random. What is the probability that the student has read at least 6 books but not more than 15 books?
Answer:23/50 or 0.46
Explanation:
The probability of an Event = (Number of favourable outcomes) / (Total number of possible outcomes)
P(A) = n(E) / n(S)
P(A) < 1
Here, P(A) means finding the probability of an event A, n(E) means the number of favourable outcomes of an event and n(S) means the set of all possible outcomes of an event.
the probability that the student has read at least 6 books but not more than 15 books=P(A)
The number of outcomes (6-15)=15+8=23=n(E)
the total number of students=50=n(S)
P(A)=23/50
In decimals, we can write as 0.46
d) What per cent of the students had read 10 or fewer books?
Answer: 30%
The above-given question:
The per cent of the students had read 10 or fewer books=X
10 or fewer means 10 and 10 below books.
Now observe the frequency table above:
0-10 there are total 30 books (15+15)
Now calculate the percentage.
X=15/50*100
X=3/10*100
X=30%
therefore, 30% of the students had read 10 or fewer books.
e) Present the probability distribution in a bar graph.
Answer:
Probability distribution yields the possible outcomes for any random event. It is also defined based on the underlying sample space as a set of possible outcomes of any random experiment. These settings could be a set of real numbers or a set of vectors or a set of any entities. It is a part of probability and statistics.