This handy Math in Focus Grade 7 Workbook Answer Key Chapter 10 Lesson 10.4 Developing Probability Models detailed solutions for the textbook questions.
Math in Focus Grade 7 Course 2 B Chapter 10 Lesson 10.4 Answer Key Developing Probability Models
Math in Focus Grade 7 Chapter 10 Lesson 10.4 Guided Practice Answer Key
Complete. Solve.
Question 1.
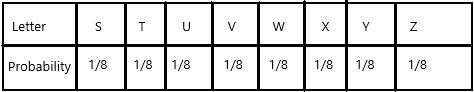
There are eight letter tiles in a bag. The tiles are labeled with the letters from S to Z. June randomly selects a tile from the bag.
a) Define the sample space.
The sample space consists of 8 outcomes.
Sample space = {![]() ,
, ![]() ,
, ![]() ,
, ![]() ,
, ![]() ,
, ![]() ,
, ![]() ,
, ![]() }
}
Answer:
Definition: A sample space is a collection of a set of possible outcomes of a random experiment. The sample space is represented using the symbol, “S”. The subset of possible outcomes of an experiment is called events. A sample space may contain a number of outcomes that depends on the experiment. If it contains a finite number of outcomes, then it is known as discrete or finite sample spaces.
The samples spaces for a random experiment is written within curly braces “ { } “. There is a difference between the sample space and the events. For rolling a die, we will get the sample space, S as {1, 2, 3, 4, 5, 6 } whereas the event can be written as {1, 3, 5 } which represents the set of odd numbers and { 2, 4, 6 } which represents the set of even numbers. The outcomes of an experiment are random and the sample space becomes the universal set for some particular experiments.
Sample space={S, T, U, V, W, X, Y, Z}
It consists of 8 outcomes.
b) What is the probability of selecting a tile with a particular letter?
Every tile has an equal chance of being selected. The probability of selecting a particular tile with a particular letter is ![]() .
.
Answer:
The probability of selecting tiles with each letter=1/8
Probability formula:
To Calculate the probability of an event to occur we use this probability formula, recalling, the probability is the likelihood of an event to happen. This formula is going to help you to get the probability of any particular event.
This formula is the number of favourable outcomes to the total number of all the possible outcomes that we have already decided in the Sample Space.
The probability of an Event = (Number of favourable outcomes) / (Total number of possible outcomes)
P(A) = n(E) / n(S)
P(A) < 1
Here, P(A) means finding the probability of an event A, n(E) means the number of favourable outcomes of an event and n(S) means the set of all possible outcomes of an event.
If the probability of occurring an event is P(A) then the probability of not occurring an event is
P(A’) = 1- P(A)
Sample space={S, T, U, V, W, X, Y, Z}
n(S)=8
Favourable outcomes=1 for each letter
P(A)=1/8
The probability of selecting a tile S=1/8
The probability of selecting a tile T=1/8
The probability of selecting a tile U=1/8
The probability of selecting a tile V=1/8
The probability of selecting a tile W=1/8
The probability of selecting a tile X=1/8
The probability of selecting a tile Y=1/8
The probability of selecting a tile Z=1/8
The probability of selecting a particular tile with a particular letter is 1/8
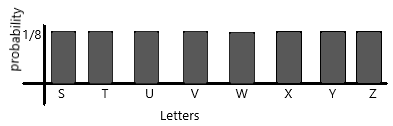
c) Construct the probability model.
Answer:
The probability of selecting a tile S=1/8
The probability of selecting a tile T=1/8
The probability of selecting a tile U=1/8
The probability of selecting a tile V=1/8
The probability of selecting a tile W=1/8
The probability of selecting a tile X=1/8
The probability of selecting a tile Y=1/8
The probability of selecting a tile Z=1/8
The probability of selecting a particular tile with a particular letter is 1/8
d) Present the probability distribution in a bar graph.
Answer:
The probability graph displays a sample as a cumulative distribution, as different from the probability density graph or the histogram. The horizontal axis is the variable x and is usually linear or logarithmic. The vertical axis is a special probability scale derived from the inverse normal distribution function.
Solve.
Question 2.
A number is chosen at random from the list: 1, 4, 7, 12, 21, 25, 38, 40, 45, and 48.
a) Explain why a uniform probability model describes this situation.
Answer:
Definition: A model in which every outcome has equal probability.
Since the choice is random, each number has an equal chance of being chosen. So the probability of each outcome is the same.
b) What is the probability of choosing 25?
Answer:1/10
This formula is the number of favourable outcomes to the total number of all the possible outcomes that we have already decided in the Sample Space.
The probability of an Event = (Number of favourable outcomes) / (Total number of possible outcomes)
P(A) = n(E) / n(S)
P(A) < 1
Here, P(A) means finding the probability of an event A, n(E) means the number of favourable outcomes of an event and n(S) means the set of all possible outcomes of an event.
Sample space={1, 4, 7, 12, 21, 25, 38, 40, 45, 48}
The number of sample space n(S)=10
Number of favourable outcomes=1 for each number
The probability of number 1 is 1/10
The probability of number 4 is 1/10 and so on… continue up to 48
Here the above-given question is probability of number 25
therefore, according to the above definition:
The probability of number 25 is 1/10.
c) T is the event of choosing a number that is a multiple of 3. List all the outcomes that are favorable to event T.
Answer: 12, 21, 45, 48
Explanation:
Sample space={1, 4, 7, 12, 21, 25, 38, 40, 45, 48}
Definition: A probability event can be defined as a set of outcomes of an experiment. In other words, an event in probability is the subset of the respective sample space.
N(T) is the event of choosing a number that is a multiple of 3.
The favourable outcomes of the multiples of 3 are 12, 21, 45, 48.
d) Find P(T).
Answer:
This formula is the number of favourable outcomes to the total number of all the possible outcomes that we have already decided in the Sample Space.
The probability of an Event = (Number of favourable outcomes) / (Total number of possible outcomes)
P(A) = n(E) / n(S)
P(A) < 1
Here, P(A) means finding the probability of an event A, n(E) means the number of favourable outcomes of an event and n(S) means the set of all possible outcomes of an event.
Sample space={1, 4, 7, 12, 21, 25, 38, 40, 45, 48}
The number of sample space n(S)=10
N(T) is the event of choosing a number that is a multiple of 3.
The favourable outcomes of the multiples of 3 are 12, 21, 45, 48.
The number of favourable outcomes n(E)=4
P(T)=4/10
P(T)=2/5
In decimals, we can write 0.4
Question 3.
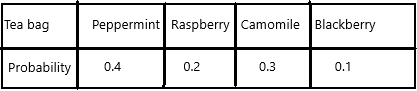
There are 10 herbal tea bags of assorted flavors ¡n a jar: 4 peppermint, 2 raspberry, 3 camomile, and 1 blackberry. Suppose you randomly pick a tea bag from the jar and note the flavor.
a) Define the sample space.
Answer:
Definition: A sample space is a collection of a set of possible outcomes of a random experiment. The sample space is represented using the symbol, “S”. The subset of possible outcomes of an experiment is called events. A sample space may contain a number of outcomes that depends on the experiment. If it contains a finite number of outcomes, then it is known as discrete or finite sample spaces.
The samples spaces for a random experiment is written within curly braces “ { } “. There is a difference between the sample space and the events. For rolling a die, we will get the sample space, S as {1, 2, 3, 4, 5, 6 } whereas the event can be written as {1, 3, 5 } which represents the set of odd numbers and { 2, 4, 6 } which represents the set of even numbers. The outcomes of an experiment are random and the sample space becomes the universal set for some particular experiments.
Sample space={P, P, P, P, R, R, C, C, C, B}
The possible outcomes are 10.
b) What is the probability of picking a raspberry tea bag?
Answer:1/5
Explanation:
Sample space={P, P, P, P, R, R, C, C, C, B}
The possible outcomes=n(S)=10.
The probability of raspberry=n(E)/n(s)
The number of favourable outcomes of raspberry=n(E)=2
P(Raspberry)=2/10
P(raspberry)=1/5
In decimals, we can write 0.2
therefore, the probability of raspberry is 1/5 or 0.2
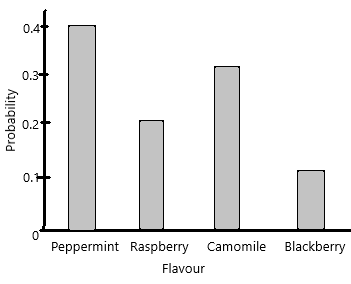
c) Construct the probability model of picking a tea bag. Then use a bar graph to represent the probability distribution.
Answer:
Sample space={P, P, P, P, R, R, C, C, C, B}
The possible outcomes=n(S)=10.
The probability of raspberry=n(E)/n(s)
The number of favourable outcomes of raspberry=n(E)=2
P(Raspberry)=2/10
P(raspberry)=1/5
In decimals, we can write 0.2
The probability of peppermint=4/10=2/5=0.4
The probability of Camomile=3/10=0.3
The probability of balckberry=1/10=0.1
Question 4.
Nine cards are made from each of the letters from the word “BEGINNING”. You select a card at random.
a) Find the probability of getting a letter N.
Answer:1/3
This formula is the number of favourable outcomes to the total number of all the possible outcomes that we have already decided in the Sample Space.
The probability of an Event = (Number of favourable outcomes) / (Total number of possible outcomes)
P(A) = n(E) / n(S)
P(A) < 1
Here, P(A) means finding the probability of an event A, n(E) means the number of favourable outcomes of an event and n(S) means the set of all possible outcomes of an event.
Sample space={B, E, G, I, N, N, I, N, G}
The number of possible outcomes n(S)=9
The number of favourable outcomes of ‘N’=n(E)=3
the above-given was the probability of ‘N’.
P(N)=3/9
P(N)=1/3
therefore, the probability of getting N is 1/3.
b) Construct the probability model.
Answer:
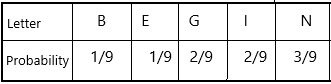
Sample space={B, E, G, I, N, N, I, N, G}
The number of possible outcomes n(S)=9
The probability of getting B is 1/9
The probability of getting E is 1/9
The probability of getting G is 2/9
The probability of getting I 2/9
The probability of getting N is 3/9
c) What is the probability of selecting a card with a consonant?
Answer:2/3
Sample space={B, E, G, I, N, N, I, N, G}
The number of possible outcomes n(S)=9
The consonants of a given word are B, G, N
The number of favourable outcomes of consonants n(E)=6 (1+2+3)
The probability of getting B is 1/9
The probability of getting G is 2/9
The probability of getting N is 3/9
Now we have to find out the probability of consonants:
P(S)=6/9
P(S)=2/3
therefore, the probability of selecting a card with a consonant is 2/3.
Question 5.
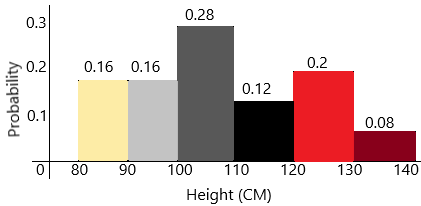
The data below show the heights, in centimetres, of 25 tomato plants in a greenhouse.
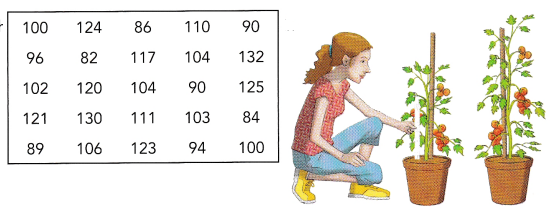
a) Group the heights into 6 intervals: 80-89, 90-99, 100-109, 110-119, 120-129, and 130-139.
Answer:
Check the above data and write the intervals according to that.
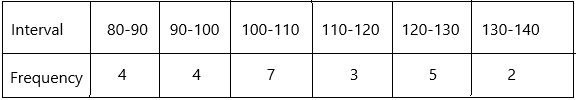
Here count the number of frequencies and write into the box.
The interval of 80-90 is 4
The interval of 90-100 is 4
The interval of 100-110 is 7
The interval of 110-120 is 3
The interval of 120-130 is 5
The interval of 130-140 is 2
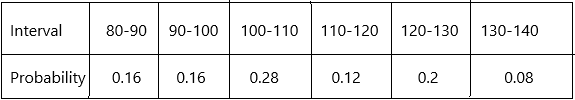
b) Find the relative frequencies of the 6 intervals. Construct the probability model.
Answer:
The interval of 80-90 is 4
The interval of 90-100 is 4
The interval of 100-110 is 7
The interval of 110-120 is 3
The interval of 120-130 is 5
The interval of 130-140 is 2
the total frequency is 4+4+7+3+5+2=25
We can find the relative frequency probability in the following way if we know the above two frequencies. The formula for a subgroup is;
Relative Frequency = Subgroup Count / Total Count
The relative frequency of interval 80-90=4/25
In decimal, we can write:0.16
The relative frequency of interval 90-100=4/25
In decimal, we can write:0.16
The relative frequency of interval 100-110=7/25
In decimal, we can write:0.28
The relative frequency of interval 110-129=3/25
In decimal, we can write:0.12
the relative frequency of interval 12-130=5/25=1/5
In decimal, we can write:0.2
The relative frequency of interval 130-140=2/25
In decimal, we can write:0.08
Probability model:
c) Represent the probability distribution in a histogram. State which type of probability distribution you have drawn.
Answer:
probability distribution:
Probability distribution yields the possible outcomes for any random event. It is also defined based on the underlying sample space as a set of possible outcomes of any random experiment. These settings could be a set of real numbers or a set of vectors or a set of any entities. It is a part of probability and statistics.
A non-uniform distribution is just any distribution where the probabilities are not the same.
It is a non-uniform probability distribution.
d) A plant is selected at random. What is the probability of selecting a plant whose height is greater than or equal to 100, but less than 120 centimeters tall?
Answer:
This formula is the number of favourable outcomes to the total number of all the possible outcomes that we have already decided in the Sample Space.
The probability of an Event = (Number of favourable outcomes) / (Total number of possible outcomes)
P(A) = n(E) / n(S)
P(A) < 1
Here, P(A) means finding the probability of an event A, n(E) means the number of favourable outcomes of an event and n(S) means the set of all possible outcomes of an event.
The probability of selecting a plant whose height is greater than or equal to 100, but less than 120 centimetres tall=P(A)
The number of favourable outcomes=n(E)=7+3=10
The total number of possible outcomes=n(S)=25
P(A)=10/25
P(A)=2/5
In decimals, we can write as 0.4
Therefore, the probability of selecting heights between 100 to 120 is 0.4 or 2/5.
Hands-On Activity
Materials
random number table
COMPARE AN EXPERIMENTAL PROBABILITY MODEL TO A THEORETICAL PROBABILITY MODEL
Work in pairs.
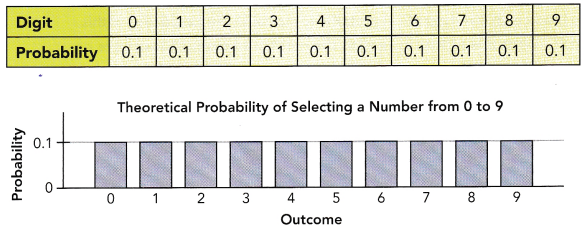
Suppose one of the digits from 0 to 9 is randomly selected. This is a theoretical uniform probability model. The probability distribution table and bar graph are given below.
Step 1: Choose any row or column of a random number table. Circle every other digit until you have circled 50 digits. Two rows of the random number table with sample digits are shown below:
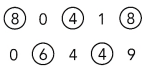
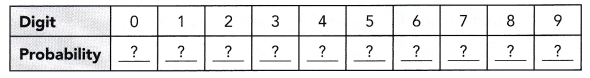
Step 2: Use the digits you circled. Find the relative frequency for each digit from 0 to 9. Each digit’s relative frequency is the experimental probability of randomly choosing that digit. Record your results in a probability model like the one shown below.
Step 3: Present the probability distribution from Step 2 in a bar graph.
Step 4: Use a different row or column of the random number table and repeat step 1 so that you circle an additional 50 digits.
Step 5: You have now circled 100 digits. Find the relative frequency for each digit when the total number of circled digits is 100. The experimental probability of each randomly chosen digit (the relative frequency of the digit) is based on 100 observations. Record your results in a probability model like the one shown in Step 2.
Step 6: Present the probability distribution from Step 5 in a bar graph.
Math Journal Compare each of the experimental probability models you made with the theoretical probability model at the beginning of this activity. What effect does increasing the number of digits chosen have on the experimental probabilities? Which experimental probability model resembles the theoretical probability model more closely? Explain.
Answer:
Math in Focus Course 2B Practice 10.4 Answer Key
Solve.
Question 1.
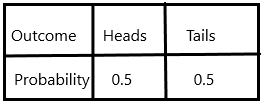
You toss a fair coin and record whether it lands on heads or tails.
a) Define the sample space.
Answer:
Definition: A sample space is a collection of a set of possible outcomes of a random experiment. The sample space is represented using the symbol, “S”. The subset of possible outcomes of an experiment is called events. A sample space may contain a number of outcomes that depends on the experiment. If it contains a finite number of outcomes, then it is known as discrete or finite sample spaces.
The samples spaces for a random experiment is written within curly braces “ { } “. There is a difference between the sample space and the events. For rolling a die, we will get the sample space, S as {1, 2, 3, 4, 5, 6 } whereas the event can be written as {1, 3, 5 } which represents the set of odd numbers and { 2, 4, 6 } which represents the set of even numbers. The outcomes of an experiment are random and the sample space becomes the universal set for some particular experiments.
Sample space={heads, tails}
b) What is the probability of the coin landing on heads?
Answer:1/2
The answer to this is always going to be 50/50, or ½, or 50%. Every flip of the coin has an “ independent probability”, meaning that the probability that the coin will come up heads or tails is only affected by the toss of the coin itself.
The probability of an Event = (Number of favourable outcomes) / (Total number of possible outcomes)
P(A) = n(E) / n(S)
P(A) < 1
Here, P(A) means finding the probability of an event A, n(E) means the number of favourable outcomes of an event and n(S) means the set of all possible outcomes of an event.
Sample space={heads, tails}
n(E)=1
n(S)=2
P(A)=1/2.
c) Construct the probability model.
Answer:
The probability of an Event = (Number of favourable outcomes) / (Total number of possible outcomes)
P(A) = n(E) / n(S)
P(A) < 1
Here, P(A) means finding the probability of an event A, n(E) means the number of favourable outcomes of an event and n(S) means the set of all possible outcomes of an event.
Sample space={heads, tails}
n(E)=1
n(S)=2
P(heads)=1/2=0.5
P(tails)=1/2=0.5
d) Present the probability distribution in a bar graph.
Answer:
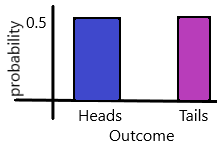
In Statistics, the probability distribution gives the possibility of each outcome of a random experiment or event. It provides the probabilities of different possible occurrences.
Question 2.
A fair icosahedron number die is a 20-faced number die which has values from 1 to 20 on its faces. You roll a fair icosahedron number die and record the number on the face the number die rests on when it lands.
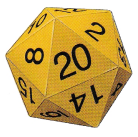
a) Define the sample space.
Answer:
Definition: A sample space is a collection of a set of possible outcomes of a random experiment. The sample space is represented using the symbol, “S”. The subset of possible outcomes of an experiment is called events. A sample space may contain a number of outcomes that depends on the experiment. If it contains a finite number of outcomes, then it is known as discrete or finite sample spaces.
The samples spaces for a random experiment is written within curly braces “ { } “. There is a difference between the sample space and the events. For rolling a die, we will get the sample space, S as {1, 2, 3, 4, 5, 6 } whereas the event can be written as {1, 3, 5 } which represents the set of odd numbers and { 2, 4, 6 } which represents the set of even numbers. The outcomes of an experiment are random and the sample space becomes the universal set for some particular experiments.
b) What is the probability of rolling a 14?
Answer:
The roll of a dice={1, 2, 3, 4, 5, 6, 7, 8, 9, 10, 11, 12, 13, 14, 15, 16, 17, 18, 19, 20}
This formula is the number of favourable outcomes to the total number of all the possible outcomes that we have already decided in the Sample Space.
The probability of an Event = (Number of favourable outcomes) / (Total number of possible outcomes)
P(A) = n(E) / n(S)
P(A) < 1
Here, P(A) means finding the probability of an event A, n(E) means the number of favourable outcomes of an event and n(S) means the set of all possible outcomes of an event.
The number of possible outcomes=n(E)=1 for each
The total outcomes=n(S)=20
P(A)=1/20
the probability of rolling dice 1 = 1/20
The probability of rolling dice 2 = 1/20
Here asked the probability of rolling dice 1 is also 1/20.
c) Construct a probability model of all possible values.
Answer:
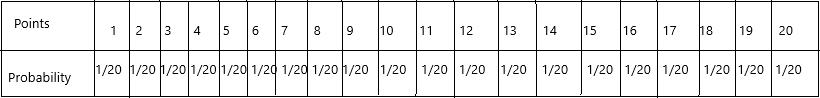
The probability of rolling dice 1 = 1/20
The probability of rolling dice 2 = 1/20
The probability of rolling dice 3 = 1/20
The probability of rolling dice 4 = 1/20
The probability of rolling dice 5 = 1/20
The probability of rolling dice 6 = 1/20
The probability of rolling dice 7 = 1/20
The probability of rolling dice 8 = 1/20
The probability of rolling dice 9 = 1/20
The probability of rolling dice 10 = 1/20
and so on…
The probability of rolling dice 20 = 1/20
d) If A is the event of rolling a prime number, find P(A).
Answer:
The prime numbers from 1 to 20 are 2, 3, 5, 7, 11, 13, 17, and 19
The probability of an Event = (Number of favourable outcomes) / (Total number of possible outcomes)
P(A) = n(E) / n(S)
P(A) < 1
Here, P(A) means finding the probability of an event A, n(E) means the number of favourable outcomes of an event and n(S) means the set of all possible outcomes of an event.
the number of possible outcomes=n(E)=8
The total outcomes=n(S)=20
P(A)=8/20
P(A)=2/5
therefore, the probability of rolling a prime number is 2/5.
e) If 8 is the event of rolling a number divisible by 4, find P(B).
Answer:
The roll of a dice={1, 2, 3, 4, 5, 6, 7, 8, 9, 10, 11, 12, 13, 14, 15, 16, 17, 18, 19, 20}
The event is the numbers divisible by 4. Those numbers are 4, 8, 12, 16, 20
The probability of an Event = (Number of favourable outcomes) / (Total number of possible outcomes)
P(B) = n(E) / n(S)
P(B) < 1
Here, P(B) means finding the probability of an event A, n(E) means the number of favourable outcomes of an event and n(S) means the set of all possible outcomes of an event.
The number of outcomes=5
The total outcomes=20
P(B)=5/20
P(B)=1/4
therefore, the probability is 1/4 or 0.25
Question 3.
The spinner shown is used in a game. Before spinning the wheel, a player is given 50 points. The player then spins the wheel and adds the points indicated by the red arrow to the 50 points he or she was given. The spinner has an equal chance of landing on any one of the sections.
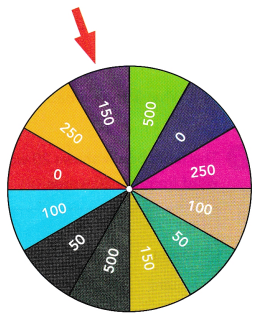
a) List all the possible outcomes of the game.
Answer:
The possible outcomes are {150, 500, 0, 250, 100, 50, 150, 500, 50, 100, 0, 250}
the number of possible outcomes are 12.
b) What is the probability of getting a total of 100 points?
Answer:
Sample space={150, 500, 0, 250, 100, 50, 150, 500, 50, 100, 0, 250}
The probability of getting a total of 100 points=P(A)
The probability of an Event = (Number of favourable outcomes) / (Total number of possible outcomes)
P(A) = n(E) / n(S)
P(A) < 1
Here, P(A) means finding the probability of an event A, n(E) means the number of favourable outcomes of an event and n(S) means the set of all possible outcomes of an event.
The number of possible outcomes of 100 is n(E)=2
The total outcomes=12
P(A)=2/12
P(A)=1/6
Therefore, the probability is 1/6
c) Construct a probability model for all possible outcomes.
Answer:
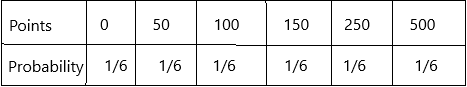
The probability of point 0 is 2/12=1/6
The probability of point 50 is 2/12=1/6
The probability of point 100 is 2/12=1/6
The probability of point 150 is 2/12=1/6
The probability of point 250 is 2/12=1/6
The probability of point 500 is 2/12=1/6
And moreover, it is a uniform probability model.
d) Is the probability distribution uniform? State your reason.
Answer: Yes, it is a probability distribution uniform.
In probability theory and statistics, a probability distribution is a mathematical function that can be thought of as providing the probabilities of occurrence of different possible outcomes in an experiment. For instance, if the random variable X is used to denote the outcome of a coin toss (“the experiment”), then the probability distribution of X would take the value 0.5 for X = heads, and 0.5 for X = tails (assuming the coin is fair).
e) If G is the event of getting a total of 300 points, find P(G).
Answer:
if we add 250 and 50 or 150+150
P(G) is the event of getting 300 points.
A probability event can be defined as a set of outcomes of an experiment. In other words, an event in probability is the subset of the respective sample space.
sample space={150, 150, 50, 250}
Sample space={(150,150) (50, 250)}
P(G)=2/4
P(G)=1/2
Question 4.
Math Journal Tell whether you agree or disagree with the statement below. Explain your reasoning.
All events having the same number of outcomes have equal probability in a uniform probability distribution.
Answer: yes, I agree with the statement given.
In statistics, uniform distribution is a term used to describe a form of probability distribution where every possible outcome has an equal likelihood of happening. The probability is constant since each variable has equal chances of being the outcome.
Question 5.
A rectangular wooden block is painted gold on one large face and white on the other large face. The other four faces are painted green. After tossing the block many times. Sue finds that the block lands on the gold face one-third of the time. She also finds that the block has a 4% chance of landing on a green face.

a) Describe all the types of outcomes of tossing the block.
Answer: Gold, white, green
Sue finds that when the block is tossed 1/3rd of the block was a gold face and other face was white and a 4% chance of landing is on the green face.
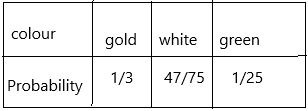
b) Construct a probability model for all the outcomes. Write the probabilities as fractions. Is the model a uniform probability model?
Answer:
The probability of an Event = (Number of favourable outcomes) / (Total number of possible outcomes)
P(A) = n(E) / n(S)
P(A) < 1
Here, P(A) means finding the probability of an event A, n(E) means the number of favourable outcomes of an event and n(S) means the set of all possible outcomes of an event.
The probability of gold face=2/6=1/3
The probability of green face=4/6=2/3=0.04=4/100=1/25
The probability of white face=47/75
Here total 100%. In that 100%, the green face is 4% which is nothing but 1/25. and the remaining 75 will be gold and white face. The gold face is given 1/3 and the remaining is the white face.
And it is not a uniform probability model.
c) What is the probability that the block lands on the white face?
Answer:
The probability of an Event = (Number of favourable outcomes) / (Total number of possible outcomes)
P(A) = n(E) / n(S)
P(A) < 1
Here, P(A) means finding the probability of an event A, n(E) means the number of favourable outcomes of an event and n(S) means the set of all possible outcomes of an event.
The probability of gold face=1/3
The probability of green face=4/100=1/25
The probability of white face=47/75
Here total 100%. In that 100%, the green face is 4% which is nothing but 1/25. and the remaining 75 will be gold and white face. The gold face is given 1/3 and the remaining is the white face.
Question 6.
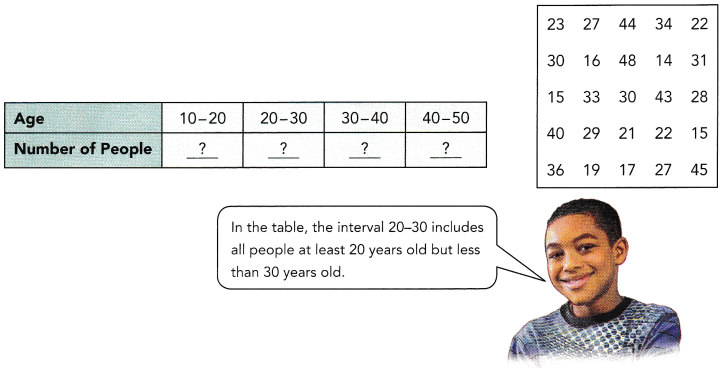
The data show the ages of 25 people in a group. A person is selected at random from the group.
a) Copy and complete the following frequency table.
Answer:
Frequency refers to the number of times an event or a value occurs. A frequency table is a table that lists items and shows the number of times the items occur. We represent the frequency by the English alphabet ‘f’.
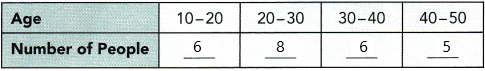
Count the numbers between the given intervals.
The frequency of the interval 10-20=6
The frequency of the interval 20-30=8
The frequency of the interval 30-40=6
the frequency of the interval=40-50=5
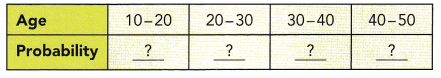
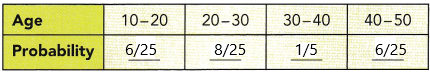
b) Copy and complete the following probability model.
Answer:
This formula is the number of favourable outcomes to the total number of all the possible outcomes that we have already decided in the Sample Space.
The probability of an Event = (Number of favourable outcomes) / (Total number of possible outcomes)
P(A) = n(E) / n(S)
P(A) < 1
Here, P(A) means finding the probability of an event A, n(E) means the number of favourable outcomes of an event and n(S) means the set of all possible outcomes of an event.
The probability of the interval 10-20=6/25
The probability of the interval 20-30=8/25
The probability of the interval 30-40=5/25=1/5
The probability of the interval 40-50=6/25
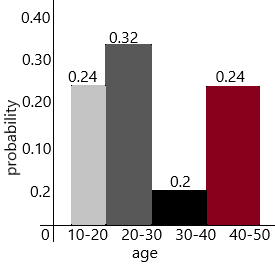
c) Present the probability distribution in a histogram.
Answer:
The probability of the interval is 10-20=6/25=0.24
The probability of the interval 20-30=8/25=0.32
The probability of the interval 30-40=5/25=1/5=0.2
The probability of the interval 40-50=6/25=0.24
d) What is the probability that the selected person’s age is 30 or above?
Answer:
The probability of the interval 30-40=5/25=1/5=0.2
The probability of the interval 40-50=6/25=0.24
The probability of an Event = (Number of favourable outcomes) / (Total number of possible outcomes)
P(A) = n(E) / n(S)
P(A) < 1
Here, P(A) means finding the probability of an event A, n(E) means the number of favourable outcomes of an event and n(S) means the set of all possible outcomes of an event.
P(A)=5+6/25
P(A)=11/25
Therefore, the probability is 11/25
Question 7.
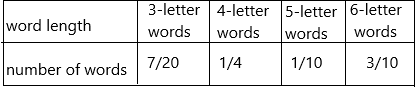
The table below shows 20 words taken from a novel. You randomly select a word from the 20 words.
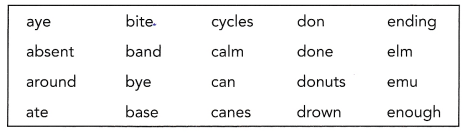
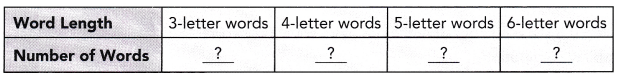
a) Complete the following frequency table.
Answer:
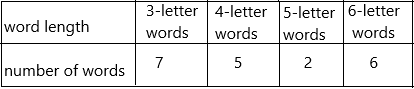
Count the words and make a frequency table
The frequency of 3-letter words=7
The frequency of 4-letter words=5
The frequency of 5-letter words=2
The frequency of 6-letter words=6
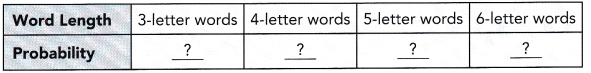
b) Complete the following probability distribution table.
Answer:
The probability of an Event = (Number of favourable outcomes) / (Total number of possible outcomes)
P(A) = n(E) / n(S)
P(A) < 1
Here, P(A) means finding the probability of an event A, n(E) means the number of favourable outcomes of an event and n(S) means the set of all possible outcomes of an event.
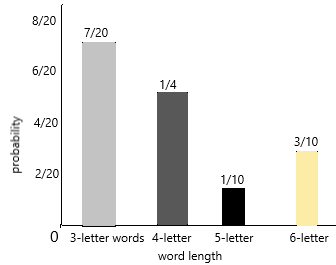
The probability of 3-letter word=7/20
The probability of 4-letter word=5/20=1/4
The probability of 5-letter word=2/20=1/10
The probability of 6-letter word=6/20=3/10
c) Present the probability distribution in a bar graph.
Answer:
Probability distribution yields the possible outcomes for any random event. It is also defined based on the underlying sample space as a set of possible outcomes of any random experiment. These settings could be a set of real numbers or a set of vectors or a set of any entities. It is a part of probability and statistics.
d) What is the probability of selecting a word with at most 5 letters?
Answer:
“At most” is a probability statement, which means that the probability that a particular event will occur is less than the probability that it will not occur.
The probability of 3-letter word=7/20
The probability of 4-letter word=5/20=1/4
The probability of 5-letter word=2/20=1/10
the probability of selecting a word with at most 5 letters=P(A)
P(A)=7/20+5/20+2/20
P(a)14/20
P(A)=7/10
Therefore, the probability of selecting a word with at most 5 letters.
Question 8.
A quiz has three True-False questions. The correct answers, in order, are True-True-False (TTF). A student does not know any of the answers and decides to guess.
a) Give the sample space of all the possible outcomes for the student guessing the three answers.
Answer:
In the above-given question:
The order of the correct answers is True-True-False (TTF)
So if the student does not know any answer then there is a chance of guessing the answers.
The possibility of guessing answers is TFT, FTF, FFT, FTT, TFF
Sample space={TFT, FTF, FFT, FTT, TFF}
the possible outcomes are 5
b) Is this situation an example of a uniform probability model? Explain.
Answer: No, this is not a uniform probability model.
Explanation:
Uniform probability model: a model in which every outcome has equal probability.
Uniform probability models can be used to determine the probabilities of events.
Sample space={TFT, FTF, FFT, FTT, TFF}
The total number of outcomes=5
The possible outcomes=3
c) Construct a probability distribution table for the model.
Answer:
The probability distribution table for correct order answers:
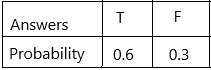
the correct answer order is TTF
The number of possible outcomes for T is 2
The number of possible outcomes for F is 1
The total number of outcomes=3
The probability of T is 2/3
The probability of F is 1/3
d) What is the probability that the student gets all three answers correct?
Answer:1/3
This formula is the number of favourable outcomes to the total number of all the possible outcomes that we have already decided in the Sample Space.
The probability of an Event = (Number of favourable outcomes) / (Total number of possible outcomes)
P(A) = n(E) / n(S)
P(A) < 1
Here, P(A) means finding the probability of an event A, n(E) means the number of favourable outcomes of an event and n(S) means the set of all possible outcomes of an event.
P(A)=Probability that the student gets all three answers correct.
n(E)=The possible outcomes are 1
n(S)=Total outcomes are 3
P(A)=1/3
P9A)=0.3
e) Let X be the event that the student gets only two correct answers. List all the possible outcomes of event X.
Answer:
the correct order is TTF
P(X) is the event that the student gets only two correct answers.
The possible outcomes of event X is TFF, FTF
the number of possible outcomes are 2.
sample space={TFF, FTF}.
f) Find P(X).
Answer:
The probability of an Event = (Number of favourable outcomes) / (Total number of possible outcomes)
P(A) = n(E) / n(S)
P(A) < 1
Here, P(A) means finding the probability of an event A, n(E) means the number of favourable outcomes of an event and n(S) means the set of all possible outcomes of an event.
sample space={TFF, FTF}.
The number of favourable outcomes=1 for each
The total number of possible outcomes=2
P(X)=1/2
p(X)=0.5
g) Math Journal Suppose you don’t know that the correct answers, in order, are True-True-False. Would you be able to answer e) and f)? Explain.
Answer: No we cannot answer.
Explanation:
It does not give the correct order we need to assume our own and there might be a chance of the answers are wrong.
we cannot write possible outcomes without knowing the correct answers.
The probability formula is used to compute the probability of an event to occur. To recall, the likelihood of an event happening is called probability. When a random experiment is entertained, one of the first questions that come in our mind is: What is the probability that a certain event occurs? A probability is a chance of prediction. When we assume that, let’s say, x be the chances of happening an event then at the same time (1-x) are the chances for “not happening” of an event.
Similarly, if the probability of an event occurring is “a” and an independent probability is “b”, then the probability of both the event occurring is “ab”. We can use the formula to find the chances of an event happening.
The formula for the probability of an event is:
P(A)=Number of favourable outcomes/Total number of favourable outcomes.
Brain Work
In a game, you and your friend are asked to choose a number. The number is randomly selected from a set of ten numbers from 1 to 10. Your friend chooses a card from the pack. Then you choose a card from the ones remaining in the pack. You do not know your friend’s number. You win if the difference between your number and your friend’s number is at least 3.
a) For which of your friend’s numbers do you have the greatest chance of winning?
Answer:
The set of numbers are 1, 2, 3, 4, 5, 6, 7, 8, 9, 10
If your friend picks number 1 or number 10 then you will have the greatest chance of winning.
here at least 3 differences should be there for a chance of winning. At least means x ≥ 3.
b) For which of your friend’s numbers do you have the least chance of winning?
Answer:
If your friend picks 3, 4, 5, 6, 7, 8, 9 then you will have the least chance of winning.
c) What is the probability that you will win?
Answer:56/90
This formula is the number of favourable outcomes to the total number of all the possible outcomes that we have already decided in the Sample Space.
The probability of an Event = (Number of favourable outcomes) / (Total number of possible outcomes)
P(A) = n(E) / n(S)
P(A) < 1
Here, P(A) means finding the probability of an event A, n(E) means the number of favourable outcomes of an event and n(S) means the set of all possible outcomes of an event.
First, consider the greater than or equal to sign then the chances are from 3, 4, 5, 6, 7, 8, 9, 10 (8 possibilities)
Next, check out greater than a symbol then the possibilities 4, 5, 6, 7, 8, 9, 10 (7 possibilities)
The number of possibilities=8*7=n(E)=56
Already friend picks one card out of 10 cards. Then the remaining cards are 9. The total cards are 10.
Multiply 9 and 10
Total number of possibilities=10*9=90
P(A)=56/90