This handy Math in Focus Grade 7 Workbook Answer Key Chapter 10 Lesson 10.3 Approximating Probability and Relative Frequency detailed solutions for the textbook questions.
Math in Focus Grade 7 Course 2 B Chapter 10 Lesson 10.3 Answer Key Approximating Probability and Relative Frequency
Hands-On Activity
Materials
- a coin
FIND RELATIVE FREQUENCIES OF FLIPPING A COIN
Work in pairs.
Step 1: Flip a coin 20 times. Record whether it lands heads or tails after each flip. The table below shows that the number of times the coin landed heads and the number of times it landed tails.
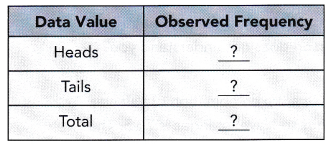
The observed frequency is the number of observations of a data value. It refers to how many times a data value appears in the chance process.
Step 2: What is the observed frequency of the coin landing on heads? What is the observed frequency of the coin landing on tails?
The relative frequency of a data value is the ratio of the observed frequency to the total number of observations in a chance process. Relative frequency can be calculated from the observed frequency.
![]()
Step 3: What is the relative frequency of the coin landing on heads? What ¡s the relative frequency of the coin landing on tails?
Step 4: What is the sum of the relative frequencies?
Math in Focus Grade 7 Chapter 10 Lesson 10.3 Guided Practice Answer Key
Complete.
Question 1.
The table shows the relative frequencies for three sizes of monitors sold during a sale at a computer store. 640 monitors were sold during the sale.
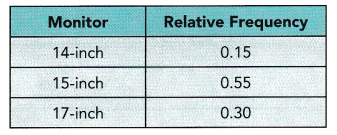
Each relative frequency represents a fraction of the total number of monitors sold. The sum of the relative frequencies is 1. 0.15 + 0.55 + 0.30 = 1
a) How many 17-inch monitors were sold during the sale?
The relative frequency 0.30 means that \(\frac{30}{100}\) of the 640 monitors sold were 17-inch monitors.
![]() • 640 =
• 640 = ![]()
Multiply the relative frequency for 17-inch monitors by the total number of monitors sold.
![]() 17-inch monitors were sold during the sale.
17-inch monitors were sold during the sale.
Answer: 0.30;192
Explanation:
The number of times an event occurs is called a frequency. Relative frequency is an experimental one, but not a theoretical one. Since it is an experimental one, it is possible to obtain different relative frequencies when we repeat the experiments. To calculate the frequency we need
– Frequency count for the total population
– Frequency count for a subgroup of the population
We can find the relative frequency probability in the following way if we know the above two frequencies. The formula for a subgroup is
Relative Frequency = Subgroup Count / Total Count
The relative frequency 0.30 means that \(\frac{30}{100}\) of the 640 monitors sold were 17-inch monitors: 0.30*640=192.
Therefore, 192 17-inch monitors were sold during the sale.
b) How many fewer 14-inch monitors were sold than 15-inch monitors?
![]() • 640 =
• 640 = ![]() Find the number of 14-inch monitors.
Find the number of 14-inch monitors.
![]() • 640 =
• 640 = ![]() Find the number of 15-inch monitors.
Find the number of 15-inch monitors.
![]() –
– ![]() =
= ![]() Subtract the number of 14-inch monitors from the number of 15-inch monitors.
Subtract the number of 14-inch monitors from the number of 15-inch monitors.
There are ![]() fewer 14-inch monitors sold than 15-inch monitors.
fewer 14-inch monitors sold than 15-inch monitors.
Answer:
The relative frequency of 14-inch monitor=0.15
the relative frequency of a 15-inch monitor=0.55
Now we need to find out the number of monitors that were sold.
The number of 14-inch monitors=0.15*640=96
The number of 15-inch monitors=0.55*640=352
To know the number of fewer 14-inch monitors were sold than 15-inch monitors. We need to subtract.
: 352-96=256
therefore, 256 fewer 14-inch monitors sold than 15-inch monitors.
Copy and complete. Solve.
Question 2.
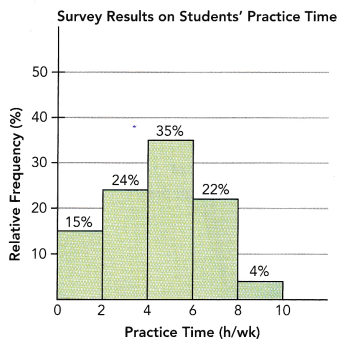
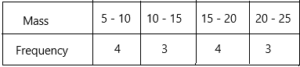
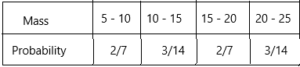
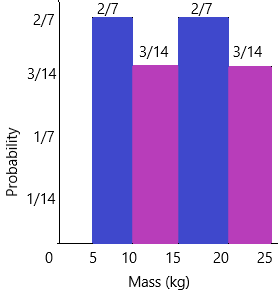
Alexis and Joe caught 40 fish over the weekend. The histogram shows the masses of the fish they caught. On the histogram, the interval 14-16 includes data for fish that have a mass of at least 14 kilograms, but less than 16 kilograms.
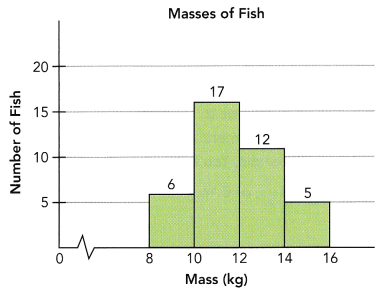
a) Find the relative frequency for fish that have a mass of at least 8 kilograms but less than 10 kilograms. Give your answer as a percent.
There are ![]() fish that have a mass of at least 8 kilograms but less than 10 kilograms.
fish that have a mass of at least 8 kilograms but less than 10 kilograms.
![]() =
= ![]() Write
Write ![]() out of 40 fish as a fraction and simplify.
out of 40 fish as a fraction and simplify.
![]() ∙ 100% =
∙ 100% = ![]() Multiply by 100%
Multiply by 100%
The relative frequency for fish that have a mass of at least 8 kilograms but less than 10 kilograms is ![]() %.
%.
Answer:
According to the above-given histogram:
There are 6 fish that have a mass of at least 8 kilograms but less than 10 kilograms.
Infractions, 6/40 is equal to 3/20.
To convert into percentage multiply by100%
=3/20*100
=15%
Therefore, the relative frequency for fish that have a mass of at least 8 kilograms but less than 10 kilograms is
b) Draw a relative frequency histogram using percent.
![]() ∙ 100% =
∙ 100% = ![]()
Find the relative frequency of fish that have a mass of at least 10 kilograms but less than 12 kilograms.
![]() ∙ 100% =
∙ 100% = ![]()
Find the relative frequency of fish that have a mass of at least 12 kilograms but less than 14 kilograms.
![]() ∙ 100% =
∙ 100% = ![]() Find the relative frequency of fish that have a mass of at least 14 kilograms but less than 16 kilograms.
Find the relative frequency of fish that have a mass of at least 14 kilograms but less than 16 kilograms.
Answer:
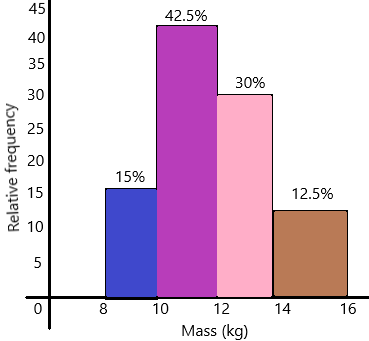
The relative frequency using percentage:
1. 6/40*100=15%
2. The relative frequency of fish that have a mass of at least 10 kilograms but less than 12 kilograms.
: 17/40*100=42.5%
3. The relative frequency of fish that have a mass of at least 12 kilograms but less than 14 kilograms.
: 12/40*100=30%
4. The relative frequency of fish that have a mass of at least 14 kilograms but less than 16 kilograms.
: 5/40*100=12.5%
Question 3.
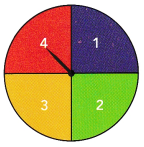
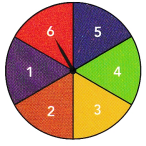
Lucas made a dartboard as shown in the diagram. He threw a dart at the dartboard 100 times. He recorded the number of times the dart landed on each color. The number of times he missed hitting the dartboard was also recorded.
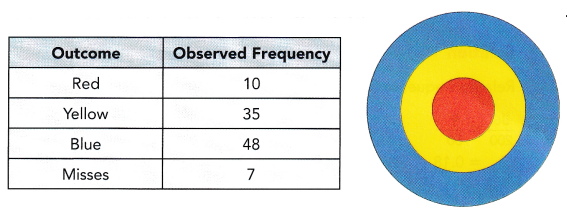
a) Find the relative frequency, expressed as a decimal, for each event.
![]() =
= ![]() Find the relative frequency of landing on red.
Find the relative frequency of landing on red.
= ![]() Write the fraction as a decimal.
Write the fraction as a decimal.
![]() =
= ![]() Find the relative of landing on yellow.
Find the relative of landing on yellow.
= ![]() Write the fraction as a decimal.
Write the fraction as a decimal.
![]() =
= ![]() Find the relative frequency of landing on blue.
Find the relative frequency of landing on blue.
= ![]() Write the fraction as a decimal.
Write the fraction as a decimal.
![]() =
= ![]() Find the relative frequency of misses.
Find the relative frequency of misses.
= ![]() Write the fraction as a decimal.
Write the fraction as a decimal.
Answer:
Formula:
Relative frequency=subgroup count/total count
The relative frequency of landing on red=10/100
Therefore, the relative frequency is 1/10
In decimal, we can write as 0.1
The relative frequency of landing on yellow=35/100
Therefore, the relative frequency is 7/20
In decimal, we can write as 0.35
The relative frequency of landing on blue=48/100
Therefore, the relative frequency is 12/25
In decimal, we can write as 0.48
The relative frequency of misses=7/100
Therefore, the relative frequency is 7/100
In decimal, we can write as 0.07
b) Explain what the relative frequency of the dart landing in the red region means.
The event of landing in the red region has a relative frequency of ![]() , which means that the dart landed in the red region about of the time.
, which means that the dart landed in the red region about of the time.
Answer:0.1 and 10%
The event of landing in the red region has a relative frequency of 0.1, which means that the dart landed in the red region about of the time.
c) If Lucas throws the dart again, predict in which region the dart is most likely to land.
The dart is most likely to land in the ![]() region, because it has the greatest relative frequency of
region, because it has the greatest relative frequency of ![]() .
.
Answer: blue, o.48
Explanation:
The relative frequency of red is 0.1
The relative frequency of yellow is 0.35
The relative frequency of blue is 0.48
By comparing all the frequencies, definitely, the dart is most likely to land in the blue region because it has the highest relative frequency of 0.48.
Hands-On Activity
Materials:
- 10 counters (5 red,
- 3 blue, and 2 green)
- a paper bag
Work in pairs.
Step 1: Place the 10 counters into the bag. Shake the bag to mix the counters. Without looking into the bag, select a counter randomly. Record its color in a tally chart, and then put the counter back in the bag. Repeat this procedure 20 times.
Step 2: Combine your group’s data from Step 1 with data from other groups. Use the class data to make a relative frequency table like the one shown below.
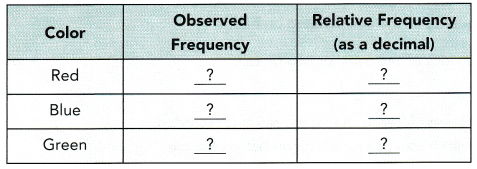
Step 3: Find the theoretical probabilities for the colors. Copy and complete the table below.
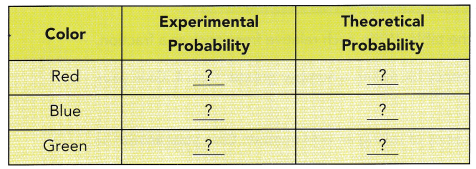
Step 4: Compare the experimental and the theoretical probabilities for each color. What do you observe?
Math in Focus Course 2B Practice 10.3 Answer Key
Solve.
Question 1.
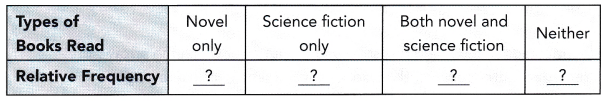
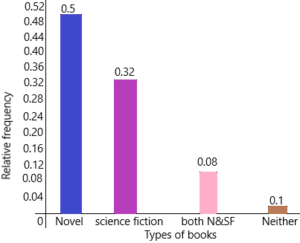
A library conducted a survey on 2,000 library users about the types of books they usually borrow. The table shows the relative frequencies of the types of books borrowed.
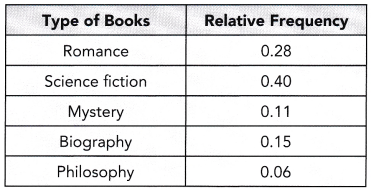
a) How many library users borrowed biography titles?
Answer:
Relative frequency=observed frequency of data value/total number of observations
Here we know the relative frequency and observed frequency data.
Number of library users borrowed biography tiles=X
this can be write as:
0.15=2000/X
Send ‘X’ on the left side and bring relative frequency to the right side.
X=2000*0.15
X=300
therefore, 300 biography titles were borrowed.
b) What percent of the library users borrowed mystery titles?
Answer:
The relative frequency of mystery tiles=0.11
The observed frequency data=2000
The per cent of the library users borrowed mystery tiles=Y
Relative frequency=observed frequency of data value/total number of observations
Y=0.11*100
Y=11%
c) What percent of the library users borrowed romance or science fiction titles?
Answer:
the relative frequency of romance=0.28
the relative frequency of science fiction titles=0.40
The percent of the library users borrowed romance or science fiction titles=Z
Z=0.28+0.40
Z=0.68
This we can write in percentages by multiplying 100
Z=0.68*100
Z=68%
therefore, 68% of the library users borrowed romance and science fiction titles.
Question 2.
A coin is tossed 66 times and lands on heads 36 times.
a) Find the relative frequency of the coin landing on heads.
Answer:
Formula:
Relative frequency=observed frequency of data value/total number of observations
The total number of observations=66
Observed frequency=36
Relative frequency=X
According to the formula, substitute the above-given values:
X=36/66
X=6/11
In decimal, we can write as 0.54
b) Find the relative frequency of the coin landing on tails.
Answer:
Relative frequency=observed frequency of data value/total number of observations
The total number of observations=66
Observed frequency for the coin landing on head=36
Observed frequency for the coin landing on tail=66-36=30
Relative frequency of the coin landing on tails=Y
Y=30/66
Y=5/11
In decimal, we can write as 0.45
Question 3.
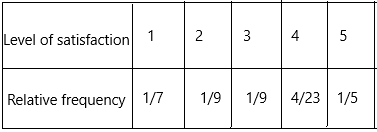
A number die is rolled 50 times. After each roll, the result is recorded. The table gives the observed frequency for each number on the die.
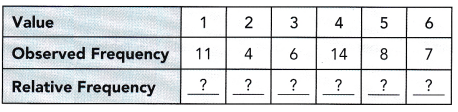
a) Copy and complete the table. Write each relative frequency as a fraction.
Answer:
The total frequency=50
The observed frequencies are 11, 4, 6, 14, 8, 7
Now we have to find relative frequency:
Relative frequency=observed frequency of data value/total number of observations
The relative frequency of value 1 = 11/50
The relative frequency of value 2 = 4/50=2/25
The relative frequency of value 3 = 6/50=3/25
The relative frequency of value 4 = 14/50=7/25
The relative frequency of value 5 = 8/50=4/25
The relative frequency of value 6 = 7/50
b) Find the relative frequency for rolling a number greater than 4. Give your answer as a fraction.
Answer:3/10
Explanation:
The dice greater than 4 is 5 and 6
The observed frequency of 5 is 8
The observed frequency of 6 is 7
Now add these two frequencies
8+7=15
Relative frequency=observed frequency of data value/total number of observations
Relative frequency=15/50
Relative frequency=3/10
Therefore, 3/10 is the relative frequency for rolling a number greater than 4.
c) Find the relative frequency of rolling an odd number. Give your answer as a fraction.
Answer:1/2
Explanation:
– We will write the probability of rolling an odd number on dice as a fraction.
– The odd numbers are 1, 3, and 5
– This is 3 of the 6 sides of the dice
– The probability of rolling an odd number on a dice is 3/6
– 3/6 is the same as the 1/2
– you can expect an odd number to be rolled half of the time.
The observed frequency of 1 is 11
The observed frequency of 3 is 6
The observed frequency of 5 is 8
Now add these three frequencies
11+6+8=25
Relative frequency=observed frequency of data value/total number of observations
Relative frequency=25/50
Relative frequency=1/2
Question 4.
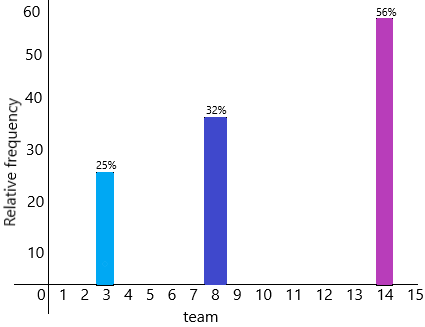
The ice hockey team Blue Thunder played 25 times during the winter season. The team had 14 wins, 8 losses, and 3 ties.
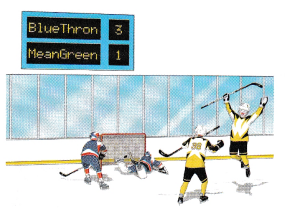
a) Find the relative frequency for each of the following: wins, losses, ties. Give your answers as percents.
Answer:
The number of wins a team had=14
Relative frequency of wins=14/25
In percentage, we can write as:14/25*100=56%
The number of losses a team had=8
Relative frequency of losses=8/25
In percentage, we can write as:8/25*100=32%
The number of ties a team had=3
Relative frequency of losses=3/25
In percentage, we can write as:3/25*100=12%
b) Draw a relative frequency bar graph that uses percents.
Answer:
c) What percent of the total number of games ended in a loss or a tie?
Answer:
The number of losses a team had=8
Relative frequency of losses=8/25
In percentage, we can write as:8/25*100=32%
The number of ties a team had=3
Relative frequency of losses=3/25
In percentage, we can write as:3/25*100=12%
Question 5.
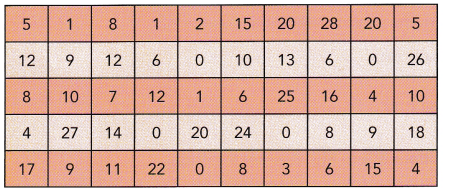
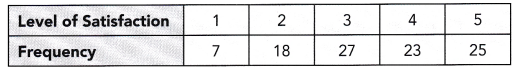
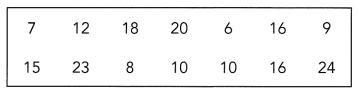
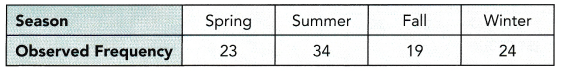
You are given a deck of 52 cards showing scenes of the four seasons of the year. There are 13 cards for each season. You randomly select a card from the deck 100 times. After each selection, you record the season shown on the card and replace it in the deck for the next selection. The results are given in the table below.
a) Find the relative frequency of the appearance of each season.
Answer:
The total number of observations=100
The observed frequencies=23, 34, 19, 24
Relative frequency=observed frequency of data value/total number of observations
The relative frequency of the spring=23/100
The relative frequency of the summer=34/100=17/50
The relative frequency of the fall=19/100
The relative frequency of the winter=24/100=6/25
b) What is the experimental probability of selecting a card with a summer scene?
Answer:
Experimental probability: Experimental probability, also known as Empirical probability, is based on actual experiments and adequate recordings of the happening of events. To determine the occurrence of any event, a series of actual experiments are conducted. Experiments that do not have a fixed result are known as random experiments. The outcome of such experiments is uncertain. Random experiments are repeated multiple times to determine their likelihood. An experiment is repeated a fixed number of times and each repetition is known as a trial. Mathematically, the formula for the experimental probability is defined by;
Probability of an Event P(E) = Number of times an event occurs / Total number of trials.
The observed frequency of the summer=34
According to the above definition:
P(E)=34/100
p(E)=17/50
c) What is the theoretical probability of selecting a card with a summer scene?
Answer:
In probability, the theoretical probability is used to find the probability of an event. Theoretical probability does not require any experiments to conduct. Instead of that, we should know about the situation to find the probability of an event occurring. Mathematically, the theoretical probability is described as the number of favourable outcomes divided by the number of possible outcomes.
Probability of Event P(E) = No. of. Favourable outcomes/ No. of. Possible outcomes.
N0.of favourable outcomes of summer=1
No.of possible outcomes=4 (4 seasons)
P(E)=1/4
d) Math journal The experimental and the theoretical probabilities J of selecting a card with a summer scene are not equal. Describe some
factors that cause the two probabilities to be different.
Answer:
Some possible factors are as follows: The cards may not be well-shuffled; different people choose a card in different ways. How the cards are placed may make a difference; The theoretical probability may have assumptions that cannot be achieved from experiments.
e) Suppose that the spring and summer cards have a red background and the fall and winter cards have a black background. What is the experimental probability of selecting a card with a black background?
Answer:43/100
The total number of observations=100
The observed frequencies=23, 34, 19, 24
Relative frequency=observed frequency of data value/total number of observations
The relative frequency of the spring=23/100
The relative frequency of the summer=34/100=17/50
The relative frequency of the fall=19/100
The relative frequency of the winter=24/100=6/25
Experimental probability:
Probability of an Event P(E) = Number of times an event occurs / Total number of trials.
Now add the fall and winter cards:
Calculation:
100 is the least common multiple of denominators 100 and 25. Use it to convert to equivalent fractions with this common denominator.
Therefore, the experimental probability of selecting a card with a black background is 43/100.
f) What is the theoretical probability of selecting a card with a red background?
Answer:1/2
In the above question given that the spring and summer cards have a red background. According to that we need to calculate the probability.
In probability, the theoretical probability is used to find the probability of an event. Theoretical probability does not require any experiments to conduct. Instead of that, we should know about the situation to find the probability of an event occurring. Mathematically, the theoretical probability is described as the number of favourable outcomes divided by the number of possible outcomes.
Probability of Event P(E) = No. of. Favourable outcomes/ No. of. Possible outcomes.
The number of favourable outcomes=1
the number of possible outcomes=2
P(E)=1/2
Question 6.
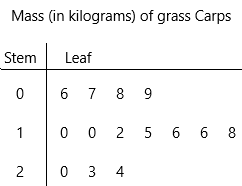
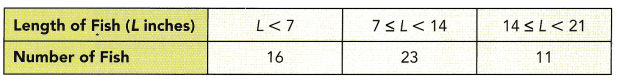
A group of researchers catch and measure the length offish before releasing them back to a river. The lengths of the 50 fish are categorized in the table below.
a) Find the relative frequency of each category of fish.
Answer:
The total number of observations=50
The observed frequencies=16, 23, 11
Relative frequency=observed frequency of data value/total number of observations
The relative frequency of length of the fish (L<7)=16/50=8/25
The relative frequency of length of the fish 7less than or equal to L < 14=23/50
The relative frequency of length of the fish 14 less than or equal to L < 21=11/50
b) If the researchers catch and measure one more fish, what is the probability of catching a fish that is less than 7 inches long?
Answer:
The probability of catching fish is less than 7 and the possible outcomes are 1, 2, 3, 4, 5, 6
P(E)=N(P)/N(T)
P(E)=5/50
P(E)=1/10
Therefore, the probability of catching a fish that is less than 7 inches long is 1/10.
c) What is the probability that the next fish caught will be at least 7 inches long?
Answer:
The probability of catching fish is less than 7 and the possible outcomes are 1, 2, 3, 4, 5, 6,7
P(E)=N(P)/N(T)
P(E)=7/50
Therefore, the probability of catching a fish that is less than 7 inches long is 7/10.
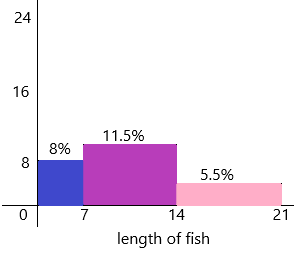
d) Draw a relative frequency histogram using percent.
Answer:
The total number of observations=50
The observed frequencies=16, 23, 11
Relative frequency=observed frequency of data value/total number of observations
The relative frequency of length of the fish (L<7)=16/50=8/25
In percentages, we can write 8/25*100=8%
The relative frequency of length of the fish 7less than or equal to L < 14=23/50
In percentages, we can write 23/50*100=11.5%
The relative frequency of length of the fish 14 less than or equal to L < 21=11/50
In percentages, we can write 11/50*100=5.5%
Question 7.
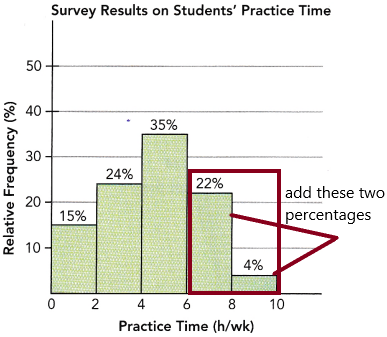
A car dealership has sold 75 new cars this year. The histogram below shows frequencies for cars sold in different price ranges.
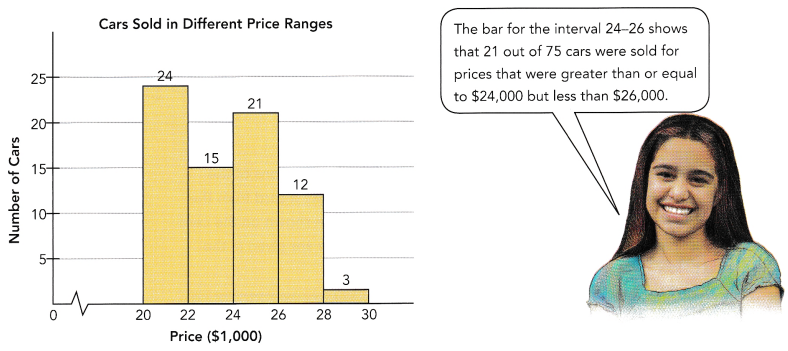
a) Find the relative frequency of the cars sold in the price range of $26,000 to $28,000. Give your answer as a percent.
Answer:
The total number of observations=75
The observed frequencies=24, 15, 21, 12, 3
Relative frequency=observed frequency of data value/total number of observations
Relative frequency=12/75=0.16
In percentages, we can write 0.16*100=16%
Therefore, the relative frequency of the cars sold in the price range of $26,000 to $28,000 is 16%.
b) Find the relative frequency of the cars sold in the price range of $20,000 to $24,000. Give your answer as a percent.
Answer:
The total number of observations=75
The observed frequencies=24, 15, 21, 12, 3
Relative frequency=observed frequency of data value/total number of observations
The relative frequency of the cars sold in the price range of $20,000 to $24,000=X
X=24+15/75
X=39/75
X=0.52
In percentages, we can write 0.52*100=52%
c) What is the probability that the next car will be sold in the price range of $28,000 to $30,000?
Answer:
the probability of the next car will be sold in the price range of $28,000 to $30,000=3/75=0.04
In percentages, we can write 0.04*100=4%.
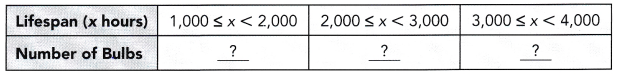
Question 8.
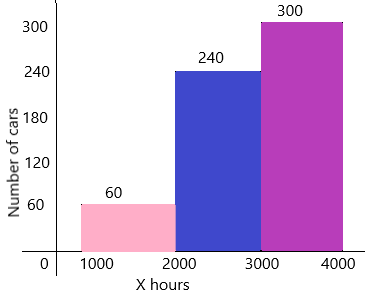
A light bulb manufacturer estimates that 10% of a shipment of 600 bulbs will have a lifespan greater than or equal to 1,000 hours, but less than 2,000 hours. The manufacturer also estimates that 240 of the bulbs will have a lifespan greater than or equal to 2,000 hours, but less than 3,000 hours, and that the remaining light bulbs will have a lifespan greater than or equal to 3,000 hours, but less than 4,000 hours.
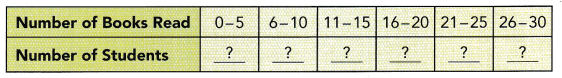
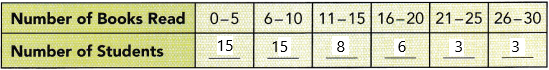
a) Copy and complete the table below.
Answer:
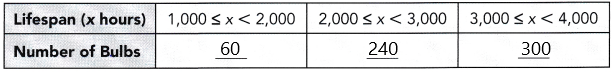
Explanation:
The number of bulbs will have a lifespan greater than or equal to 1,000 hours, but less than 2,000 hours
:10% of 600=60 bulbs
10*600/100=60 bulbs.
So I had written 60 in the first box.
Already given 240 bulbs are given for second box.
The remaining boxes =X
X=240+60=300
Now subtract the total bulbs and the life span of the present boxes.
X=600-300
X=300
The remaining bulbs are 300.
b) Draw a frequency histogram for the three lifespans shown in the table.
Answer:
A histogram is a graphical representation of a grouped frequency distribution with continuous classes. It is an area diagram and can be defined as a set of rectangles with bases along with the intervals between class boundaries and with areas proportional to frequencies in the corresponding classes. In such representations, all the rectangles are adjacent since the base covers the intervals between class boundaries. The heights of rectangles are proportional to corresponding frequencies of similar classes and for different classes, the heights will be proportional to corresponding frequency densities.
In other words, a histogram is a diagram involving rectangles whose area is proportional to the frequency of a variable and width is equal to the class interval.
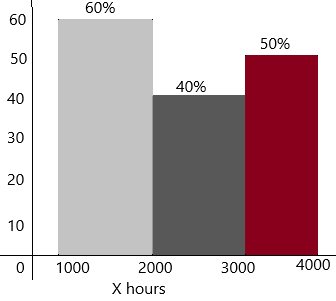
c) Find the relative frequency for the bulbs with each of the lifespans. Then draw a relative frequency histogram using percents.
Answer:
The total frequency=100
The observations are=60,240,300
The relative frequency of bulbs will have a lifespan greater than or equal to 1,000 hours, but less than 2,000 hours=60/600=0.6
In percentages, we can write 0.6*100=60%
The relative frequency of the bulbs will have a lifespan greater than or equal to 2,000 hours, but less than 3,000 hours=240/600=0.4
In percentages, we can write 0.4*100=40%
The relative frequency of the bulbs will have a lifespan greater than or equal to 3,000 hours, but less than 4,000 hours=300/600=0.5
In percentages, we can write 0.5*100=50%
d) If you buy a light bulb from this shipment, what do you predict is the most likely lifespan of your light bulb? Explain your answer using experimental probability.
Answer:
First, compare the life span of the bulbs:
The bulbs will have a lifespan greater than or equal to 1,000 hours, but less than 2,000 hours=60
The bulbs will have a lifespan greater than or equal to 2,000 hours, but less than 3,000 hours=240
The bulbs will have a lifespan greater than or equal to 3,000 hours, but less than 4,000 hours=300
The highest lifespan is 300 so definitely, everyone will predict that it will be the most likely one.
Experimental probability: Experimental probability, also known as Empirical probability, is based on actual experiments and adequate recordings of the happening of events. To determine the occurrence of any event, a series of actual experiments are conducted. Experiments that do not have a fixed result are known as random experiments. The outcome of such experiments is uncertain. Random experiments are repeated multiple times to determine their likelihood. An experiment is repeated a fixed number of times and each repetition is known as a trial. Mathematically, the formula for the experimental probability is defined by;
Probability of an Event P(E) = Number of times an event occurs / Total number of trials.
P(E)=300/600
P(E)=1/2.