This handy Math in Focus Grade 5 Workbook Answer Key Chapter 11 Practice 1 Making and Interpreting Double Bar Graphs provides detailed solutions for the textbook questions.
Math in Focus Grade 5 Chapter 11 Practice 1 Answer Key Making and Interpreting Double Bar Graphs
Complete. Use the data in the graph.
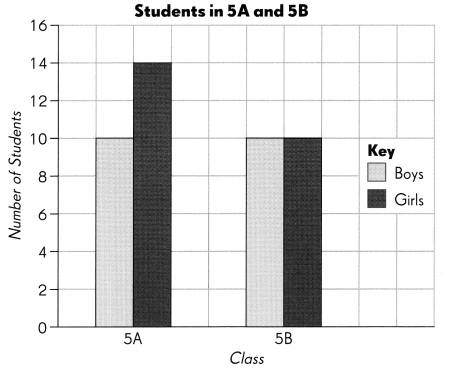
The double bar graph shows the number of boys and girls in two classes, 5A and 5B.
Question 1.
There are ___________ students in 5A and ___________ students in 5B.
Answer:
24 students in 5A and 20 students in 5B
Explanation:
The above graph shows number of boys and girls.
Number of students on y-axis and sections on y-axis.
number of boys in 5A = 10
number of girls in 5A = 14
total boys and girls in 5A = 10 + 14 = 24
Similarly,
number of boys in 5B = 10
number of girls in 5B = 10
total boys and girls in 5B = 10 + 10 = 20
Question 2.
There are ___________ more girls than boys in 5A.
Answer:
4 more girls than boys in 5A
Explanation:
number of boys in 5A = 10
number of girls in 5A = 14
number of more girls than boys in 5A = 14 – 10 = 4
Question 3.
Class ___________ has an equal number of boys and girls.
Answer:
5B has an equal number of boys and girls
Explanation:
The above graph shows number of boys and girls.
number of boys in 5B = 10
number of girls in 5B = 10
total boys and girls in 5B = 10 + 10 = 20
Question 4.
There are ___ girls altogether in 5A and 5B.
Answer:
24 girls altogether in 5A and 5B
Explanation:
The above graph shows number of boys and girls.
number of girls in 5A = 14
number of girls in 5B = 10
total girls in 5A and 5B = 14 + 10 = 24
Question 5.
There are ___ boys altogether in 5A and 5B.
Answer:
20 boys altogether in 5A and 5B
Explanation:
The above graph shows number of boys and girls.
number of boys in 5A = 10
number of boys in 5B = 10
total boys in 5A and 5B = 10 + 10 = 20
Question 6.
The average number of students in the two classes is ___
Answer: 22
Explanation:
The average number of students in the two classes is = 22
Average = sum/number of events
Average = \( \frac {24 + 20} {2} \)
= \( \frac {44} {2} \)
= 22
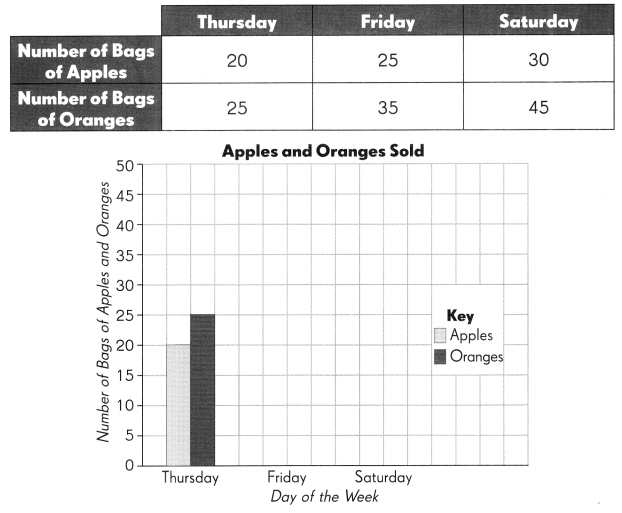
Complete the bar graph using the data in the table. Then answer the questions.
Question 7.
The table shows the number of bags of apples and oranges sold by a grocer on three days.
Answer:
Explanation:
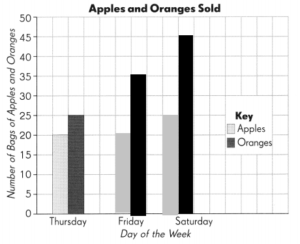
The above graph shows number of apples and oranges sold on Thursday, Friday and Saturday.
y-axis represents the number of bags of apples and oranges.
x-axis represents the apples and oranges sold on particular days.
Question 8.
On Friday, ___ more bags of oranges than apples were sold.
Answer:
On Friday 15 more bags of oranges than apples were sold.
Explanation:
The above graph shows number of apples and oranges sold on Friday.
number of apples sold = 20
number of oranges sold = 35
number of more bags of oranges than apples = 35 – 20 = 15
Question 9.
On Saturday, ___ fewer bags of apples than oranges were sold.
Answer:
On Saturday, 20 fewer bags of apples than oranges were sold.
Explanation:
The above graph shows number of apples and oranges sold on Saturday.
number of apples sold = 25
number of oranges sold = 55
number of less bags of apples than oranges = 45 – 25 = 20
Question 10.
The total number of bags of apples and oranges sold was the greatest on ___________.
Answer:
The total number of bags of apples and oranges sold was the greatest on Saturday.
Explanation:
The above graph shows number of apples and oranges sold on Thursday, Friday and Saturday.
Comparing on the three days apples and oranges were sold more on Saturday.
Question 11.
The difference between the number of bags of apples and oranges sold was the least on ____.
Answer:
The difference between the number of bags of apples and oranges sold was the least on Thursday.
Explanation:
The above graph shows number of apples and oranges sold on Thursday, Friday and Saturday.
Comparing on the three days apples and oranges were sold less on Thursday.