This handy Math in Focus Grade 6 Workbook Answer Key Chapter 14 Lesson 14.4 Real-World Problems: Mean, Median, and Mode detailed solutions for the textbook questions.
Math in Focus Grade 6 Course 1 B Chapter 14 Lesson 14.4 Answer Key Real-World Problems: Mean, Median, and Mode
Math in Focus Grade 6 Chapter 14 Lesson 14.4 Guided Practice Answer Key
Solve.
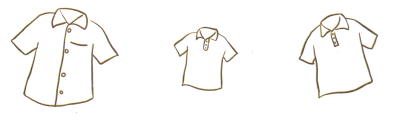
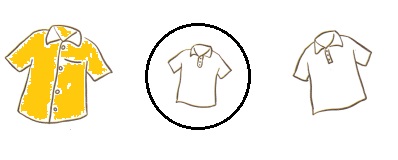
The table shows the sizes of T-shirts and the number of T-shirts displayed in a shop.

Question 1.
How many T-shirts are displayed in the shop?
Answer:
60 T-shirts are displayed in the shop.
Explanation:
The above table shows the sizes of T-shirts and the number of T-shirts displayed in a shop.
Sum of the T-shirts 7 + 14 + 22 + 15 + 2 = 60
60 T-shirts are displayed in the shop.
Question 2.
What is the mean size of the T-shirts being displayed?
Answer:
11.7
Rounded to the nearest ten as 12.
Explanation:
The above table shows the sizes of T-shirts and the number of T-shirts displayed in a shop.
Mean = \(\frac{\text {The sum of the values in a data set}}{\text {The number of values in a data set}}\)
Mean = \(\frac{ 8×7+ 10×14 + 12×22 + 14×15 + 16×2}{60}\)
Mean = \(\frac{56 + 140 + 264 + 210 + 32}{60}\)
Mean = \(\frac{702}{60}\)
Mean = 11.7
Question 3.
What is the modal size of the T-shirts being displayed?
Answer:
12
Explanation:
The above table shows the sizes of T-shirts and the number of T-shirts displayed in a shop.
As more number of T shirts displayed were 12 number size.
Question 4.
What is the median size of the T-shirts being displayed?
Answer:
12
Explanation:
The above table shows the sizes of T-shirts and the number of T-shirts displayed in a shop.
We know that the median is the middle point in a dataset.
To find the median: Arrange the data points from smallest to largest.
If the number of data points is odd, the median is the middle data point in the list.
So, the median of the above set is {8, 10, 12, 14, 16} is 12.
Question 5.
Which measure of central tendency best describes the data set? Justify your answer.
Answer:
Mean
Explanation:
Mean is generally considered the measure of central tendency and the most frequently used one. The mean is the most frequently used measure of central tendency because it uses all values in the data set to give you an average.
Solve.
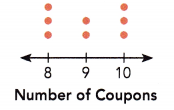
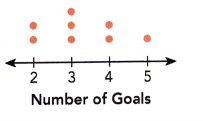
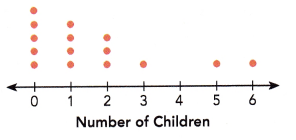
The dot plot shows the results of a survey on the number of children below 13 years old in each household. Each dot represents one household.
Question 6.
Find the mean, mode, and median of the data set.
Answer:
mean = 1.6
mode = 0
median = 1
Explanation:
The above dot plot shows the results of a survey on the number of children below 13 years old in each household. Each dot represents one household.
Mean:
The mean = \(\frac{Sum of a set of items}{Number of items}\)
mean = \(\frac{0 + 4 + 6 + 3 + 5 + 6 }{15}\)
mean = \(\frac{24}{15}\)
mean = 1.6
Mode:
Mode is the value which occurs the maximum number of times in a given data set.
It is the third measure of the central tendency.
0, 0, 0, 0, 0, 1, 1, 1, 1, 2, 2, 2, 3, 5, 6
the above data has 15 observations,
So, 0 appears most frequently, is the mode of a given data.
Median:
median : Middle value is the median of a given data set.
0, 0, 0, 0, 0, 1, 1, 1, 1, 2, 2, 2, 3, 5, 6
the above data has 15 observations,
So, 1 in the middle of the order sequence is the median.
Question 7.
Which measure of central tendency best describes the data set? Justify your answer.
Answer:
Mean or Median measure of central tendency best describes the data set.
Explanation:
Mode is the value which occurs the maximum number of times in a given data set.
Mode is zero ‘0’, but it tells 5 children out of 15 households.
So, the mode does not describe the set of the data.
Mean is 1.6 and median is 1.
These two may be used for better answer to describe the set of data.
Question 8.
Relate the measures of center to the shape of the data distribution.
Answer:
The shape of the data distribution is right skewed.
The mean gives more weight to the values on the right than the median does.
So, the mean is to the right of the median.
Explanation:
The two main numerical measures for the center of a distribution are the mean and the median. The mean is the average value, while the median is the middle value.
Solve.
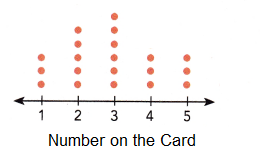
The dot plot shows the number of feedback forms received by a mall over a ten-week period. Each dot represents one feedback form.
Question 9.
Find the mean, mode, and median of the data set.
Answer:
mean = 5.4
mode = 5
median = 5
Explanation:
The above dot plot shows the number of feedback forms received by a mall over a ten-week period. Each dot represents one feedback form.
Mean:
The mean = \(\frac{Sum of a set of items}{Number of items}\)
mean = \(\frac{1×1 +1×2 + 2×3 + 3×4 + 4×5 + 3×6 + 2×7 + 2×8 + 1×9 + 1×10 }{20}\)
mean = \(\frac{108}{20}\)
mean = 5.4
Mode
The above observations are
1, 2, 3, 3, 4, 4, 4, 5, 5, 5, 5, 6, 6, 6,7, 7, 8, 8, 9, 10
As 5 has more number of dots in the above given dot plot : mode is 5
Median:
The above observations are
1, 2, 3, 3, 4, 4, 4, 5, 5, 5, 5, 6, 6, 6,7, 7, 8, 8, 9, 10
total 20 observation
median : Middle value is the median of a given data set.
1, 2, 3, 3, 4, 4, 4, 5, 5, 5, 5, 6, 6, 6,7, 7, 8, 8, 9, 10
the above data has 20 observations,
So, 5, 5 in the middle of the order sequence is the median.
the average of (5 + 5)/2 = 10/2 = 5
Question 10.
Relate the measures of center to the shape of the data distribution.
Answer:
The data are well spread out, and the shape of the data is symmetrical. Because the mode and median are the same 5 and 5 and the mean is slightly higher 5.4. The data set is likely to be more spread out for data greater then 5.
Explanation:
The two main numerical measures for the center of a distribution are the mean and the median. The mean is the average value, while the median is the middle value.
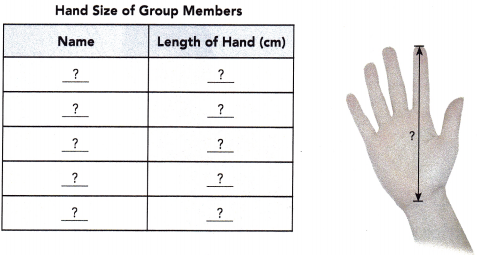
Hands-On Activity
FINDING POSSIBLE VALUES OF MEAN, MEDIAN, AND MODE
Work in pairs.
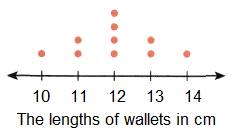
The lengths of 10 wallets have the same mean, median, and mode of 12 centimeters.
Explore and find a set of possible values for these lengths.
Show your work.
(Hint: You may use a dot plot to help you.)
Answer:
Mean = 12
Mode = 12
Median = 12
Explanation:
Given, The lengths of 10 wallets have the same mean, median, and mode of 12 centimeters.
Mean:
The mean = \(\frac{Sum of a set of items}{Number of items}\)
mean = \(\frac{1×10 +2×11 + 4×12 + 2×13 + 1×14}{10}\)
mean = \(\frac{10 +22 + 48 + 26 + 14}{10}\)
mean = \(\frac{120}{10}\)
mean = 12
Mode:
The above observations are,
10, 11, 11, 12, 12, 12, 12, 13, 13, 14
As 12 has more number of dots in the above given dot plot : mode is 12
Median:
The above observations are,
10, 11, 11, 12, 12, 12, 12, 13, 13, 14
From the total 10 observations,
median : Middle value is the median of a given data set.
10, 11, 11, 12, 12, 12, 12, 13, 13, 14
the above data has 10 observations,
So, 12, 12 in the middle of the order sequence is the median.
the average of (12 + 12)/2 = 24/2 = 12
Math in Focus Course 1B Practice 14.4 Answer Key
Find the mean, median, and mode.
Question 1.
Eight students took a mathematics quiz. Their scores were 85, 92, 73, 85, 68, 82, 93, and 76. Find the mean, median, and mode.
Answer:
Mean = 81.75
Mode = 85
Median = 83.5
Explanation:
Eight student’s mathematics quiz scores were 85, 92, 73, 85, 68, 82, 93, and 76.
were arranged in ascending order as below.
68, 73, 76, 82, 85, 85, 92, 93
Mean:
The mean = \(\frac{Sum of a set of items}{Number of items}\)
mean = \(\frac{68 + 73 + 76 + 82 + 85 + 85 + 92 + 93}{8}\)
mean = \(\frac{654}{8}\)
mean = 81.75
Mode:
The above observations are
68, 73, 76, 82, 85, 85, 92, 93
As 85 has more number of observation : mode is 85
Median:
The above observations are
68, 73, 76, 82, 85, 85, 92, 93
total 8 observation
median : Middle value is the median of a given data set.
68, 73, 76, 82, 85, 85, 92, 93
the above data has 10 observations,
So, 82, 85 in the middle of the order sequence is the median.
the average of (82 + 85)/2 = 167/2 = 83.5
Use the data in the table to answer questions 2 and 3.
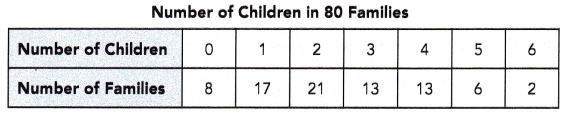
The table shows the results of a survey carried out on 80 families.
Question 2.
Find the mean, median, and mode.
Answer:
Mean = 2.4
Mode = 2
Median =2
Explanation:
The above table shows the results of a survey carried out on 80 families.
Mean:
The mean = \(\frac{Sum of a set of items}{Number of items}\)
mean = \(\frac{0x8 +1×17 + 2×21 + 3×13 + 4×13 +5×6 + 6×2}{21}\)
mean = \(\frac{0 +17 + 42 + 39 + 52 + 30 + 12}{80}\)
mean = \(\frac{192}{80}\)
mean = 2.4
Mode:
The above observations are
0x8,1×17, 2×21, 3×13, 4×13, 5×6, 6×2
As 2 has more number observation the above given table, 21 families have 2 childrens : mode is 2
Median:
As 2 has more number observation the above given table, 21 families have 2 children : median is 2
the above data has 192 observations,
So, 2, 2 in the middle of the order sequence is the median.
the average of (2 + 2)/2 = 4/2 = 2
Question 3.
Which measure of central tendency best describes the data set? Justify your answer.
Answer:
The median and mode.
Explanation:
The mean number of children is 2.4 it is not a realistic number for describing the data set.
The median and mode are both 2, which is a realistic number for describing the data.
Solve. Show your work.
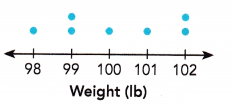
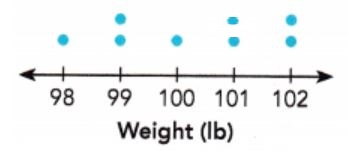
The data set shows the weights of ten gerbils in ounces.
5.49, 4.48, 4.57, 4.59, 4.61, 4.57, 4.98, 4.43, 4.45, 4.58
Question 4.
Find the mean, median, and mode.
Answer:
Mean = 4.675
Mode = 4.57
Median = 4.575
Explanation:
Given set of data, 5.49, 4.48, 4.57, 4.59, 4.61, 4.57, 4.98, 4.43, 4.45, 4.58
arrange the given data in the ascending order,
4.43, 4.45, 4.48, 4.57, 4.57, 4.58, 4.59, 4.61, 4.98, 5.49
Mean:
The mean = \(\frac{Sum of a set of items}{Number of items}\)
mean = \(\frac{4.43+ 4.45+ 4.48+ 4.57+ 4.57+ 4.58+ 4.59+ 4.61+ 4.98+ 5.49}{10}\)
mean = \(\frac{46.75}{8}\)
mean = 4.675
Mode:
The above observations are
4.43, 4.45, 4.48, 4.57, 4.57, 4.58, 4.59, 4.61, 4.98, 5.49
As 4.57 has more number of observation : mode is 4.57
Median:
median : Middle value is the median of a given data set.
4.43, 4.45, 4.48, 4.57, 4.57, 4.58, 4.59, 4.61, 4.98, 5.49
the above data has 10 observations,
So, 4.57, 4.58 in the middle of the order sequence is the median.
the average of (4.57 + 4.58)/2 = 9.15/2 = 4.575
Question 5.
Which one of the weights would you delete from the list if you want the mean to be closer to the median?
Answer:
5.49 ounce
Explanation:
5.49 oz is the separate value or higher value of the gerbil in the data set,
the weights of ten gerbils in ounces.
Use the data In the dot plot to answer questions 6 to 9.
The dot plot shows the number of hours nine students spent surfing the Internet one day. Each dot represents 1 student.
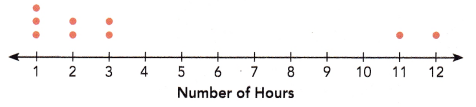
Question 6.
Find the mean, median, and mode.
Answer:
Mean = 4
Mode = 1
Median = 2
Explanation:
Mean:
The mean = \(\frac{Sum of a set of items}{Number of items}\)
mean = \(\frac{1×3 +2×2 + 3×2 + 11×1 + 12×1}{9}\)
mean = \(\frac{3 + 4 + 6 + 11 + 12}{9}\)
mean = \(\frac{36}{9}\)
mean = 4
Mode:
The above observations are,
1, 1, 1, 2, 2, 3, 3, 11, 12
As 1 has more number of dots in the above given dot plot : mode is 1
Median:
The above observations are,
1, 1, 1, 2, 2, 3, 3, 11, 12
There are total 9 observations,
median : Middle value is the median of a given data set.
1, 1, 1, 2, 2, 3, 3, 11, 12
The above data has 9 observations,
So, 2 in the middle of the order sequence is the median.
Question 7.
Give a reason why the mean is much greater than the median.
Answer:
11 and 12 are the two outliers in the above given data set.
Explanation:
The mean is affected by outliers that do not influence the mean.
Therefore, when the distribution of data is skewed in the middle,
the mean is often less than the median.
When the distribution is skewed to the right,
the mean is often greater than the median.
Question 8.
Which measure of central tendency best describes the data set?
Answer:
The median is 2 it is realistic number for describing the data set.
Explanation:
Mean is generally considered the measure of central tendency and the most frequently used one.
The median 2, which is a realistic number measure of central tendency best describes the data set.
Question 9.
Relate the measures of center to the shape of the data distribution.
Answer:
The share of the distribution is right-skewed.
So, the measure of center is likely to be 2 hours, which is in the lower range.
Explanation:
The two main numerical measures for the center of a distribution are the mean and the median. The mean is the average value, while the median is the middle value.
Use the data in the dot plot to answer the questions 6 to 9.
The dot plot shows the results of a survey on the number of brothers or sisters each student in a class has. Each dot represents 1 student.
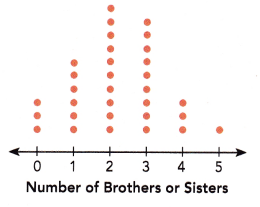
Question 10.
Briefly describe the data distribution and relate the measure of center to the shape of the dot plot shown.
Answer:
median = 2
Explanation:
Total 32 students are there,
is unimodal and symmetrical normal distribution.
Mode of the data set is 2.
Mean:
The mean = \(\frac{Sum of a set of items}{Number of items}\)
mean = \(\frac{0x3 +1×6 + 2×10 + 3×9 + 4×3 + 1×5}{32}\)
mean = \(\frac{0 + 6 + 20 + 27 + 12 + 5}{32}\)
mean = \(\frac{70}{32}\)
mean = 2.1875
median : Middle value is the median of a given data set.
0, 0, 0, 1, 1, 1, 1, 1, 1, 2, 2, 2, 2, 2, 2, 2, 2, 2, 2, 3, 3, 3, 3, 3, 3, 3, 3, 3, 4, 4, 4, 5
The above data has 32 observations,
(2+2)/2 = 4/2 = 2
So, 2 in the middle of the order sequence is the median.
Make a dot plot to show the data. Use your dot plot to answer questions 11 and 12.
A box contains cards each with a number 1, 2, 3, 4, or 5 on it. In an experiment, 20 students took turns drawing a card from the box. The number written on the card was recorded before it was put back into the box.
Alice, who was the last person to draw a card, was supposed to complete the dot plot below. However, she lost the record of the experiment’s results. All she could recall was the following information.
(i) There were twice as many cards with the number ‘3’ drawn as there were cards with the number ‘4’ drawn.
(ii) There were an equal number of cards with the numbers ‘1’ and ‘5’ drawn.
(iii) 5 cards with the number ‘2’ were drawn.
(iv) 8 students drew cards that show an even number.
Question 11.
Copy and complete the dot plot.
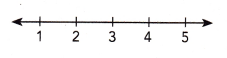
Answer:
Explanation:
Given that,
A box contains cards each with a number 1, 2, 3, 4, or 5 on it.
20 students took turns drawing a card from the box.
The number written on the card was recorded before it was put back into the box.
Alice, who was the last person to draw a card, was supposed to complete the dot plot below. However, she lost the record of the experiment’s results.
All she could recall was the following information.
(i) There were twice as many cards with the number ‘3’ drawn as there were cards with the number ‘4’ drawn.
So, there are 6 cards with number 3.
(ii) There were an equal number of cards with the numbers ‘1’ and ‘5’ drawn.
(iii) 5 cards with the number ‘2’ were drawn.
(iv) 8 students drew cards that show an even number.
So, the even number cards are 2 and 4.
Question 12.
Briefly describe the data distribution and relate the measure of center to the shape of the dot plot shown.
Answer:
Mode of the above data is 3.
Mean is 1.1825.
Explanation:
Mean:
The mean = \(\frac{Sum of a set of items}{Number of items}\)
mean = \(\frac{1×3 +2×5 + 3×6 + 4×3 + 5×3}{20}\)
mean = \(\frac{3 + 10 + 18 + 12 + 15}{20}\)
mean = \(\frac{58}{32}\)
mean = 1.1825
median : Middle value is the median of a given data set.
1,1,1,2,2,2,2,2,3,3,3,3,3,3,4,4,4,5,5,5
The above data has 20 observations,
(3+3)/2 = 6/2 = 3
So, 3 in the middle of the order sequence is the median.
Use the data in the table to answer questions 13 to 17.
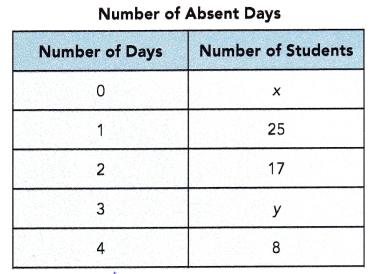
The table shows the number of students absent from school over a 30-day period.
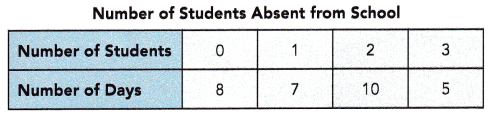
Question 13.
What is the mode of this distribution?
Answer:
mode = 2
Explanation:
Mode is the value which occurs the maximum number of times in a given data set.
It is the third measure of the central tendency.
So, 2 is most frequent appearance,
it means 10days out of 30 days 2 students are absent.
Question 14.
Find the mean and median number of students absent from school over the 30 days.
Answer:
Mean = 1.4
Median = 2
Explanation:
Mean:
The mean = \(\frac{Sum of a set of items}{Number of items}\)
mean = \(\frac{0x8 + 1×7 + 2×10 + 3×5}{30}\)
mean = \(\frac{0 + 7 + 20 + 15}{30}\)
mean = \(\frac{42}{30}\)
mean = 1.4
median : Middle value is the median of a given data set.
0, 0, 0, 0, 0, 0, 0, 0, 7, 2. 2. 2. 2. 2. 2. 2. 2. 2. 2, 10, 5, 5, 5
The above data has 30 observations,
(2+2)/2 = 4/2 = 2
So, 2 in the middle of the order sequence is the median.
Question 15.
It is found that the mean number of students absent from school over a subsequent 20-day period is 1. Find the mean number of students absent from school over the entire 50-day period.
Answer:
1.24
Explanation:
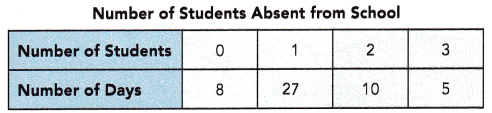
The mean = \(\frac{Sum of a set of items}{Number of items}\)
mean = \(\frac{0x8 + 1×27 + 2×10 + 3×5}{30}\)
mean = \(\frac{0 + 27 + 20 + 15}{30}\)
mean = \(\frac{62}{50}\)
mean = 1.24
Question 16.
If on one day of the 30-day period, 4 students were absent from school instead of 3, what should the mean of the distribution over the first 30-day period be? Round your answer to the nearest hundredth.
Answer:
1.57
Explanation:
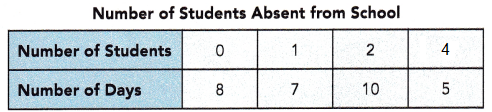
The mean = \(\frac{Sum of a set of items}{Number of items}\)
mean = \(\frac{0x8 + 1×7 + 2×10 + 4×5}{30}\)
mean = \(\frac{0 + 7 + 20 + 20}{30}\)
mean = \(\frac{47}{30}\)
mean = 1.566666
Round the answer to the nearest hundredth.
1.57
Question 17.
If on one day of the 30-day period, 2 students were absent from school instead of 1, would the median of the distribution over the 30-day period be affected? If so, what is the new median?
Answer:
Yes,
So, median is 2
Explanation:
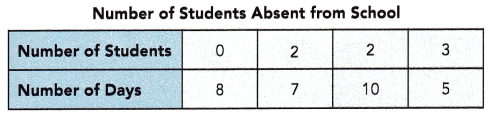
median : Middle value is the median of a given data set.
0, 0, 0, 0, 0, 0, 0, 0, 2, 2, 2, 2, 2, 2, 2, 2. 2. 2. 2. 2. 2. 2. 2. 2. 2, 10, 5, 5, 5
The above data has 30 observations,
So, 2 in the middle of the order sequence is the median.
Brain @ Work
In a series of six class quizzes, Tim’s first four quiz scores are 3, 5, 6, and 8. The mean score of the six quizzes is 6. If the greater of the missing quiz scores is doubled, the mean score becomes 7\(\frac{1}{3}\). What are the two missing quiz scores?
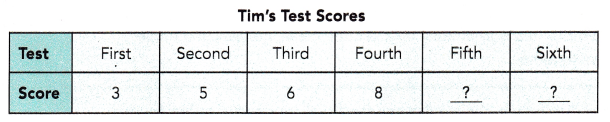
Answer:
5th test score = 8
6th test score = 6
Explanation:
In a series of six class quizzes, Tim’s first four quiz scores are 3, 5, 6, and 8.
The mean score of the six quizzes is 6.
Let fifth test scores = x
sixth test scores = y
mean = (3 + 5 + 6 + 8 + x + y) ÷ 6= (22 + x + y) ÷ 6
(22 + x + y)÷ 6 = 6
22 + x + y = 36
x + y = 36 – 22
x + y = 14
y = 14 – x
if the high test test scores are doubled,
(3 + 5 + 6 + 8 + 2x + y) ÷ 6= (22 + 2x + y) ÷ 6
(22 + 2x + y)÷ 6 = 7\(\frac{1}{3}\)
22 + 2x + y = 7\(\frac{1}{3}\) x 6
2x + y = 44 – 22
2x + 14 – x = 22
x = 22 – 14
x = 8
So, y = 14 – x
y = 14 – 8
y = 6
Hence, 5th test score = 8
Hence, 6th test score = 6