Practice the problems of Math in Focus Grade 3 Workbook Answer Key Chapter 13 Practice 2 Reading and Interpreting Bar Graphs to score better marks in the exam.
Math in Focus Grade 3 Chapter 13 Practice 2 Answer Key Reading and Interpreting Bar Graphs
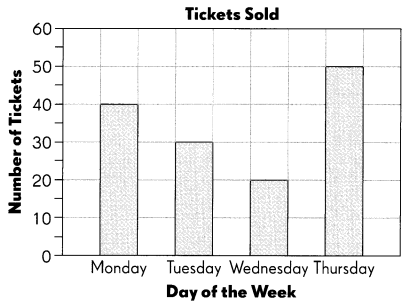
The bar graph shows the bus tickets that were sold on Monday, Tuesday, Wednesday, and Thursday.
Answer each question. Use the data in the bar graph.
Question 1.
How many more tickets were sold on Thursday than on Wednesday?
__________ tickets
Answer:
50 tickets sold on Thursday.
20 tickets sold on Wednesday.
Subtract total tickets on Wednesday from total tickets on Thursday.
50 – 20 = 30
30 more tickets were sold on Thursday than on Wednesday.
Question 2.
On Thursday, 15 of the tickets sold were for children. How many tickets sold were for adults?
__________ tickets
Answer:
Total 50 tickets were sold on Thursday.
On Thursday, 15 of the tickets sold were for children.
50 – 15 = 35
35 tickets were sold for adults.
Question 3.
18 fewer tickets were sold on Friday than on Tuesday. How many tickets were sold on Friday?
__________ tickets
Answer:
Total tickets sold on Tuesday are 30.
18 fewer tickets were sold on Friday than on Tuesday.
Subtract 18 tickets from 30 tickets.
30 – 18 = 12
On Friday, 12 tickets were sold.
Question 4.
The number of tickets sold on Tuesday can be grouped into fives. How many groups are there?
_________ groups
Answer:
Total tickets sold on Tuesday are 30.
The number of tickets sold on Tuesday can be grouped into fives.
30/5 = 6
There are 6 groups.
Question 5.
How many tickets were sold in all during the four days?
_________ tickets
Answer:
Total tickets sold on Monday are 40.
Total tickets sold on Tuesday are 30.
Total tickets sold on Wednesday are 20.
Total tickets sold on Thursday are 50.
40 + 30 + 20 + 50 = 140
140 tickets were sold in all during the four days.
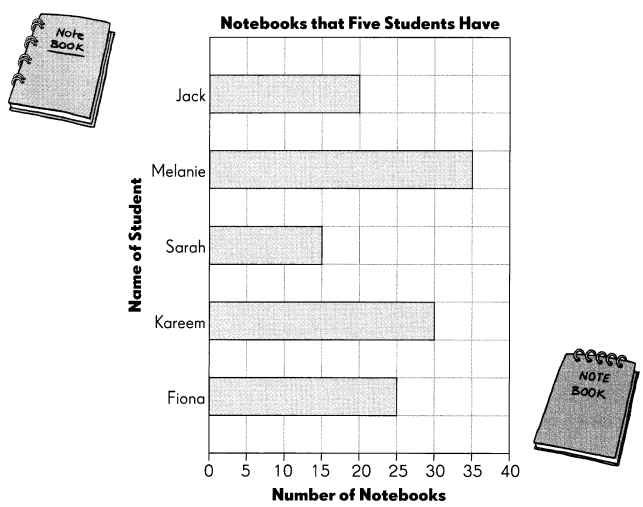
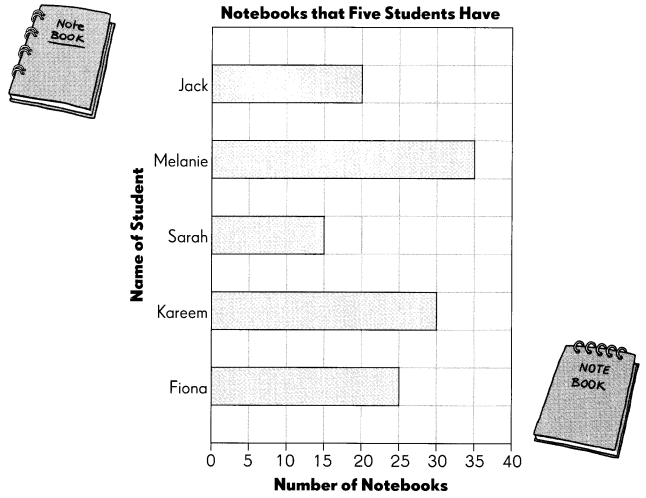
This bar graph shows the number of notebooks that have students have.
Write T for true and F for false in the boxes Use the data in the bar graph.
Question 6.
Jack has 20 notebooks.
Answer:
True (T)
Question 7.
Fiona has 25 notebooks.
Answer:
True (T)
Question 8.
Melanie has 40 notebooks.
Answer:
False
Explanation:
In the above bar graph we can observe Melanie has 35 notebooks. So, the above statement is false.
Question 9.
Kareem has 5 fewer notebooks than Fiona.
Answer:
False
Explanation:
In the above bar graph we can observe that Kareen has 30 notebooks and Fiona has 25 note books. So, the above statement is false.
Question 10.
Sarah has the least number of notebooks.
Answer:
True
Answer each question. Use the data in the bar graph.
Question 11.
How many more notebooks does Kareem have than Fiona?
Answer:
Kareem have 30 notebooks.
Fiona have 25 notebooks.
30 – 25 = 5
Kareem have 5 more notebooks than Fiona.
Question 12.
How many fewer notebooks does Sarah have than Melanie?
Answer:
Sarah have 15 notebooks.
Melanie have 35 notebooks.
35 – 15 = 20
Sarah have 20 fewer notebooks than Melanie.
Question 13.
How many notebooks do Melanie and Sarah have altogether?
Answer:
Sarah have 15 notebooks.
Melanie have 35 notebooks.
35 + 15 = 50
Melanie and Sarah have altogether 50 notebooks.
Question 14.
Who has twice as many notebooks as Sarah?
Answer:
Sarah have 15 notebooks.
15 x 2 = 30
Kareem have 30 notebooks.
Kareem has twice as many notebooks as Sarah.
Question 15.
Which two students have a total of 65 notebooks?
Answer:
Kareem have 30 notebooks.
Melanie have 35 notebooks.
30 + 35 = 65
Kareem and Melanie have a total of 65 notebooks.
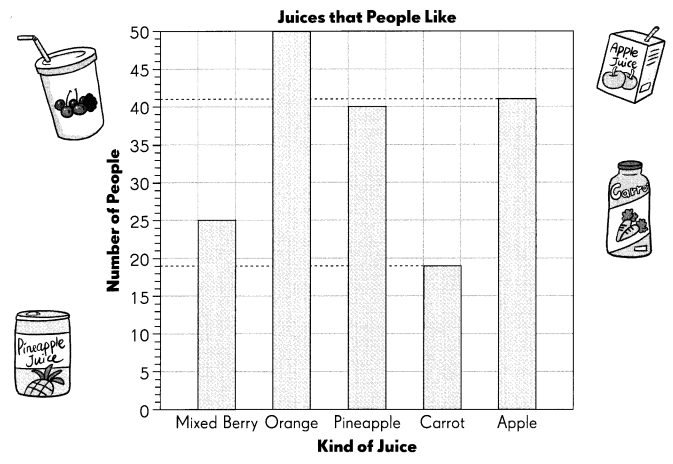
This bar graph shows the kinds of juices that people like.
Fill in the blanks. Use the data in the bar graph.
Question 16.
_________ people like mixed berry juice.
Answer:
25 people like mixed berry juice.
Question 17.
19 people like ________ juice.
Answer:
19 people like carrot juice.
Question 18.
The most popular juice is __________.
Answer:
The most popular juice is orange.
Question 19.
16 more people like apple juice than ___________ juice.
Answer:
41 people like apple juice.
25 people like Mixed Berry juice.
41 – 25 = 16
16 more people like apple juice than Mixed Berry juice.
Question 20.
10 fewer people like _________ juice than the most popular juice.
Answer:
The most popular juice is orange.
50 people like orange juice.
40 people like Pineapple juice.
50 – 40 = 10
10 fewer people like Pineapple juice than the most popular juice.
Question 21.
What can you say about orange juice and carrot juice?
Answer:
Both are same in color and sweet in taste.
Orange juice is a bit sweeter than a carrot juice.
Danny sold flowers at the farmer’s market. The bar graph shows the number of flowers he sold.
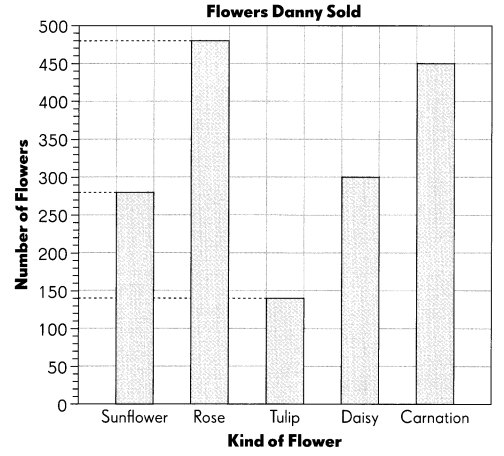
Answer each question. Use the data in the bar graph.
Question 22.
How many daisies did Danny sell?
Answer:
Danny sold 300 daisies.
Question 23.
He sold 150 more carnations than another flower. Which kind of flower?
Answer:
Danny sold 450 carnations.
Danny sold 300 daisies.
450 – 300 = 150
He sold 150 more carnations than daisies flower.
Question 24.
He sold twice as many sunflowers as another kind of flower. Which kind of flower?
Answer:
Total sunflowers he sold are 280.
Total Tulips he sold are 140
2 x 140 = 280
He sold twice as many sunflowers than Tulips.
Question 25.
How many fewer sunflowers than roses were sold?
Answer:
He sold 480 roses.
He sold 280 sunflowers.
480 – 280 = 200
He sold 200 fewer sunflowers than roses.
Question 26.
He sold a total of 750 of two kinds of flowers. Which two kind of flowers could they be?
Answer:
He sold 300 daisies.
He sold 450 carnations.
300 + 450 = 750
The two kind of flowers that he sold a total of 750 are daisies and carnations.
This bar graph shows the subjects that a number of students like.
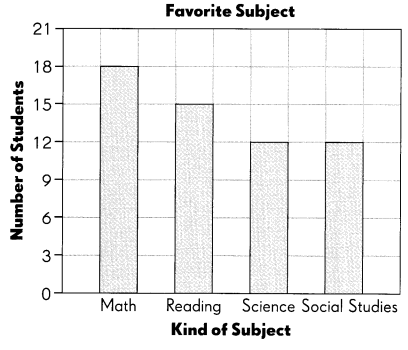
Fill in the blanks. Use the data in the bar graph.
Question 27.
__________ students like math.
Answer:
18 students like math.
Question 28.
3 fewer students like _________ than reading.
Answer:
3 fewer students like Science and Social studies than reading.
Question 29.
The number of students who like is _________ equal to the number of students who like _________.
Answer:
The number of students who like Science is equal to the number of students who like Social studies.
Question 30.
A total number of 39 students like three kinds of subjects. Which three kinds of subjects could they be?
Answer:
15 students like reading.
12 students like science.
12 students like social studies.
15 + 12 + 12 = 39
A total number of 39 students like three kinds of subjects. The three kinds of subjects are reading, science and social studies.