This handy Math in Focus Grade 2 Workbook Answer Key Chapter 17 Practice 4 Bar Graphs and Line Plots detailed solutions for the textbook questions.
Math in Focus Grade 2 Chapter 17 Practice 4 Answer Key Bar Graphs and Line Plots
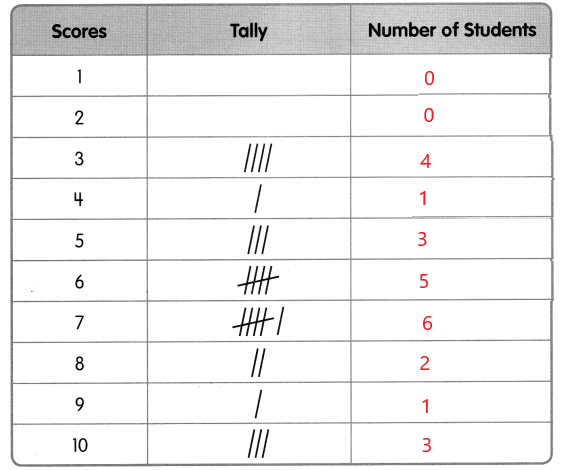
Ms. Rafael’s students took a Science quiz. Each student answered 10 questions. Each correct answer earned 1 point. The tally chart below shows the scores.
Complete.
Question 1.
Complete the tally chart.
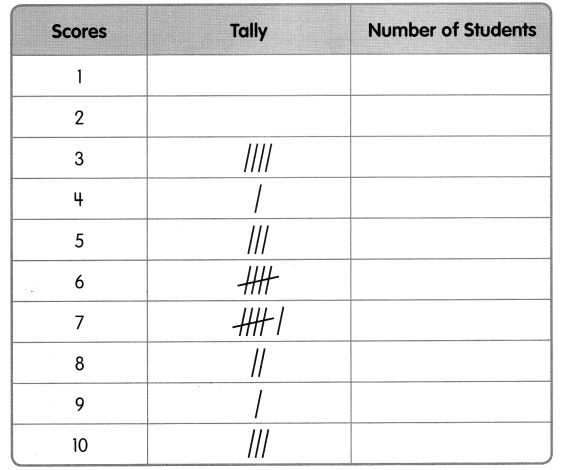
Answer:
Explanation:
I counted and wrote the number of tally marks
Number of tally marks is number of students.
Question 2.
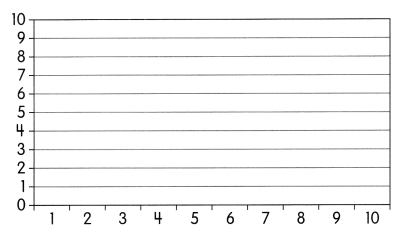
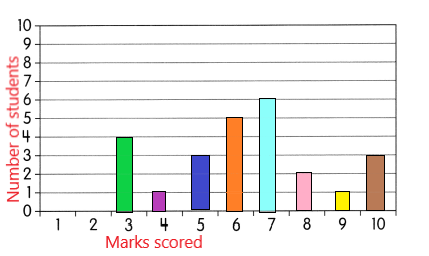
Complete the bar graph to show the data. Label your graph.
Answer:
Explanation:
I drew a bar graph to represent the number of students and their scores.
Question 3.
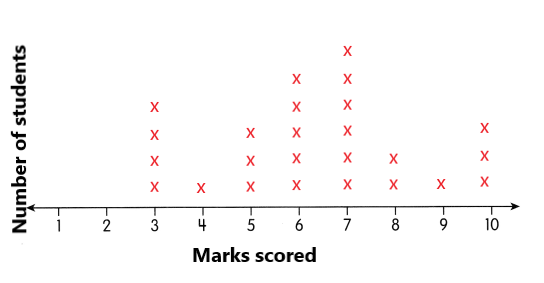
Use the data in the bar graph to create a line plot.
Answer:
Explanation:
I created a line plot to represent the score of the students.
Use the bar graph or line plot to answer the questions.
Question 4.
How many students scored 6 points?
___________ students
Answer:
5 students scored 6 points.
Question 5.
How many students scored more than 5 points?
___________ students
Answer:
3 students scored 5 points.
Question 6.
How many students took the Science quiz?
___________ students
Answer:
25 students took the science quiz.
Question 7.
Ms. Rafael awarded a sticker to each student who scored more than 7 points.
How many stickers did she give out? ___________ stickers
Answer:
6 stickers
Explanation:
Number of students who scored more than 7 points are awarded a sticker
2 students scored 8 points
1 student scored 9 points
3 students scored 10 points
2 + 1 + 3 = 6
So, 6 students are awarded stickers
Therefore, Ms. Rafael gave out 6 stickers.