This handy Math in Focus Grade 6 Workbook Answer Key Chapter 13 Lesson 13.1 Collecting and Tabulating Data detailed solutions for the textbook questions.
Math in Focus Grade 6 Course 1 B Chapter 13 Lesson 13.1 Answer Key Collecting and Tabulating Data
Math in Focus Grade 6 Chapter 13 Lesson 13.1 Guided Practice Answer Key
Complete. Use the data in the table.
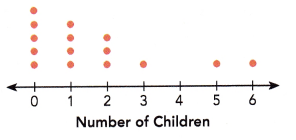
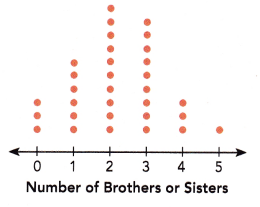
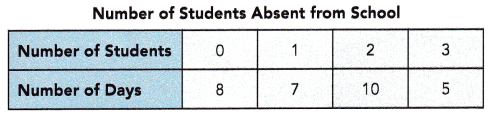
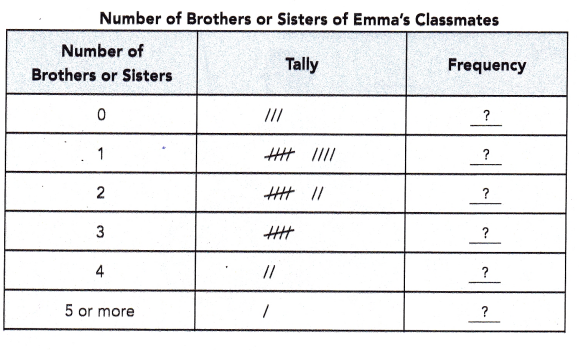
Emma used a questionnaire to find out the number of brothers or sisters her classmates have in their families.
Then she used a tally chart to record what she had found.
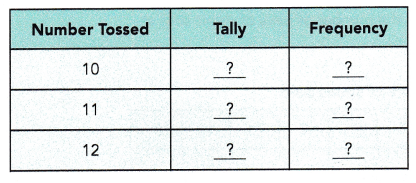
Question 1.
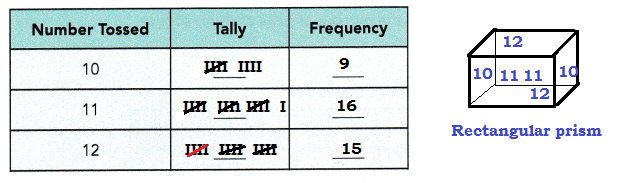
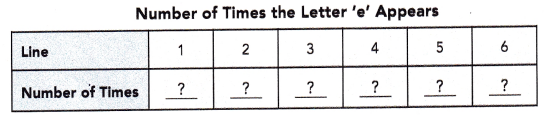
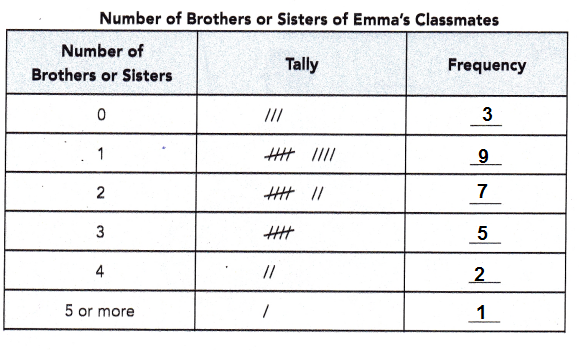
Copy and complete the table by counting the tally marks.
Answer:
Explanation:
Give that,
Emma used a questionnaire to find out the number of brothers or sisters her classmates have in their families.
Then she used a tally chart to record what she had found.
We know that the tally marks are a way to mark or record your counting.
Tally marks are a numerical system used to make counting easier.
As the name suggests, it is a system that helps keep the “tally” of things by number.
Tally marks are commonly used for counting scores, points, number of people, etc.
Tally marks differ from country to country, as each culture has developed its own systems.
Question 2.
More of Emma’s classmates have ![]() brother or sister than any other number.
brother or sister than any other number.
Answer:
1
Explanation:
Given that, Emma used a questionnaire to find out the number of brothers or sisters her classmates have in their families.
Then she used a tally chart to record what she had found.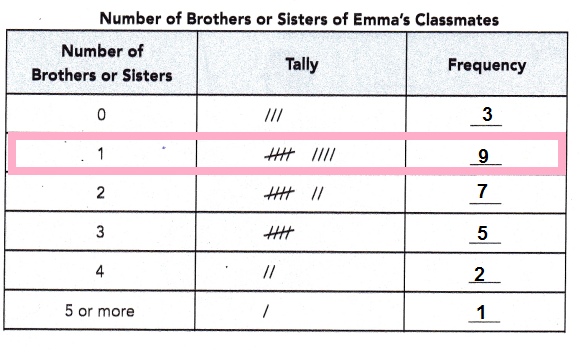
with reference to the above Tally marks and frequency table,
Emma’s classmates have 1 brother or sister than any other number.
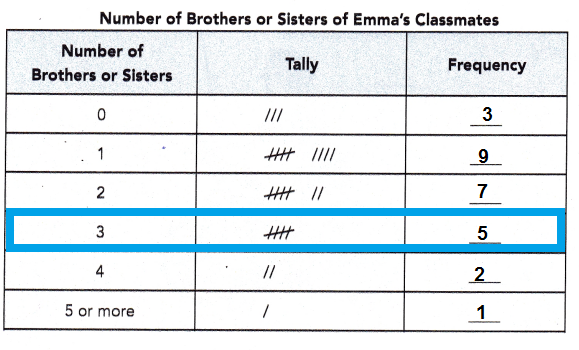
Question 3.
![]() of Emma’s classmates have 3 brothers or sisters in their families.
of Emma’s classmates have 3 brothers or sisters in their families.
Answer:
5 of Emma’s classmates have 3 brothers or sisters in their families.
Explanation:
Given that, Emma used a questionnaire to find out the number of brothers or sisters her classmates have in their families.
Then she used a tally chart to record what she had found.
with reference to the above Tally marks and frequency table,
5 of Emma’s classmates have 3 brothers or sisters in their families.
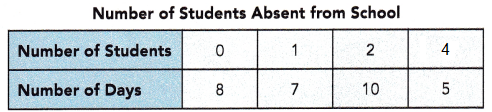
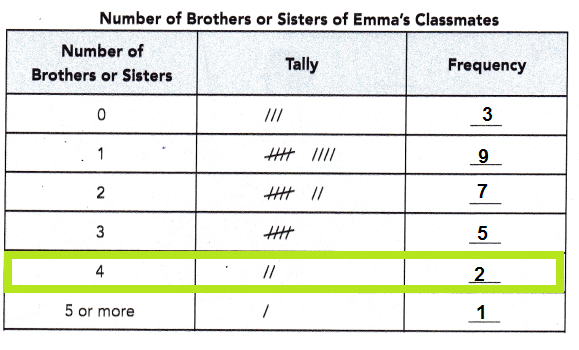
Question 4.
![]() of Emma’s classmates have 4 brothers or sisters in their families.
of Emma’s classmates have 4 brothers or sisters in their families.
Answer:
2 of Emma’s classmates have 4 brothers or sisters in their families.
Explanation:
Given that, Emma used a questionnaire to find out the number of brothers or sisters her classmates have in their families.
Then she used a tally chart to record what she had found.
with reference to the above Tally marks and frequency table,
2 of Emma’s classmates have 4 brothers or sisters in their families.
Question 5.
How many more of Emma’s classmates have 2 brothers or sisters than 5 or more brothers or sisters in their families?
Answer:
6 of Emma’s classmates have 2 brothers or sisters than 5 or more brothers or sisters in their families.
Explanation:
Given that, Emma used a questionnaire to find out the number of brothers or sisters her classmates have in their families.
Then she used a tally chart to record what she had found.
7 of Emma’s classmates have 2 brothers or sisters in their families
1 of Emma’s classmates have more then 5 brothers or sisters in their families
if we subtract as follows
7 – 1 = 6
6 many more of Emma’s classmates have 2 brothers or sisters than 5 or more brothers or sisters in their families.
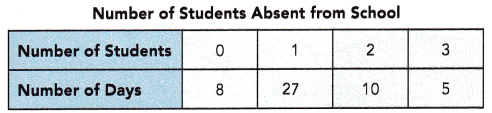
Question 6.
Emma has ![]() classmates altogether.
classmates altogether.
Answer:
27
Explanation:
Given that, Emma used a questionnaire to find out the number of brothers or sisters her classmates have in their families.
Then she used a tally chart to record what she had found.
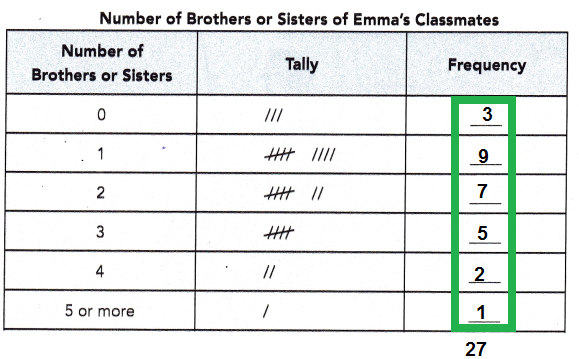
So, Emma has 27 classmates altogether.
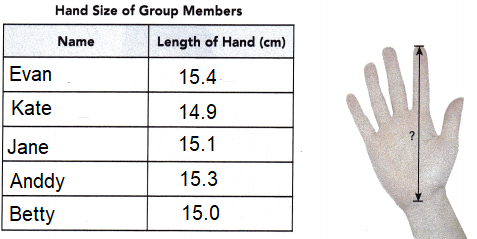
Hands-On Activity
COLLECT, TABULATE, AND INTERPRET DATA
Materials:
- blank table
- ruler
- collection of pencils
Work in groups of three or four.
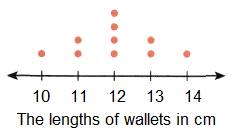
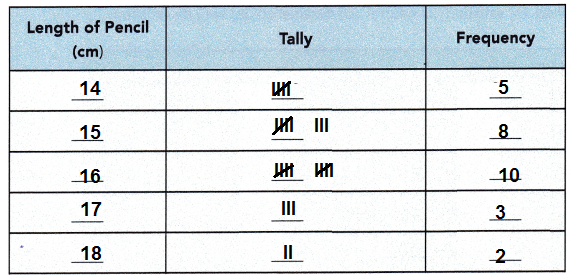
Step 1: Collect a set of pencils of various lengths. Use a ruler to measure the length of each pencil to the nearest centimeter. Use tally marks to record the data.
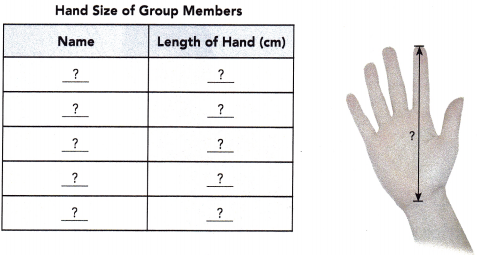
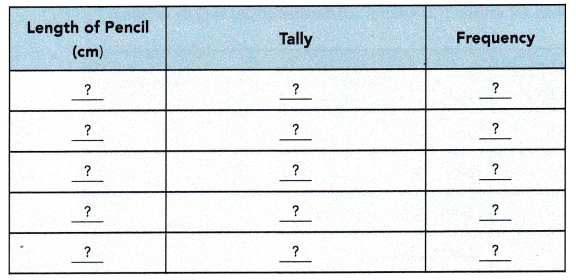
Step 2: Tally your results on a table like the one below. Then count the tally marks to complete the table.
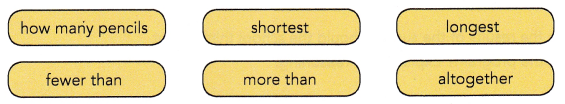
Step 3: Write at least four questions about the data in the table using these phrases.
Answer:
Explanation:
We know that the tally marks are a way to mark or record your counting.
Tally marks are a numerical system used to make counting easier.
As the name suggests, it is a system that helps keep the “tally” of things by number.
Tally marks are commonly used for counting scores, points, number of people, etc.
Tally marks differ from country to country, as each culture has developed its own systems.
Write at least four questions about the data in the above table.
1) How many pencils are of shortest lengths?
Answer:
5 pencils.
Explanation:
Given that to collect a set of pencils of various lengths.
Use a ruler to measure the length of each pencil to the nearest centimeter.
Use tally marks to record the data.
Tally your results on a table like the one above.
Then count the tally marks to complete the table.
with reference to the above table, there are 5 pencils of length 14 cm are shortest.
2) How many pencils are of longest lengths?
Answer:
2 pencils.
Explanation:
Given that to collect a set of pencils of various lengths.
Use a ruler to measure the length of each pencil to the nearest centimeter.
Use tally marks to record the data.
Tally your results on a table like the one above.
Then count the tally marks to complete the table.
with reference to the above table, there are 2 pencils are of length 18 cm are longest.
3) How many pencils are of more number of which lengths?
Answer:
10 pencils.
Explanation:
Given that to collect a set of pencils of various lengths.
Use a ruler to measure the length of each pencil to the nearest centimeter.
Use tally marks to record the data.
Tally your results on a table like the one above.
Then count the tally marks to complete the table.
with reference to the above table, there are 10 pencils are of length 16 cm long.
4) Altogether total how many pencils are of different lengths?
Answer:
28 pencils.
Explanation:
Given that to collect a set of pencils of various lengths.
Use a ruler to measure the length of each pencil to the nearest centimeter.
Use tally marks to record the data.
Tally your results on a table like the one above.
Then count the tally marks to complete the table.
with reference to the above table, there are 28 pencils are of different lengths.
Math in Focus Course 1B Practice 13.1 Answer Key
Copy and complete the table. Solve.
Question 1.
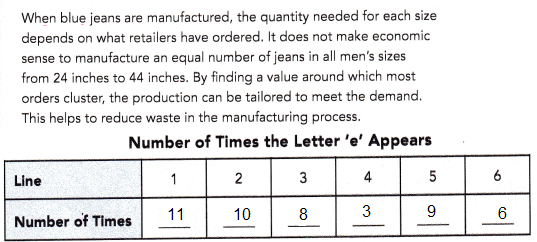
A shampoo company wanted to find out more about its customers. So they asked 30 customers to indicate their income bracket:
Below $500 per week
$500—$1,000 per week
Over $1,000 per week
A tally chart was used to record the findings.
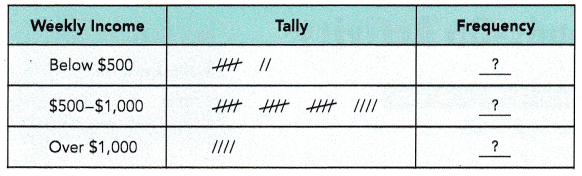
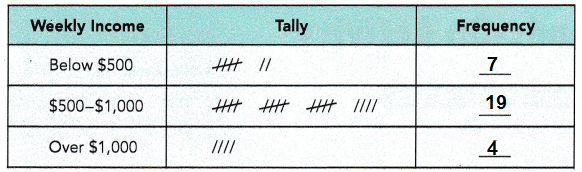
How many customers have a weekly income of $1,000 or less?
Answer:
26 customers.
Explanation:
Given that, A shampoo company wanted to find out more about its customers.
So they asked 30 customers to indicate their income bracket:
Below $500 per week
$500—$1,000 per week
Over $1,000 per week
A tally chart was used to record the findings.
with reference to the table below,
the total number of customers have a weekly income of $1,000 or less are 26.
customers have a weekly income of $500 – $1,000 is 19 and
customers have a weekly income of $500 are 7
19 + 7 = 26 customers
Question 2.
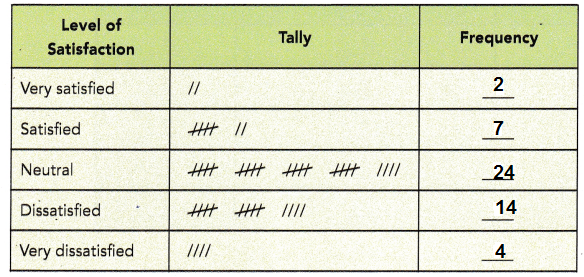
Fifty students were asked their level of satisfaction with the school’s music program. The following responses were the choices provided:
(a) very satisfied (b) satisfied (c) neutral (d) dissatisfied (e) very dissatisfied.
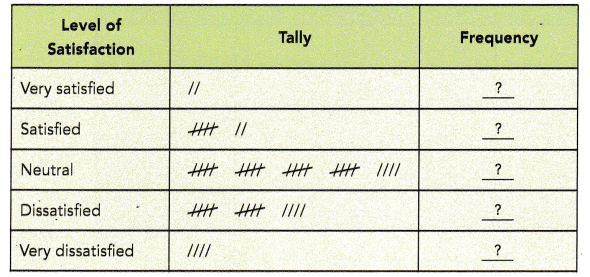
a) How many students are satisfied or very satisfied?
Answer:
students are satisfied = 7
students are very satisfied = 2
Explanation:
Given that, Fifty students were asked their level of satisfaction with the school’s music program.
The following responses were the choices provided:
(a) very satisfied (b) satisfied (c) neutral (d) dissatisfied (e) very dissatisfied.
With reference to the above table, students are satisfied or very satisfied is shown below.
students are satisfied = 7
students are very satisfied = 2
b) Based on the results of the survey, should the school think about changing the program? Explain your reasoning.
Answer:
YES
Explanation:
Given that, Fifty students were asked their level of satisfaction with the school’s music program.
The following responses were the choices provided:
(a) very satisfied (b) satisfied (c) neutral (d) dissatisfied (e) very dissatisfied.
Based on the above table results of the survey,
the school think about changing the program due to less satisfied and very satisfied out of 50 students.
Question 3.
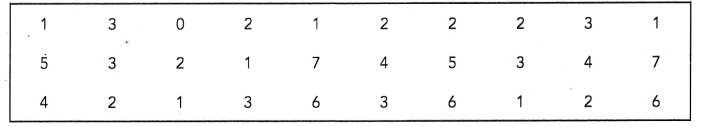
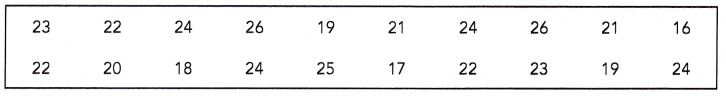
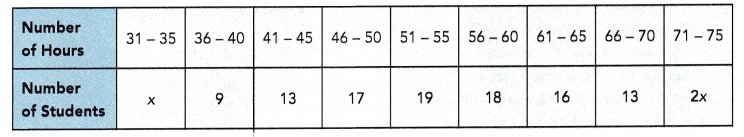
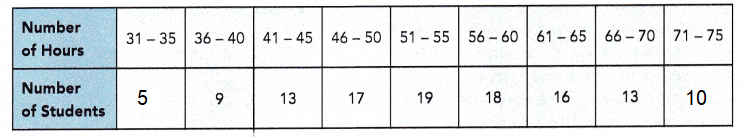
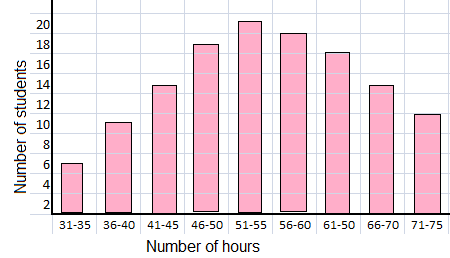
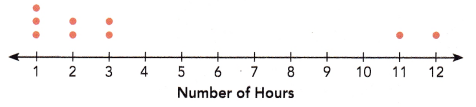
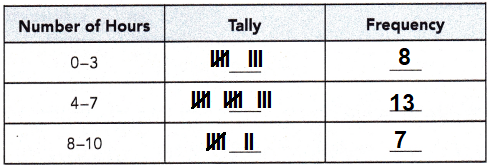
A mathematics teacher wanted to find out how many hours per week his students spent on math homework. The average number of hours reported by each student is shown.
5, 3, 6, 8, 2, 4, 2, 1, 9, 1, 9, 6, 4, 6, 5, 1, 10, 1, 5, 6, 7, 8, 6, 10, 7, 5, 2, 8
Arrange the numbers in ascending order.
1,1, 1, 1, 2, 2, 2, 3, 4, 4, 5, 5, 5, 5, 6, 6, 6, 6, 6, 7, 7, 8, 8, 8, 9, 9, 10, 10
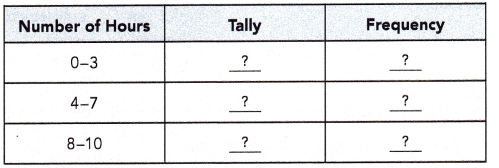
How many students spent more than 3 hours per week on their math homework?
Answer:
20 students spent more than 3 hours and less then per week on their math homework.
Explanation:
Given that, A mathematics teacher wanted to find out how many hours per week his students spent on math homework.
The average number of hours reported by each student is shown.
5, 3, 6, 8, 2, 4, 2, 1, 9, 1, 9, 6, 4, 6, 5, 1, 10, 1, 5, 6, 7, 8, 6, 10, 7, 5, 2, 8
Arrange the numbers in ascending order.
1,1, 1, 1, 2, 2, 2, 3, 4, 4, 5, 5, 5, 5, 6, 6, 6, 6, 6, 7, 7, 8, 8, 8, 9, 9, 10, 10
With reference to the given information,
13 students spent more than 4 hours per week on their math homework.
13 + 7 = 20
Question 4.
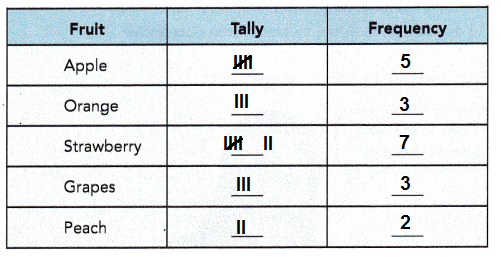
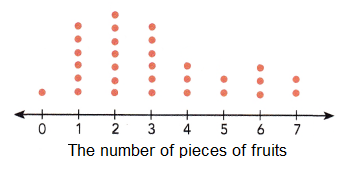
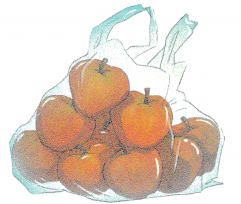
Shelly conducted a survey among her friends. She asked them to choose their favorite fruit from this list of fruits: apple, orange, strawberry, grapes, and peach. These are the data she collected:
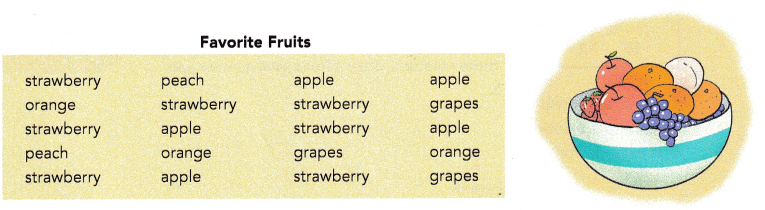
Tabulate the data.
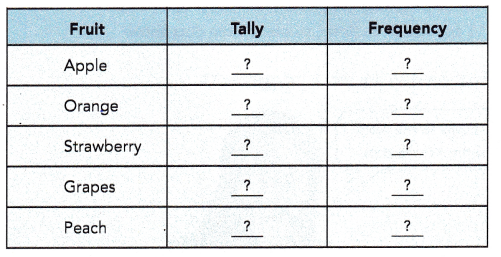
What is the favorite fruit of Shelly’s friends?
Answer:
Strawberry.
Explanation:
Given that, Shelly conducted a survey among her friends.
She asked them to choose their favorite fruit from this list of fruits: apple, orange, strawberry, grapes, and peach.
These are the data she collected:
With reference to the survey among her friends.
Shelly friend’s favorite fruit from the list of fruits: apple, orange, strawberry, grapes, and peach:
Strawberry is favorite fruit as shown below.