This handy Math in Focus Grade 8 Workbook Answer Key Cumulative Review Chapters 10-11 detailed solutions for the textbook questions.
Math in Focus Grade 8 Course 3 B Cumulative Review Chapters 10-11 Answer Key
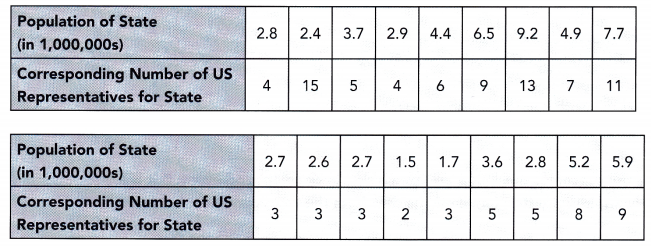
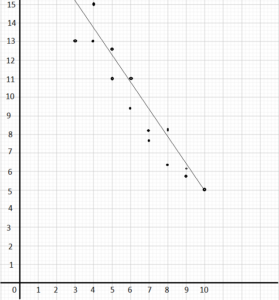
Construct a scatter plot for each table of bivariate data. Identify any outliers. (Lesson 10.1)
Question 1.
Use 1 centimeter on the horizontal axis to represent 1 unit and 1 centimeter on the vertical axis to represent 100 units.
Answer:
Question 2.
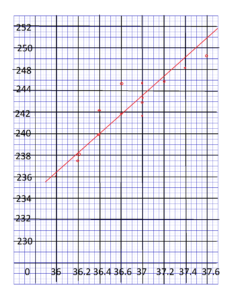
Use 1 centimeter on the horizontal axis to represent 0.2 units for x interval from 36.0 to 38.0 and 1 centimeter on the vertical axis to represent 2 units for y interval from 230 to 252.
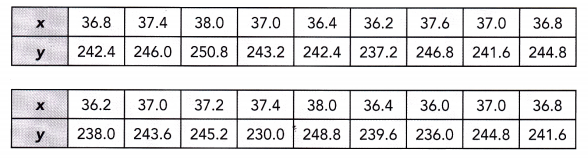
Answer:
Describe any association between the bivariate data in each scatter plot. (Lesson 10.1)
Question 3.
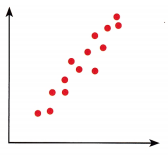
Answer:
One variable increasing with another has a positive association, otherwise, it is negative. If the scatter plot follows a straight line then it is the linear association, otherwise, it is nonlinear association. If it is hard to find the arrangement of the variables then it has a weak association, otherwise, it has a strong association. In this case, the graph has positive, strong and linear associations.
Question 4.
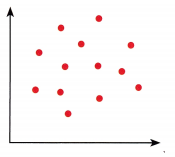
Answer:
If it is hard to identify the arrangement of the variables then it has a weak association and when it seems it has no pattern at all then it has no association. For this case, the graph has no association at all.
State the line that represents a line of best fit for each scatter plot. (Lesson 10.2)
Question 5.
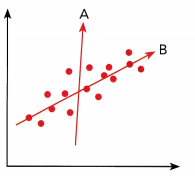
Answer:
Line B fits the scatter plot, as it is the straight line that shows the data on scatter plot when compared with the Line A.
Question 6.
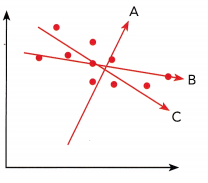
Answer:
Line C fits the scatter plot, It is the most possible straight line that shows the data on a scatter plot in comparison with Line A and Line B.
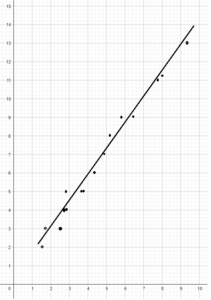
Construct each scatter plot and draw a line of best fit for the given table of bivariate data. (Lesson 10.2)
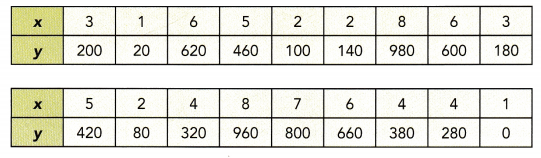
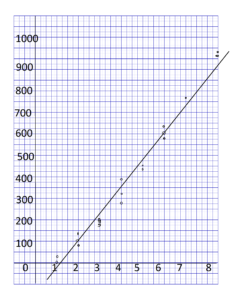
Question 7.
Use 1 centimeter on the horizontal axis to represent 1 unit and 1 centimeter on the vertical axis to represent 2 units.
Answer:
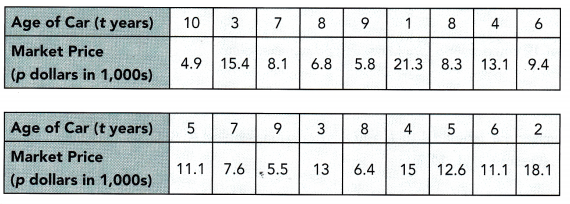
Question 8.
Use 1 centimeter to represent 1 unit on both axes.
Answer:
Identify whether the given data is qualitative or quantitative. (Lesson 10.3)
Question 9.
Number of eggs hatched
Answer: Quantitative
Question 10.
Ice cream flavors
Answer: Qualitative
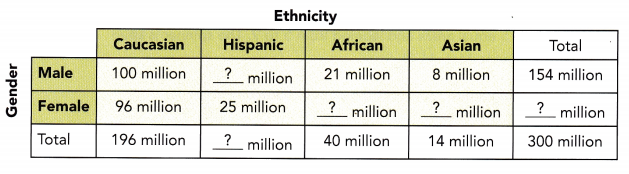
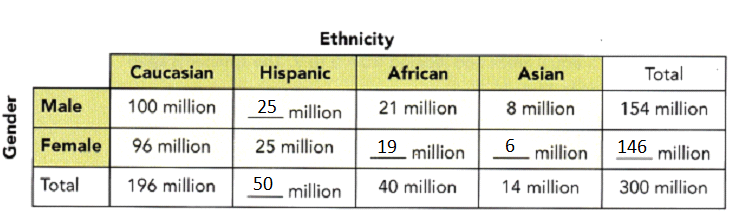
Copy and fill in the missing information in the two-way table. (Lesson 10.3)
Question 11.
Answer:
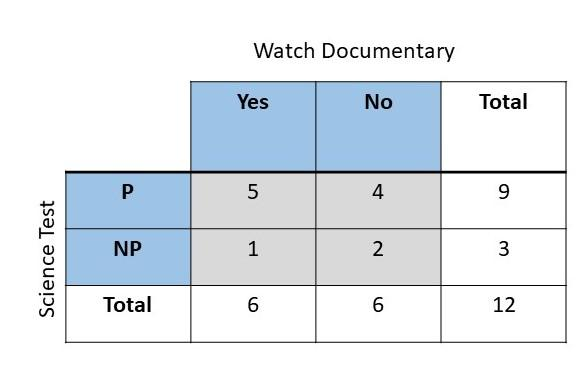
Construct a two-way table using the given data. (Lesson 10.3)
Question 12.

W represents watch the documentary
NW represents did not watch the documentary
P represents passed the science test
NP represents did not pass the science test
Answer:
Tell whether the outcomes described are from a simple or compound event. If it is a compound event, identify the simple events that form the compound event. (Lesson 11.1)
Question 13.
Drawing a blue marble followed by a green marble, without replacing the first marble, from a box containing 2 red, 5 blue, and 3 green marbles.
Answer:
Compound event is composed of more than 1 simple event, Since there are two draws, the first draw to obtain a blue marble and the second one is to pick the green marble. Therefore, this is a compound event.
Question 14.
Getting a number between 2 and 5 when rolling a fair six-sided number die.
Answer:
Rolling a die to obtain a number between 2 and 5 once is one single event. It is possible to get in one single event, therefore this is a simple event.
Question 15.
Getting a product of 12 when rolling two fair six-sided number dice.
Answer:
Since there are two dices to roll, the first roll is the first event and the second dice is rolled to get 12 when the digit obtained is multiplied is the second event. Therefore, this is a compound event.
Solve. Show your work.
Question 16.
A fair four-sided number die, labeled 4 to 7, and a letter cube, labeled A, B, C, D, E, and E, are rolled. (Lessons 11.1, 11.2)
a) Draw a possibility diagram to represent the possible outcomes.
Answer:
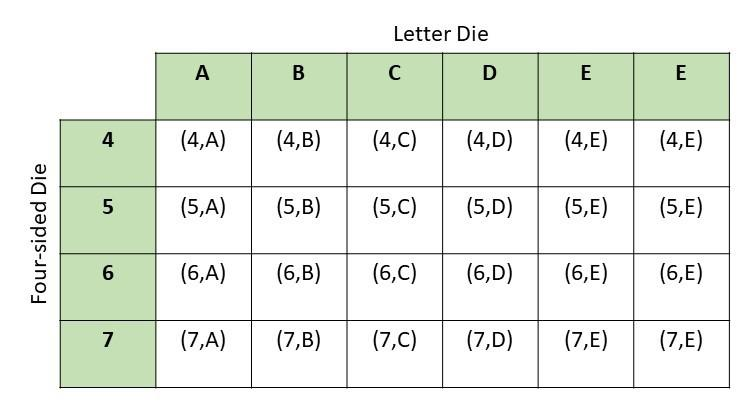
b) Find the probability of getting the letter E.
Answer:
There are 24 possible outcomes and 8 have E,
Probability = favorable outcomes / total outcomes
= 8/24
= 1/3
Question 17.
Two fair six-sided number dice numbered 1 to 6 are rolled. (Lessons 11.1, 11.2)
a) Draw a possibility diagram to represent the possible outcomes.
Answer:
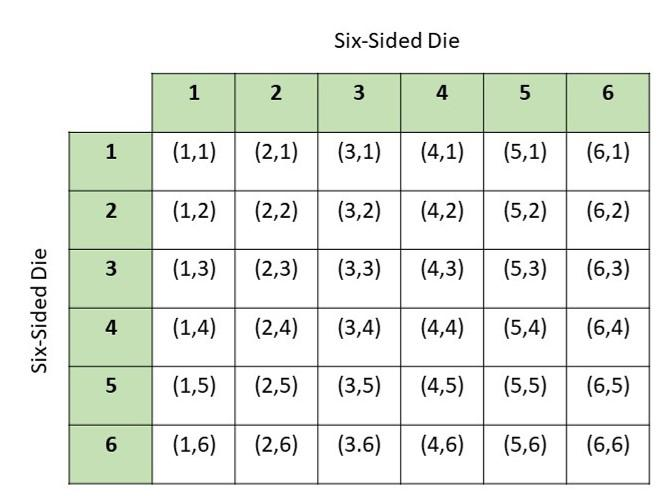
b) Find the probability that the outcomes for both six-sided number dice are even.
Answer:
There are total of 36 possibe outcomes and 9 obtained even numbers on both the dice
Probability = favorable outcomes/total outcomes
= 9/36
= 1/4
c) Find the probability that the product of the two numbers is a prime number.
Answer:
There are total of 36 possibe outcomes and 6 obtained prime numbers on both the dice
Probability = favorable outcomes/total outcomes
= 6/36
= 1/6
Question 18.
Spinner P is divided into 5 equal areas and labeled from 5 to 9. The spinner is spun and a coin is tossed. (Lessons 11.1, 11.2)
a) Draw a possibility diagram to represent the possible outcomes.
Answer:
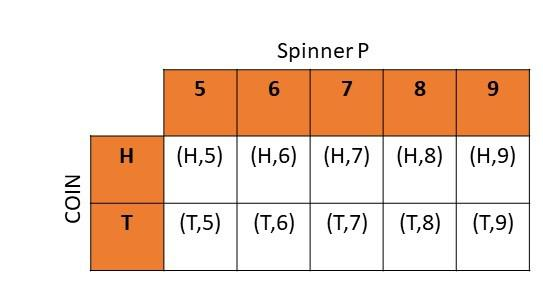
b) Find the probability of getting heads and an even number.
Answer:
There are total of 10 possibe outcomes and 2 results have head and even numbers in it
Probability = favorable outcomes/total outcomes
= 2/10
= 1/5
Question 19.
There are 4 yellow highlighters, 2 blue highlighters, and 3 purple highlighters in bag A. There are 2 white balls and 4 blue balls in bag B. A highlighter is randomly drawn from bag A, and then a ball is randomly drawn from bag B. (Lesson 11.3)
a) Draw a tree diagram to represent the possible outcomes and their corresponding probabilities.
Answer:
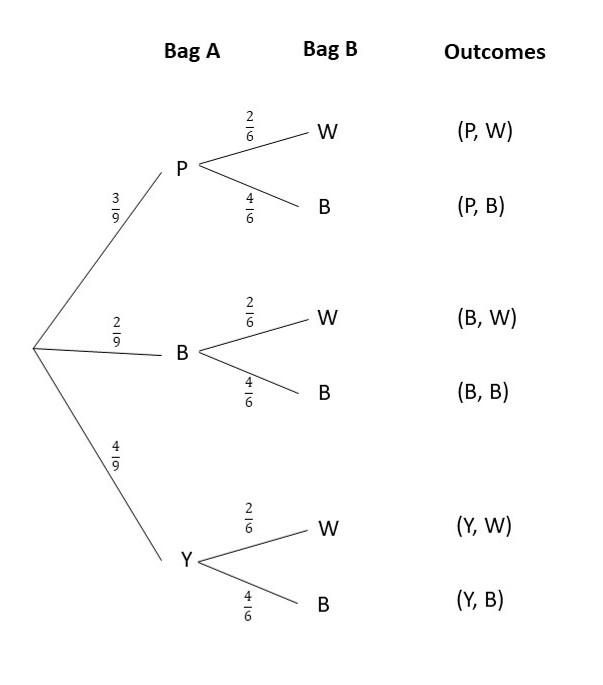
b) What is the probability of drawing a yellow highlighter and a blue ball?
Answer:
For the probability of obtaining a blue ball after obtaining a yellow highlighter denoted as P(Y,B), the probability of getting a yellow highlighter in the Bag A is 4/9 while the probability of selecting a blue ball in the Bag B is P(B) after getting a yellow highlighter is 4/6 then,
Probability = P(Y) x P(B)
= 4/9 x 4/6
= 16/54
= 8/27
c) What is the probability of drawing a highlighter and a ball that are the same color?
Answer:
For the probability of obtaining a blue highlighter followed by a blue ball denoted as P(B,B), the probability of getting a blue highlighter in the Bag A P(B) is 2/9 while the probability of selecting a blue ball in the Bag B is P(B) is 4/6 then,
Probability = P(Y) x P(B)
= 2/9 x 4/6
= 8/54
= 4/27
d) What is the probability of drawing exactly one blue item?
Answer:
The probability of selecting one blue item is the probability of getting one purple highlighter and a blue ball P(P,B) or the probability of selecting yellow highlighter and a blue ball P(Y,B) or the probability of obtaining a blue highlighter and white ball P(B,W)
P(P,B)+P(Y,B)+P(B,W)
= P(P) . P(B) + P(Y) . P(B) + P(B) . P(W)
= 3/9 x 4/6 + 4/9 x 4/6 + 2/9 x 2/6
= 12/54 + 16/54 + 4/54
= 32/54
= 16/27
Question 20.
A box contains 16 color cards: 5 red, 4 blue, and 7 green. Two cards are picked at random from the box, one after another without replacement. The tree diagram shows the possible outcomes and the corresponding probabilities. (Lesson 11.4)
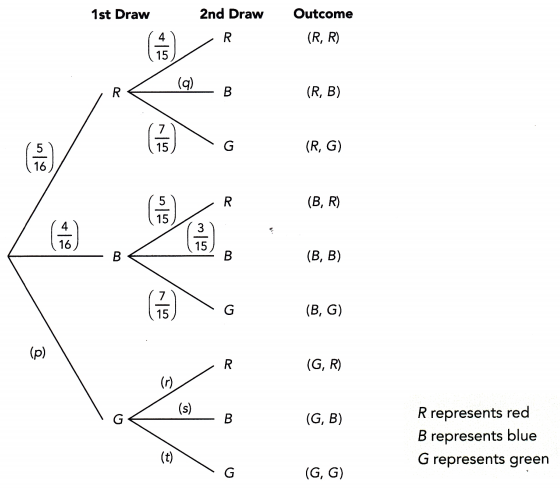
a) Find the values of p, q, r, s, and t.
Answer:
To find the value of p:
P(B) + P(R) + p = 1
4/16 + 5/16 + p = 1
9/16 + p = 1
p = 1 – 9/16
p = 7/16
To find the value of q:
P(G) + P(R) +p = 1
7/15 + 4/15 + p = 1
11/15 + p = 1
p = 1 – 11/15
p = 4/15
To find the value of r:
The probability of obtaining red in the second pick is 5/15 or 1/3.
To find the value of s:
The probability of obtaining blue denoted as s in the second pick is 4/15.
To find the value of t:
The probability of obtaining green denoted as t in the second pick is 6/15.
b) Find the probability that both cards are green.
Answer:
P(G,G) = P(G) x P(G)
= 7/16 x 6/15
= 42/240
= 7/40
c) Find the probability that both cards are the same color.
Answer:
P(G,G) + P(B,B) + P(R,R)
=P(G) x P(G) + P(B) x P(B) + P(R) x P(R)
=7/16 x 6/15 + 4/16 x 3/15 + 5/16 x 4/15
= 42/240 + 12/240 + 20/240
= 74/240
= 37/120
d) Find the probability that both cards are different colors.
Answer:
P(M) + P(NM) = 1
37/120 + P(NM) = 1
P(NM) = 1 – 37/120
P(NM) = 83/120
e) Find the probability that both cards are blue or both are green.
Answer:
P(G,G) or P(B,B) = P(G,G) + P(B,B)
= P(G) x P(G) + P(B) x P(B)
= 7/16 x 6/15 + 4/16 x 4/15
= 42/240 + 12/240
= 54/240
= 9/40
Problem Solving
Solve. Show your work.
Question 21.
Alan has 3 pencils in a box: 1 blue, 1 red, and 1 orange. He has 1 blue marker and 2 red markers in another box. Alan randomly selects a pencil and a marker. Use a possibility diagram to represent the possible outcomes. Then find the probability of getting the same colors for the pencil and marker. (Chapter 11)
Answer:
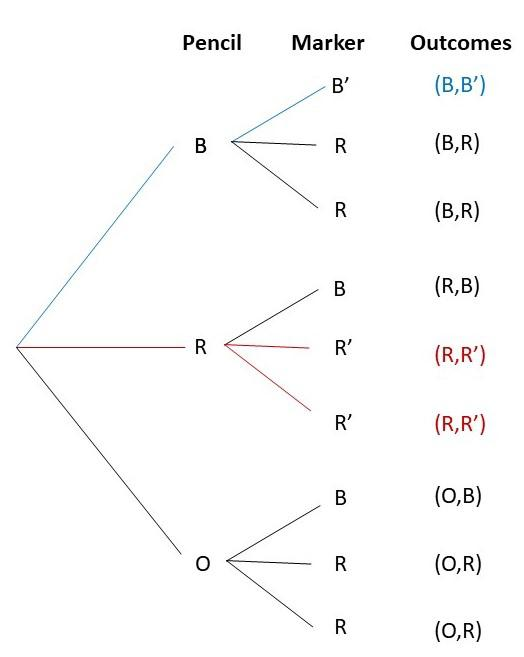
There are total of 9 outcomes and 3 favorable outcomes, then
Probability = favorable outcomes / total outcomes
= 3/9
= 1/3
Question 22.
Joyce rolled a fair six-sided number die labeled 1 to 6 and a fair four-sided number die labeled 2 to 5. Use a possibility diagram to find the probability that the product of the two resulting numbers is at least 20. (Chapter 11)
Answer:
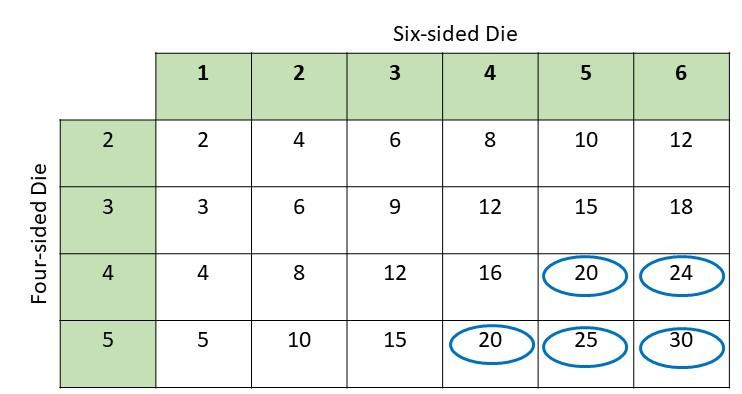
Explanation:
There are 36 total outcomes and 5 are greater than or equal to 20 then,
Probability = favorable outcomes / total outcomes
= 5/36
Refer to the scenario below to answer questions 23 to 28.
The data below shows the amount of electricity consumption and cost for some households in a particular month. (Chapter 10)
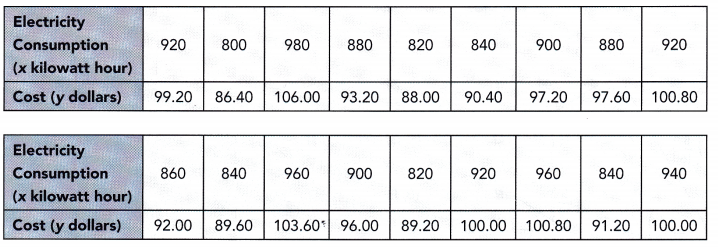
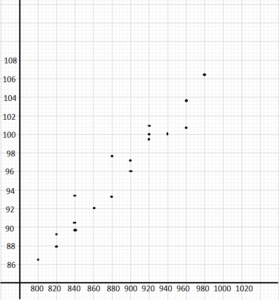
Question 23.
Construct a scatter plot for the given bivariate data. Use 1 centimeter on the horizontal axis to represent 20 kilowatt-hour for the x interval from 800 to 1,000 and 1 centimeter on the vertical axis to represent 2 dollars for the y interval from 86 to 108.
Answer:
Question 24.
Describe the association between the electricity consumption and the cost.
Answer: The variable have a positive and linear association. Then, a high electricity usage corresponds to a high cost and a low consumption means a lower price.
Question 25.
Draw a line of best fit.
Answer:
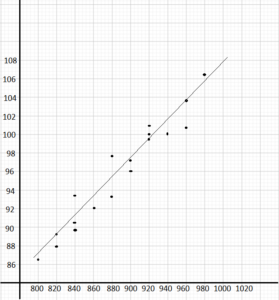
Question 26.
Write an equation for the line of best fit. Use points (820, 88) and (900, 97).
Answer:
For the equation of the line that best fits , using the points that best fits line passes through (820,88) and (900,97) to solve the slope of the line.
Slope of the line m = y2 – y1/ x2 – x1
m = 97 – 88 / 900 – 820
m = 9 / 80
m = 0.11
Using the slope intercept form given by y = mx + b, where m is the slope, b is the y intercept
y = mx + b
88 = (0.11)820 + b
88 = 90.2 + b
b = 90.2 – 88
b = 2.2
Therefore, the equation of line best fits is y = 0.11x + 2.2
Question 27.
Using the equation in 26, predict the cost per month for an electricity consumption of 888 kilowatt hour in that particular month.
Answer:
To estimate the price x given the electricity usage y, study the graph and the line of best fit at the point y at 888 kw. The point is on (888, 96.8).
Therefore, a household with 888 kw per hour consumption will pay around $96.8
Question 28.
Using the equation in 26, predict the cost per month for an electricity consumption of 1,000 kilowatt hour in that particular month.
Answer:
By using the equation of the line the cost of electricity consumption of 1000 kw per hour is calculated as
y = mx + b
y = 0.11(1000) + 2.2
y = 110 + 2.2
y = 112.2
Solve. Show your work.
Question 29.
Bag A contains 25 tomatoes, 4 of which are rotten. Bag B contains 15 tomatoes, 6 of which are rotten. Jamie randomly selects a tomato from bag A followed by another random selection from bag B. (Chapter 11)
a) Draw a tree diagram to represent the possible outcomes and their corresponding probabilities.
Answer:
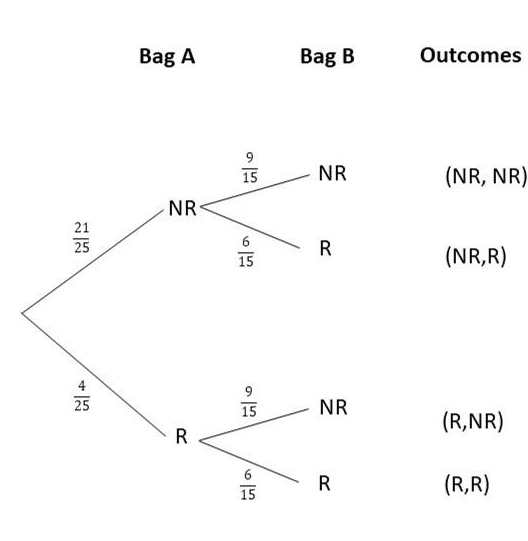
b) What is the probability that both tomatoes are rotten?
Answer:
P(R,R) = P(R) x P (R)
= 4/25 x 6/15
=24/375
= 8/125
c) What is the probability that exactly one tomato is rotten?
Answer:
P(NR,R) or P(R,NR) = P(NR,R) + P(R,NR)
= P(NR) x P(R) + P(R) x P(NR)
= 21/25 x 6/15 + 4/25 x 9/15
= 126/375 + 36/375
= 162/375
= 54/375
d) What is the probability that at least one tomato is not rotten?
Answer:
P(R,NR) + P(NR,R) + P(R,R)
= P(R) x P(NR) + P(NR) x P(R) + P(R) x P(R)
= 4/25 x 9/15 + 21/25 x 6/15 + 4/25 x 6/15
= 36/375 + 126/375 + 24/375
= 186/375
= 62/125
Question 30.
The probability that Jeremy wakes up late is 0.3. Jeremy can choose to cycle, take a bus, or drive a car to the gym. If he does not wake up late, the probability that he cycles is 0.5, takes a bus is 0.4, and drives a car is 0.1. If he wakes up late, the probability that he cycles is 0.05, takes a bus is 0.2, and drives a car is 0.75. (Chapter 11)
a) Draw a tree diagram to represent the possible outcomes and their corresponding probabilities.
Answer:
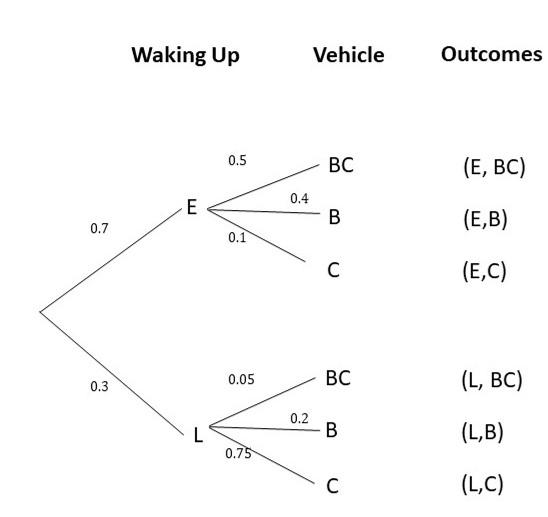
b) Find the probability that Jeremy will wake up and cycle to the gym.
Answer:
P(L,BC) = P(L) x P(BC)
= 0.3 x 0.05
= 0.015
c) Find the probability that Jeremy will not wake up late and will drive a car to the gym.
Answer:
P(E,C) = P(E) x P(C)
= 0.7 x 0.1
= 0.07
d) Find the probability that Jeremy will take a bus to the gym.
Answer:
P(E,B) or P(L,B) = P(E,B) + P(L,B)
= P(E) x P(B) + P(L) x P(B)
= 0.7 x 0.4 + 0.3 x 0.2
= 0.28 + 0.06
= 0.34
Refer to the scenario below to answer questions 31 to 34.
The data below shows the gender and favorite sport of 12 students surveyed. (Chapter 10)
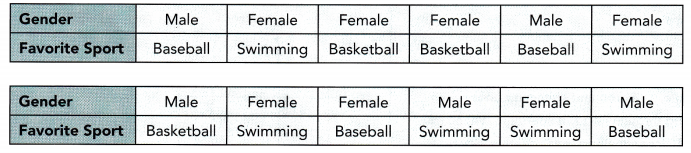
Question 31.
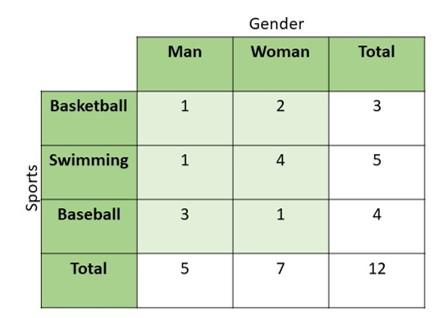
Construct a two-way table using the above data.
Answer:
Question 32.
Describe the association between genders and favorite sports based on the given data.
Answer:
The total number of female who answers the survey is greater than the number of boys who accomplished the same activity. Swimming got the most number of votes compared to the other two. Therefore, more female students engage to sports compared to the male population and the most favorite sport is swimming.
Question 33.
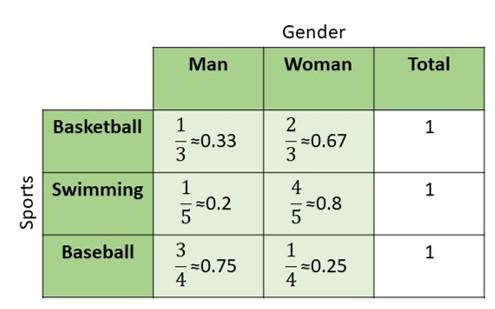
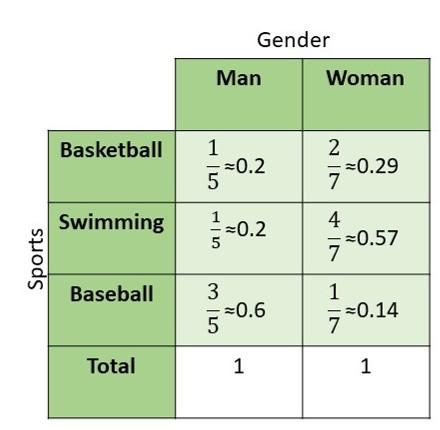
Copy and find the relative frequencies (to the nearest hundredth) to compare the distribution of the genders among the different favorite sports (columns).
Answer:
Question 34.
Copy and find the relative frequencies (to the nearest hundredth) to compare the distribution of the favorite sports among the genders (rows).
Answer: