Practice the problems of Math in Focus Grade 7 Workbook Answer Key Chapter 5 Lesson 5.2 Representing Direct Proportion Graphically to score better marks in the exam.
Math in Focus Grade 7 Course 2 A Chapter 5 Lesson 5.2 Answer Key Representing Direct Proportion Graphically
Math in Focus Grade 7 Chapter 5 Lesson 5.2 Guided Practice Answer Key
Tell whether each graph represents a direct proportion. If so, find the constant of proportionality. Then write a direct proportion equation.
Question 1.
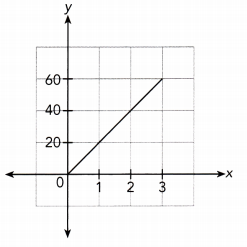
Answer:
The given graph is a straight line through the origin, and
It does not lie along the x — axis or y — axis.
So, It represents a direct proportion.
Because the graph passes through (1, 20),
The constant of proportionality is 20
The direct proportion equation Is :
\(\frac{y}{x}\) = \(\frac{20}{1}\)
x ∙ \(\frac{y}{x}\) = x ∙ \(\frac{20}{1}\)
y = 20x
The graph represent a Direct Proportion
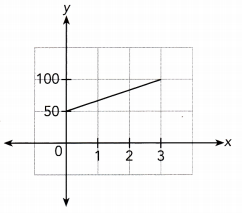
Question 2.
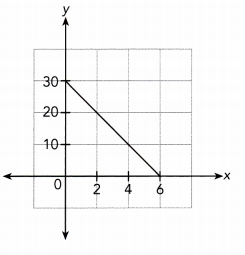
Answer:
The given graph is a straight line that does not lie along
the x — axis or y — axis but does not pass through the origin.
So, the given graph does not represents a direct proportion.
The graph does not represent a Direct Proportion
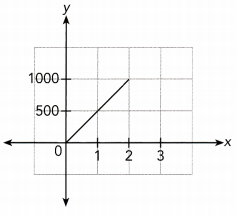
Question 3.
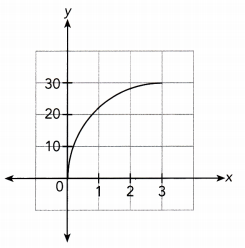
Answer:
3.
The given graph passes through the origin that does not lie along
the x — axis or y — axis but It is not a straight line.
So, the given graph does not represents a direct proportion.
The graph does not represent a Direct Proportion
Complete.
Question 4.
Ms. Gray is driving on a long distance trip. The distance she travels is directly proportional to time she travels. The graph shows the distance she travels, y miles, after t hours.
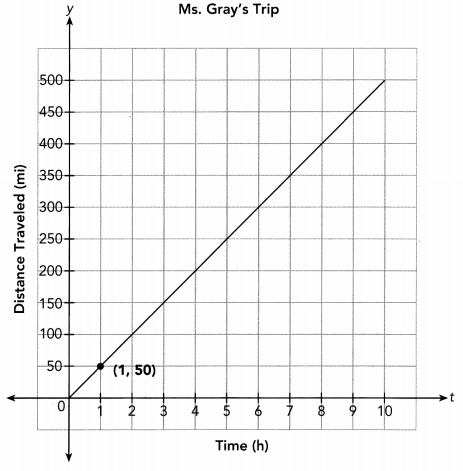
a) Find the constant of proportionality. What is Ms. Gray’s driving speed in miles per hour?
Constant of proportionality: \(\frac{?}{?}\) = ![]()
The constant of proportionality is ![]() . So, Ms. Gray’s driving speed is
. So, Ms. Gray’s driving speed is ![]() miles per hour.
miles per hour.
Answer:
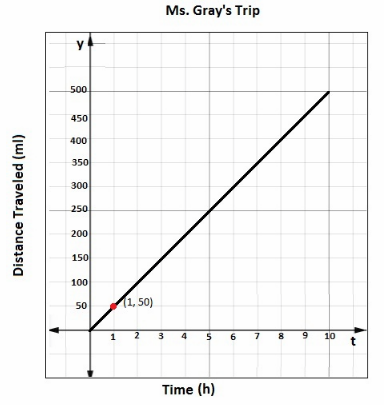
constant of Proportionality :\(\frac{y}{t}\) = \(\frac{50}{1}\) = 50
The Constant of Proportionality is 50.
So, Ms. Gray’s driving speed is 50 miles per hour.
b) Write a direct proportion equation.
The direct proportion equation is y = ![]() t.
t.
Answer:
\(\frac{y}{t}\) = \(\frac{50}{1}\)
t ∙ \(\frac{y}{t}\) = t ∙ \(\frac{50}{1}\)
c) Explain what the point (7, 350) represents in this situation.
It means that Ms. Gray travels ![]() miles in
miles in ![]() hours.
hours.
Answer:
It means that Ms. Gray travels 350 miles in 7 hours.
d) Find the distance traveled in 3 hours.
From the graph, the distance traveled is ![]() miles.
miles.
Answer:
From the graph, the distance traveled is 150 miles.
e) How long does it take Ms. Gray to travel 400 miles?
From the graph, it takes her ![]() hours to travel 400 miles.
hours to travel 400 miles.
Answer:
From the graph, it takes her 8 hours to travel 400 miles.
Math in Focus Course 2A Practice 5.2 Answer Key
Tell whether each graph represents a direct proportion. If so, find the constant of proportionality. Then write a direct proportion equation.
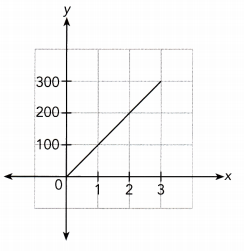
Question 1.
Answer:
The given graph is a straight line that does not lie along
the x — axis or y — axis but does not pass through the origin.
So, the given graph does not represents a direct proportion.
The graph does not represent a Direct Proportion
Question 2.
Answer:
The given graph is a straight line through the origin, and
It does not lie along the x — axis or y — axis.
So, it represents a direct proportion.
Because the graph passes through (1, 500),
The constant of proportionality is 500
The direct proportion equation is :
\(\frac{y}{x}\) = \(\frac{500}{1}\)
x ∙ \(\frac{y}{x}\) = x ∙ \(\frac{500}{1}\)
y = 500x
The graph represents a Direct Proportion
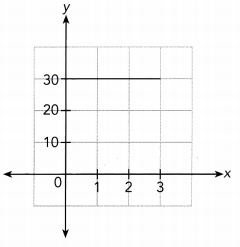
Question 3.
Answer:
In the given graph there is no straight line which show that there is no relation between x — axis and y — axis.
So, the given graph does not represents a direct proportion.
The graph does not represent a Direct Proportion
Question 4.
Answer:
The given graph is a straight line through the origin, and
It does not lie along the x — axis or y – axis.
So, It represents a direct proportion.
Because the graph passes through (1, 100),
The constant of proportionality is 100
The direct proportion equation is :
x ∙ \(\frac{y}{x}\) = x ∙ \(\frac{10}{1}\)
y = 100x
The graph represent a Direct Proportion
Solve. Show your work.
Question 5.
The cost of staying at a motel is directly proportional to the number of nights you stay. The graph shows the cost of staying at a motel, y dollars, for x nights.
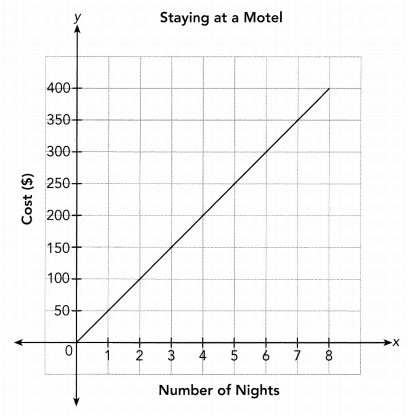
a) Find the constant of proportionality. What does this value represent in this situation?
Answer:
\(\frac{y}{x}\) = \(\frac{50}{1}\)
\(\frac{y}{x}\) = 50
The Constant of Proportionality is 50
b) How much does it cost to stay at the motel for one week?
Answer:
From the graph, staying at monotel for 7 days is $350
Question 6.
MathJournal Explain how you can tell whether a line represents a direct proportion.
Answer:
A line represent a direct proportion when it follows all the below conditions :
1. → It is a straight line.
2. → The line should pass through the origin.
3. → The line should riot lie along x — axis or y — axis.
The line should be Straight line passes through the origin.
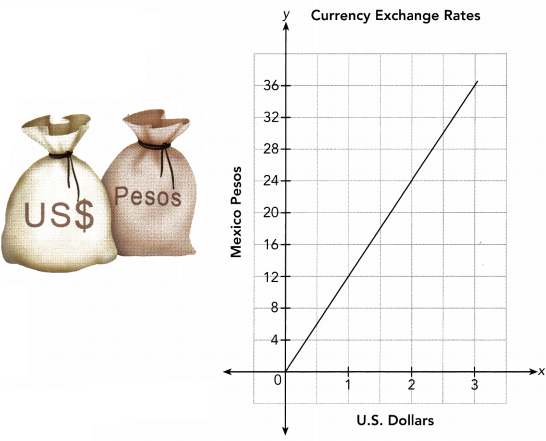
Question 7.
When you travel to another country, you can exchange U.S. dollars for the currency of that country. The amount of the new currency you get for your dollars depends on the exchange rate. The graph shows the amount of Mexican pesos, y, you could get if you were to exchange x U.S. dollars for pesos.
Answer:
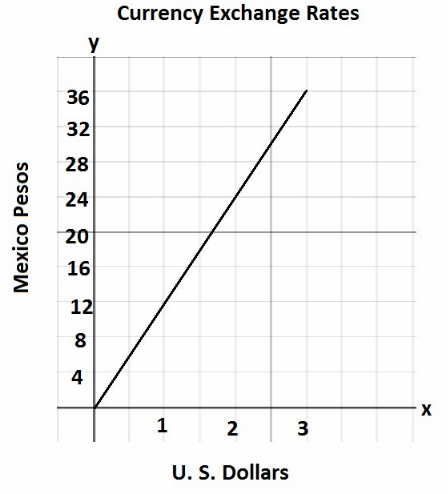
a) Is the amount of pesos directly proportional to the amount of U.S. dollars?
Answer:
\(\frac{y}{x}\) = \(\frac{12}{1}\) = 12
\(\frac{y}{x}\) = \(\frac{24}{2}\) = 12
\(\frac{y}{x}\) = \(\frac{36}{3}\) = 12
Yes the the amount of pesos is directly proportional to the anzount of U. S. Dollars
b) How many pesos do you get for 3 U.S. dollars?
Answer:
From the graph, for 3 U. S. Dollars we get 36 pesos
c) Convert 24 pesos to U.S. dollars.
Answer:
$From\ the\ graph,\ when\ y=24\ then\ x=2$
24 pesos is equal to 2 U. S. Dollar.
d) What is the exchange rate when you convert dollars to pesos?
Answer:
$From the\ graph when\ x=1\ then\ y=12$
So, exchange rate is 12 pesos for 1 U. S. Dollar.
e) Write the direct proportion equation.
Answer:
\(\frac{y}{x}\) = \(\frac{12}{1}\)
x ∙ \(\frac{y}{x}\) = x ∙ \(\frac{12}{1}\)
y = 12x
Use graph paper. Solve.
Question 8.
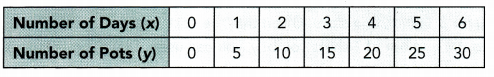
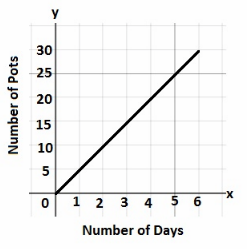
Beth works at a pottery studio. She is making ceramic pots to sell at a craft fair. Graph the relationship between the number of ceramic pots she makes, y, and the number of days she works at the studio, x. Use 1 unit on the horizontal axis to represent 1 day and 1 unit on the vertical axis to represent 5 ceramic pots.
a) Determine whether the graph represents a direct proportion. If so, find the constant of proportionality and write the direct proportion equation.
Answer:
Yes, the given graph is direct proporhon
\(\frac{y}{x}\) = \(\frac{5}{1}\) = 5
\(\frac{y}{x}\) = \(\frac{10}{2}\) = 5
\(\frac{y}{x}\) = \(\frac{15}{3}\) = 5
\(\frac{y}{x}\) = \(\frac{20}{4}\) = 5
\(\frac{y}{x}\) = \(\frac{25}{5}\) = 5
\(\frac{y}{x}\) = \(\frac{30}{6}\) = 5
Constant of Proportionality = 5
Direct Proportion Equation :
\(\frac{y}{x}\) = 5
x ∙ \(\frac{y}{x}\) = x ∙ 5
b) Explain what the point (4, 20) represents in this situation.
Answer:
(4, 20) represent that in 4 days she can make 20 pots
c) How many pots can Beth make in 3 days?
Answer:
$From\ the\ graph,\ when\ x=3\ then\ y=l5$
In 3 days Beth can make 15 pots
d) Beth will not start selling pots until she has made at least 30. How long will it take her to make that many pots?
Answer:
$From\ the\ graph,\ when\ y=30\ then\ x=6$
So, Beth can make 30 pots in 6 days.