Go through the Math in Focus Grade 4 Workbook Answer Key Chapter 4 Tables and Line Graphs to finish your assignments.
Math in Focus Grade 4 Chapter 4 Answer Key Tables and Line Graphs
Math Journal
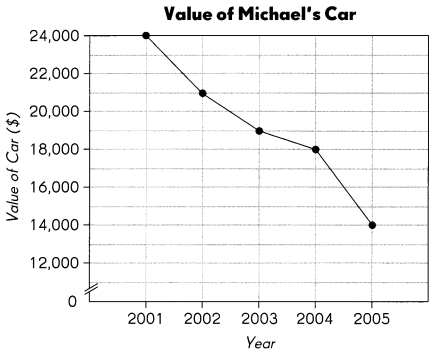
Michael bought a new car in 2001 for $24,000. The line graph shows how the value of his car changed from 2001 to 2005.

Write four questions that can be answered using the data in the line graph. Then write the answers.
a. Question
_____________
_____________
Answer
_____________
_____________
Answer:
b. Question
_____________
_____________
Answer
_____________
_____________
Answer:
c. Question
_____________
_____________
Answer
_____________
_____________
Answer:
d. Question
_____________
_____________
Answer
_____________
_____________
Answer:
Put on Your Thinking cap!
Challenging Practice
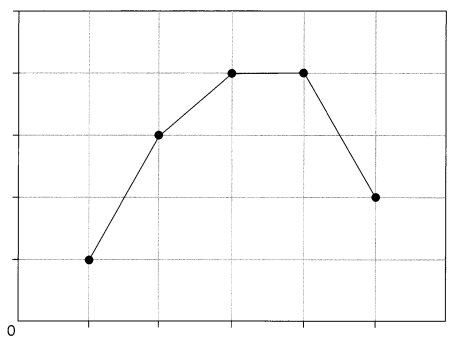
Look at the line graph.

Question 1.
Suggest what data this graph could be showing.
Answer:
Question 2.
Create a title, scale and labels for the graph. Show these on the graph.
Answer:
Question 3.
Why do you think the line is horizontal from point 3 to point 4?
Answer:
Put on Your Thinking Cap!
Problem Solving
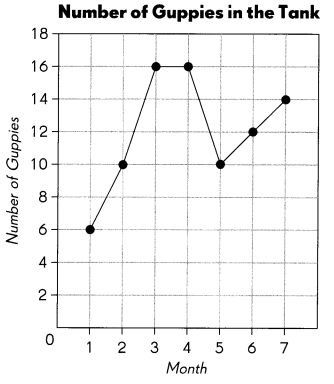
The graph shows the number of guppies in a tank over a few months.

Question 1.
During which 1 -month interval was the increase in the number of guppies the greatest?
Answer:
Question 2.
How many guppies were moved to another tank between the fourth and the fifth month ?
Answer:
Question 3.
How many guppies were added to the tank in the second month?
Answer:
Question 4.
Why is the line horizontal from the third to the fourth month?
Answer: