Go through the Math in Focus Grade 4 Workbook Answer Key Chapter 4 Practice 3 Line Graphs to finish your assignments.
Math in Focus Grade 4 Chapter 4 Practice 3 Answer Key Line Graphs
Use the data in the line graphs to answer each question.
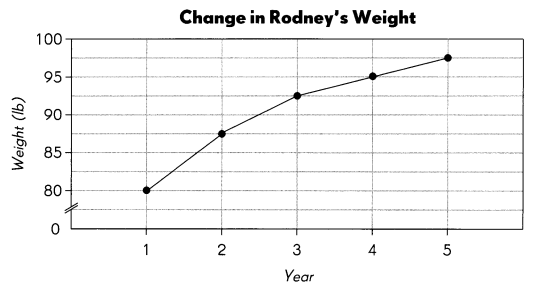
The line graph shows the change in Rodney’s weight over a few years.
Example
What was Rodney’s weight in the second year?
87.5 lb
In which year was the increase in Rodney’s weight the greatest? Between the first anti second year

Question 1.
What was Rodney’s weight in the
a. fourth year? ___
Answer:
95 lb.
Explanation:
Rodney’s weight in the fourth year is 95 lb.
b. fifth year? ___
Answer:
97.5 lb.
Explanation:
Rodney’s weight in the fifth year is 97.5 lb.
c. What was the increase in Rodney’s weight between these two years? ____
Answer:
Question 2.
In which year was the increase in Rodney’s weight 5 lb?
Answer:
3rd year.
Explanation:
In the 3rd year, the increase in Rodney’s weight was 5 lb which is from 87.5 lb to 92.5 lb.
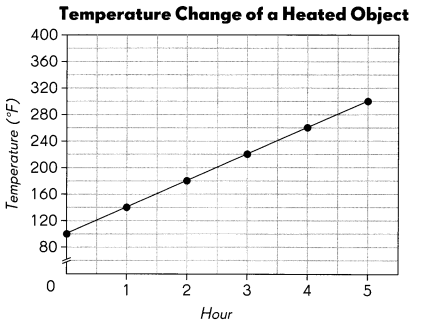
The line graph shows the temperature of an object being heated over five hours.
Question 3.
What was the temperature of the object in the second hour? ___
Answer:
180°F.
Explanation:
The temperature of the object in the second hour is 180°F.
Question 4.
What was the temperature of the object in the fourth hour? ____
Answer:
260°F.
Explanation:
The temperature of the object in the fourth hour is 260°F.
Question 5.
What was the increase in temperature between the second hour and the fourth hour? ____
Answer:
80°F.
Explanation:
The increase in temperature between the second hour and the fourth hour will be 260°F.-180°F. which is 80°F.
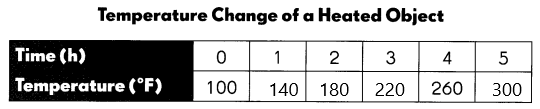
Use the data from the graph to complete the table.
Question 6.
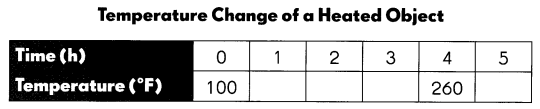
Answer:
Question 7.
Did the temperature increase by the same amount every hour?
Answer:
Yes.
Explanation:
Yes, the temperature increase by the same amount every hour.
The line graph shows the change in height while Ali was climbing a mountain.
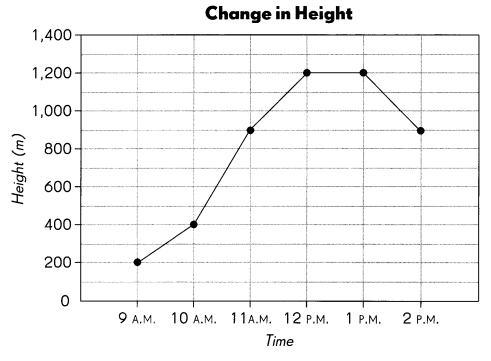
Question 8.
At what time was Ali at a height of 200 meters? ____
Answer:
9 A.M.
Explanation:
At 9 A.M. was Ali at a height of 200 meters.
Question 9.
At what height was Ali at 2 P.M.? ____
Answer:
900 meters.
Explanation:
At 2 P.M. Ali’s height is 900 meters.
Question 10.
During which hour was the increase in height the greatest? ____
Answer:
12 P.M. and 1 P.M.
Explanation:
At 12 P.M. and 1 P.M. hours the increase in height the greatest.
Question 11.
When did Ali take a break from climbing? ____
Answer:
12 P.M.
Explanation:
At 12 P.M. Ali took a break from climbing.
Question 12.
Explain what happened from 1 P.M. to 2 P.M.
Answer:
Height was decreasing.
Explanation:
From 1 P.M. to 2 P.M. the height was decreasing from 1,200 meters to 900 meters.
Choose an appropriate graph to display the data. Write bar graph, line graph, or picture graph. Explain your choice.
Question 13.
Anna recorded the rainfall amounts (in centimeters) in each month from January to June.
Answer:
Question 14.
Jim organized a party for 20 of his friends. He recorded the number of friends who liked each flavor of ice-cream — vanilla, strawberry, and chocolate. 4 friends liked vanilla ice-cream, 8 friends liked strawberry ice-cream, and 8 friends liked chocolate ice-cream.
Answer:
Question 15.
Temperature change of water (in °F) when it is heated over 20 minutes.
Answer:
Question 16.
Level of water remaining in a leaking tank recorded over four hours.
Answer: