Go through the Math in Focus Grade 8 Workbook Answer Key Chapter 4 Lesson 4.1 Finding and Interpreting Slopes of Lines to finish your assignments.
Math in Focus Grade 8 Course 3 A Chapter 4 Lesson 4.1 Answer Key Finding and Interpreting Slopes of Lines
Hands-On Activity
Materials:
graph paper
USE TRIANGLES TO FIND THE SLOPE OF A LINE
Work in pairs.
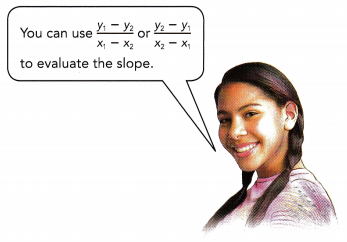
You can find the slope of any nonvertical line, not just. a line that represents a direct proportion, by finding the ratio of the rise to the run.
STEP 1: Graph the line below on graph paper. The line should pass through the points (0, 1) and (6, 4). Then draw and label three right triangles on the line as shown. The triangles should be the same shape but different sizes. Make sure that each right angle lies on the intersection of two grid lines.
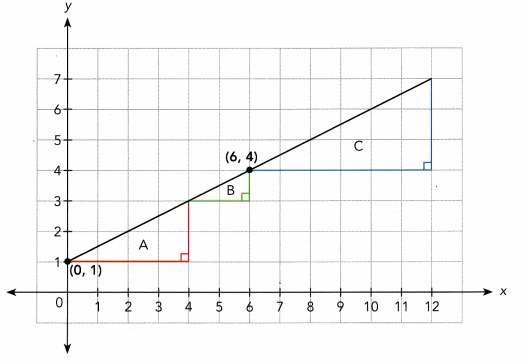
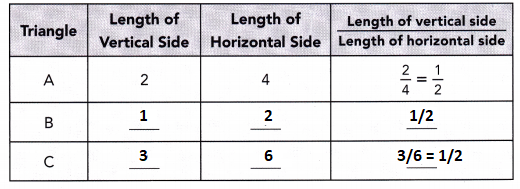
STEP 2: Copy and complete the table.
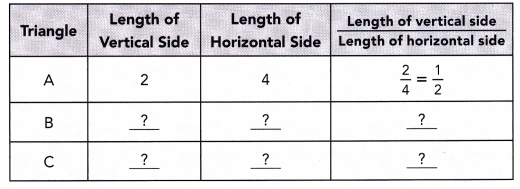
STEP 3: What do you observe about the ratios in the last column of the table?
Math Journal As you have learned, the slope of a line is the ratio of the rise to the run. Which side of each triangle has a length equal to the rise? Which has a length equal to the run? For each line you drew, what did you notice about the three ratios you calculated?
Answer:
Hands-On Activity
Materials
graph paper
USE POINTS TO FIND THE SLOPE OF A LINE
STEP 1: Graph the line that passes through each pair of points, using 1 grid square to represent 1 unit on both axes for the interval from 0 to 7.
a) Line 1: (0, 1) and (4, 2)
b) Line 2: (0, 1) and (4, 5)
c) Line 3: (0, 1) and (4, 7)
STEP 2: For each line you drew, draw a right triangle. The segment connecting the two points should be the longest side. Find the length of the vertical side, the length of horizontal side, and the ratio \(\frac{\text { Length of vertical side }}{\text { Length of horizontal side }}\).
Math Journal Of the three lines drawn in STEP 1, which line has the greatest slope? Which line has the least slope? How can you tell by looking at the lines? How can you tell from the ratios you calculated?
Math in Focus Grade 8 Chapter 4 Lesson 4.1 Guided Practice Answer Key
Complete.
Question 1.
The graphs give information about the distance, d miles, traveled over time, t hours, by cars and trucks on a California highway. Which speed is slower?
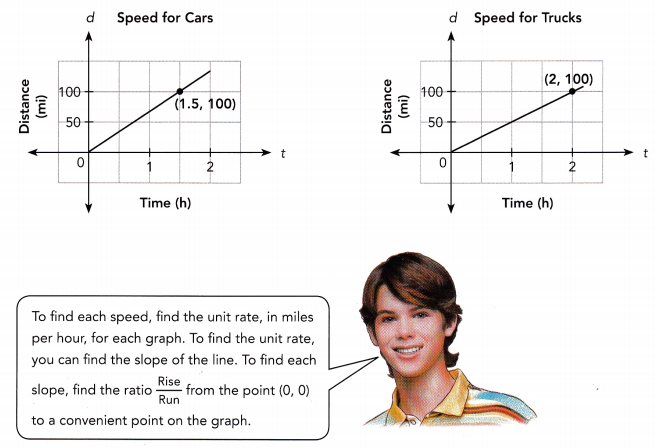
Speed for cars:
Unit rate = \(\frac{\text { Rise }}{\text { Run }}\)
= \(\frac{?}{?}\)
= ![]() mi/h
mi/h
Speed for trucks:
Unit rate = \(\frac{\text { Rise }}{\text { Run }}\)
= \(\frac{?}{?}\)
= ![]() mi/h
mi/h
The slope for the car speed graph is ![]() , so the unit rate is
, so the unit rate is ![]() miles per hour.
miles per hour.
The slope for the truck speed graph is ![]() , so the unit rate is
, so the unit rate is ![]() miles per hour.
miles per hour.
The speed for ![]() is slower than the speed for
is slower than the speed for ![]() .
.
Answer:
Speed for cars:
= \(\frac{100}{1.5}\)
= 66.6 mi/h
Speed for trucks:
= \(\frac{100}{2}\)
= 50 mi/h
The slope for the car speed graph is 66.6, so the unit rate is 67 miles per hour.
The slope for the truck speed graph is 50, so the unit rate is 50 miles per hour.
The speed for trucks is slower than the speed for car.
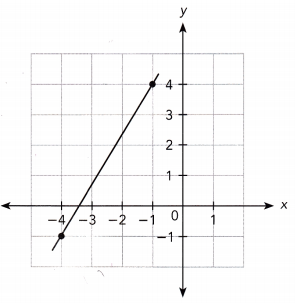
Question 2.
The graph passes through the points (![]() ,
, ![]() ) and (
) and (![]() ,
, ![]() )
)
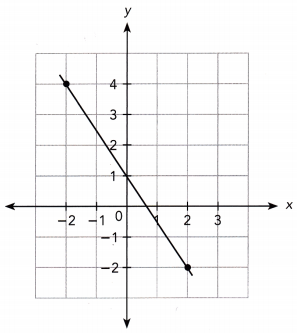
Slope = \(\frac{\text { Rise }}{\text { Run }}\)
= \(\frac{?}{?}\)
= \(\frac{?}{?}\)
= \(\frac{?}{?}\)
The slope is ![]() .
.
Answer:
The graph passes through the points (-2, 4) and (2, -2)
Slope = \(\frac{\text { Rise }}{\text { Run }}\)
m = \(\frac{4+2}{-2-2}\)
= \(\frac{6}{-4}\)
= \(\frac{-3}{2}\)
The slope is \(\frac{-3}{2}\)
Question 3.
The graph passes through the points (![]() ,
, ![]() ) and (
) and (![]() ,
, ![]() )
)
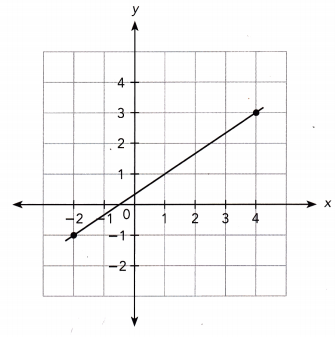
Slope = \(\frac{\text { Rise }}{\text { Run }}\)
= \(\frac{?}{?}\)
= \(\frac{?}{?}\)
= \(\frac{?}{?}\)
The slope is ![]() .
.
Answer:
The graph passes through the points (4, 3) and (-2, -1)
Slope = \(\frac{\text { Rise }}{\text { Run }}\)
= \(\frac{-1-3}{-2-4}\)
= \(\frac{-4}{-6}\)
= \(\frac{2}{3}\)
The slope is 2/3.
Solve. Show your work.
Question 4.
The graphs represent the amount of water, w gallons, in Pool A over time, t hours, and the amount of water, w gallons, left in Pool B over time, t hours.
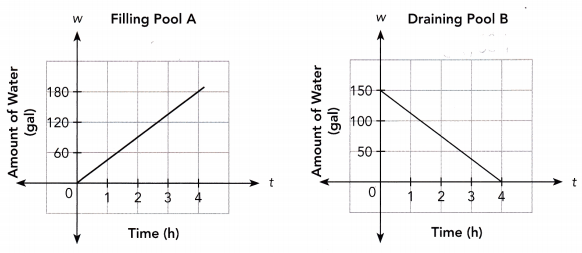
a) Find the slope of the line graph for Pool A. What does it represent?
Answer:
slope = 180/4
slope = 45
b) Find the slope of the line graph for Pool B. What does it represent?
Answer:
Slope = \(\frac{\text { Rise }}{\text { Run }}\)
= \(\frac{150}{4-0}\)
= 37.5
Complete.
Question 5.
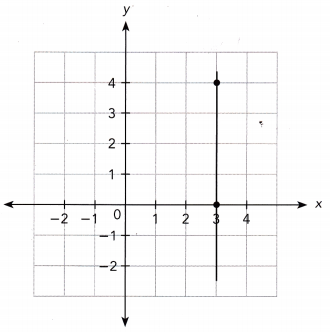
Use the points (![]() ,
, ![]() ) and (
) and (![]() ,
, ![]() ):
):
Slope = \(\frac{\text { Rise }}{\text { Run }}\)
= \(\frac{?}{?}\)
= \(\frac{?}{?}\)
= ![]()
The slope is ![]() .
.
Answer:
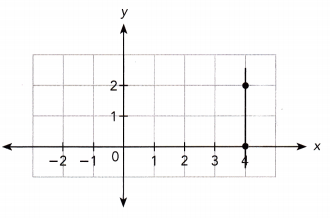
Use the points (3, 4) and (3, 0):
Slope = \(\frac{\text { Rise }}{\text { Run }}\)
= \(\frac{0-4}{0}\)
= undefined
The slope is undefined.
Find the slope of the line passing through each pair of points.
Question 6.
M(-2, 0) and N(0, 4)
Let M (-2, 0) be (x1, y1) and N (0, 4) be (x2, y2).
Method 1
Slope = \(\frac{y_{1}-y_{2}}{x_{1}-x_{2}}\)
= \(\frac{?}{?}\)
= \(\frac{?}{?}\)
= ![]()
Method 2
Slope = \(\frac{y_{2}-y_{1}}{x_{2}-x_{1}}\)
= \(\frac{?}{?}\)
= \(\frac{?}{?}\)
= ![]()
The slope is ![]() .
.
Answer:
Method 1
Slope = \(\frac{0-4}{-2-0}\)
= \(\frac{-4}{-2}\)
= 2
Slope = 2
Method 2
Slope = \(\frac{y_{2}-y_{1}}{x_{2}-x_{1}}\)
= \(\frac{4-0}{0+2}\)
= \(\frac{4}{2}\)
= 2
The slope is 2.
Question 7.
S(-5, 8) and T(-2, 2)
Let S (-5, 8) be (x1, y1) and T(-2, 2) be (x2, y2).
Method 1
Slope = \(\frac{y_{1}-y_{2}}{x_{1}-x_{2}}\)
= \(\frac{?}{?}\)
= \(\frac{?}{?}\)
= ![]()
Method 2
Slope = \(\frac{y_{2}-y_{1}}{x_{2}-x_{1}}\)
= \(\frac{?}{?}\)
= \(\frac{?}{?}\)
= ![]()
The slope is ![]() .
.
Answer:
Let S (-5, 8) be (x1, y1) and T(-2, 2) be (x2, y2).
Method 1
Slope = \(\frac{y_{1}-y_{2}}{x_{1}-x_{2}}\)
= \(\frac{8-2}{-5+2}\)
= \(\frac{6}{-3}\)
= -2
Method 2
Slope = \(\frac{y_{2}-y_{1}}{x_{2}-x_{1}}\)
= \(\frac{2-8}{-2+5}\)
= \(\frac{-6}{3}\)
= -2
The slope is -2.
Math in Focus Course 3A Practice 4.1 Answer Key
Find the slope of each line using the points indicated.
Question 1.
Answer:
Let the points be (-1,4) and (-4, -1)
Slope = \(\frac{y_{2}-y_{1}}{x_{2}-x_{1}}\)
= \(\frac{-1-4}{-4+1}\)
= \(\frac{-5}{-3}\)
= \(\frac{5}{3}\)
The slope is \(\frac{5}{3}\).
Question 2.
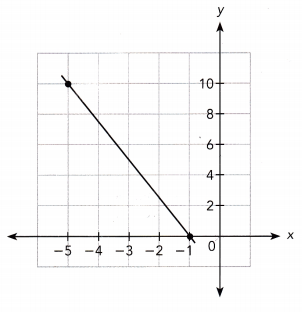
Answer:
Let the points be (-5,10) and (-1, 0)
Slope = \(\frac{y_{2}-y_{1}}{x_{2}-x_{1}}\)
= \(\frac{0-10}{-1+5}\)
= \(\frac{-10}{4}\)
= \(\frac{-5}{2}\)
The slope is \(\frac{-5}{2}\).
Question 3.
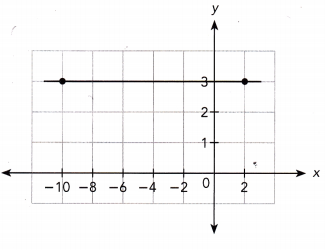
Answer:
Let the points be (-10,3) and (2, 3)
Slope = \(\frac{y_{2}-y_{1}}{x_{2}-x_{1}}\)
= \(\frac{3-3}{2-10}\)
= 0
The slope is 0.
Question 4.
Answer:
Let the points be (4,2) and (4, 0)
Slope = \(\frac{y_{2}-y_{1}}{x_{2}-x_{1}}\)
= \(\frac{0-2}{4-4}\)
= undefined
The slope is undefined.
Question 5.
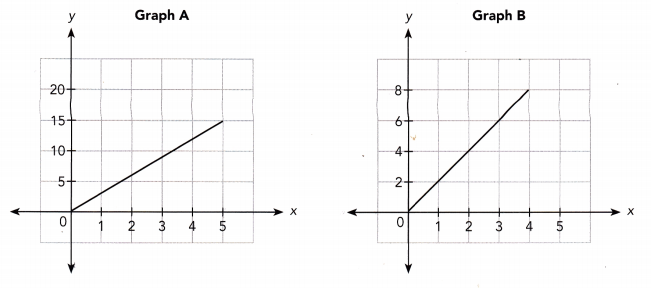
Math Journal Jason says that the line in Graph B has a greater slope than the line in Graph A because it is steeper. What error is Jason making? Justify your answer.
Answer:
Jason compared the two lines visually. Because the two graphs have different scales for the vertical aces, the slopes cannot be accurately compared by their steepness.
Question 6.
Math Journal Andy graphs a vertical line through the points (5, 2) and (5, 5). He says the slope of the line is \(\frac{3}{0}\). What error is he making?
Answer:
Let the points be (5, 2) and (5, 5)
Slope = \(\frac{y_{2}-y_{1}}{x_{2}-x_{1}}\)
= \(\frac{5-2}{5-5}\)
= undefined
The slope is undefined.
Find the slope of the line passing through each pair of points.
Question 7.
A (-10, 3), B (0, 3)
Answer:
Let the points be A (-10, 3), B (0, 3)
Slope = \(\frac{y_{2}-y_{1}}{x_{2}-x_{1}}\)
= \(\frac{3-3}{0+10}\)
= 0
The slope is 0.
Question 8.
S(5, -2), T(2, -5)
Answer:
Let the points be S(5, -2), T(2, -5)
Slope = \(\frac{y_{2}-y_{1}}{x_{2}-x_{1}}\)
= \(\frac{-5+2}{2-5}\)
= \(\frac{-3}{-3}\)
= 1
The slope is 1.
Question 9.
P(0, -7), Q(-3, 5)
Answer:
Let the points be P(0, -7), Q(-3, 5)
Slope = \(\frac{y_{2}-y_{1}}{x_{2}-x_{1}}\)
= \(\frac{5+7}{-3-0}\)
= \(\frac{12}{-3}\)
= -4
The slope is -4.
Question 10.
X(4, 4), V(4, -2)
Answer:
Let the points be X(4, 4), V(4, -2)
Slope = \(\frac{y_{2}-y_{1}}{x_{2}-x_{1}}\)
= \(\frac{-2-4}{4-4}\)
= undefined
The slope is undefined.
Question 11.
Math Journal Two points have the same x-coordinates but different y-coordinates. Make a prediction about the slope of a line drawn through the points. Justify your prediction.
Answer:
Two points have the same x-coordinates but different y-coordinates. A vertical line graph is drawn. Because slope = rise/run and the run is 0, the slope is undefined. Any number divided by zero is undefined.
Question 12.
MathJournal Two points have the same y-coordinates but different x-coordinates. Make a prediction about the slope of a line drawn through the points. Justify your prediction.
Answer:
It is a line parallel to the x-axis. No matter what the value of x is, y stays the same.
Solve. Show your work.
Question 13.
In the Fahrenheit system, water freezes at 32°F and boils at 212°F. In the Celsius system, water freezes at 0°C and boils at 100°C.
a) Translate the verbal description into a pair of points in the form (temperature in °C, temperature in °F).
Answer: (0, 32); (100, 212)
b) Find the slope of the line passing through the pair of points in a).
Answer: 9/5
c) Suppose the temperature in a room goes up by 5°C. By how much does the temperature go up in degrees Fahrenheit? Explain.
Answer: By 9° F; The slope of the line is 9/5,
so a horizontal change of 5 corresponds to a vertical change of 9.
Question 14.
The table shows how much a certain amount of gasoline costs at two gasoline stations on a particular day.
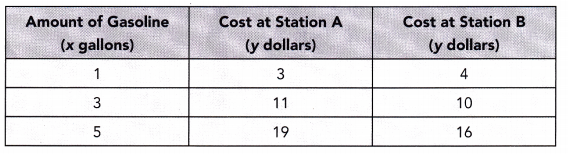
a) At which station is each additional gallon of gasoline more expensive? Explain.
Answer:
The cost at station A is more expensive.
(1, 3) a) We consider the points:
(3, 11)
SlopeB = \(\frac{11-3}{3-1}\) The cost of an additional gallon is the slope of the line representing the cost
= \(\frac{8}{2}\)
= 4
We determine the slope of the tine representing the cost at Station A:
= 4
(1,4) We consider the points:
(3, 10)
slopeB = \(\frac{10-4}{3-1}\)
= \(\frac{6}{2}\)
= 3
As SlopeA > SlopeB, each additional gallon is more expensive at Station A.
b) Graph the relationship between cost and gallons of gasoline purchased for each station. Use 1 unit on the horizontal axis to represent 1 gallon for the x interval from 0 to 5, and 1 unit on the vertical axis to represent $2 for the y interval from 0 to 20.
Answer:
b) We graph the cost of gasoline at Station A and Station B:
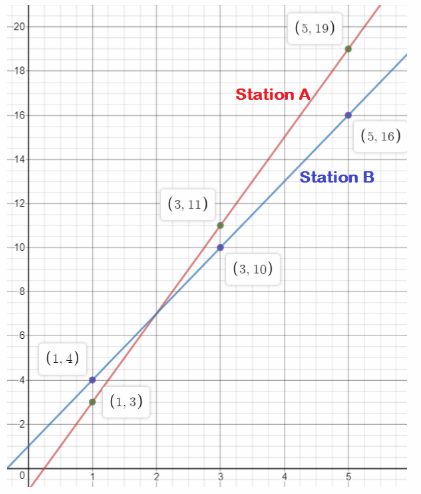
c) Which graph is steeper?
Answer:
We notice that Graph A is steeper than Graph B.
a) Station A
b) See graphs
C) Graph A