Practice the problems of Math in Focus Grade 6 Workbook Answer Key Chapter 9 Lesson 9.3 Real-World Problems: Graphing to score better marks in the exam.
Math in Focus Grade 6 Course 1 B Chapter 9 Lesson 9.3 Answer Key Real-World Problems: Graphing
Math in Focus Grade 6 Chapter 9 Lesson 9.3 Guided Practice Answer Key
Graph an equation on a coordinate plane.
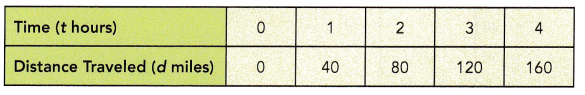
Angela is driving to the Raccoon River. The distance traveled, d miles, after t hours, is given by d = 40t. Graph the relationship between d and t. Use 2 units on the horizontal axis to represent 1 hour and 2 units on the vertical axis to represent 20 miles.
a) What type of graph is it?
It is a straight line graph.This is also called a linear graph.
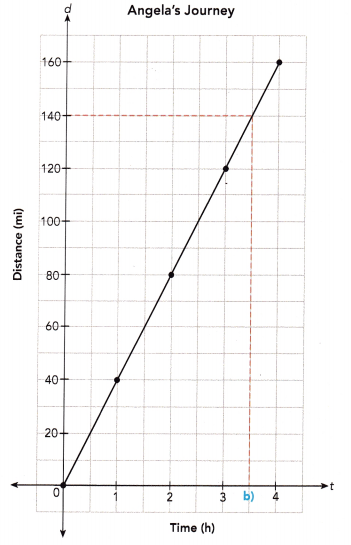
b) How far did Angela drive in 3.5 hours?
From the graph, Angela drove 140 miles.
c) What is the speed at which Angela is driving?
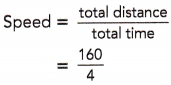
= 40 mi/h
Angela is driving at 40 miles per hour.
d) Angela has driven for 4 hours. If she drives for another hour at this • constant speed, how far will she drive in all?
Distance = speed × time
= 40 × 5
= 200 mi
She will drive 200 miles.
e) If Angela wants to drive at least 120 miles, how many hours will she need to drive? Express your answer in the form of an inequality in terms of t, where t stands for the number of hours.
t ≥ 3
f) Name the dependent and independent variables.
d is the dependent variable, and t is the independent variable.
Use graph paper. Solve.
Question 1.
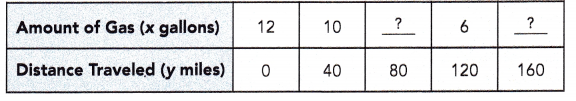
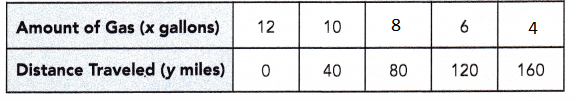
A car uses 1 gallon of gas for every 20 miles traveled. The amount of gas left in the gas tank, x gallons, after traveling y miles is given by y = 240 – 20x. Copy and complete the table. Graph the relationship between x and y.
Use 1 unit on the horizontal axis to represent 1 gallon and 1 unit on the vertical axis to represent 20 miles.
a)
Answer:
Given that, A car uses 1 gallon of gas for every 20 miles traveled. The amount of gas left in the gas tank, x gallons, after traveling y miles is given by y = 240 – 20x.
If y equals to 80 miles then x will be equal to
y = 240 – 20x
80 = 240-20x
80+20x = 240-20x+20x
80+20x = 240
80+20x-80 = 240-80
20x = 160
20x÷20 = 160÷20
x = 8
If y equals to 160 miles then x will be equal to
y = 240 – 20x
160 = 240-20x
160+20x = 240-20x+20x
160+20x = 240
160+20x-160 = 240-160
20x = 80
20x÷20 = 80÷20
x = 4
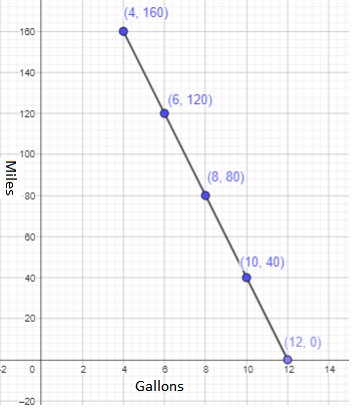
b) What type of graph is it? It is a ![]() graph.
graph.
Answer:
It is a straight line graph.This is also called a linear graph.
c) How many gallons of gas will be left in the tank after the car has traveled 60 miles?
From the graph, there will be ![]() gallons of gas left,
gallons of gas left,
Answer:
From the graph, there will be 8 gallons of gas left in the tank after the car has traveled 60 miles.
d) How many gallons of gas will be left in the tank after the car has traveled 100 miles?
From the graph, there will be ![]() gallons of gas left.
gallons of gas left.
Answer:
From the graph, there will be 4 gallons of gas left in the tank after the car has traveled 100 miles.
e) After the car has traveled 160 miles, how much farther can the car travel before it runs out of gas?
After 160 miles, ![]() gallons of gas were left.
gallons of gas were left.
The car uses 1 gallon for every ![]() miles traveled.
miles traveled.
Distance = number of gallons × mileage
= ![]() ×
× ![]()
= ![]() mi
mi
The car can travel another ![]() miles.
miles.
Answer:
After 160 miles, 4 gallons of gas were left.
The car uses 1 gallon for every 20 miles traveled.
Distance = 4 × mileage
160 = 4×mileage
160÷4 = (4×mileage)÷4
40 = mileage
The car can travel another 40 miles.
f) If the car travels more than 40 miles, how much gas is left in the tank?
Express your answer in the form of an inequality in terms of x, where x stands for the amount of gas left in the gas tank.
If the distance traveled is more than 40 miles, then ![]() .
.
Answer:
If the car travels more than 40 miles, then x ≥10, where x stands for the amount of gas left in the gas tank.
g) Name the dependent and independent variables.
Answer:
From the above analysis, we can observe that,
x is independent and y is dependent
Question 2.
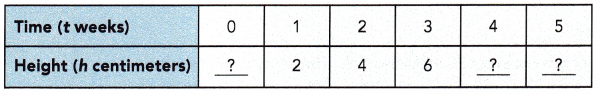
Sarah plants a seed. After t weeks, the height of the plant, h centimeters, is given by h = 2t. Copy and complete the table. Graph the relationship between t and h. Use 1 unit on the horizontal axis to represent 1 week and 1 unit on the vertical axis to represent 2 centimeters.
a)
Answer:
Given that Sarah plants a seed. After t weeks, the height of the plant, h centimeters, is given by h = 2t
To calculate the height, we can use this relation, h = 2t
If t=0, h = 2t = 2×0 = 0 cm
If t=4, h = 2t = 2×4 = 8 cm
If t=5, h = 2t = 2×5 = 10 cm

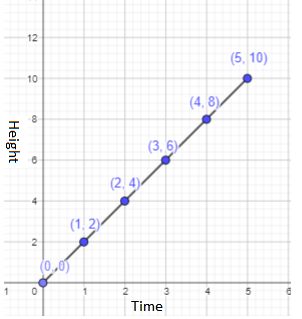
b) What type of graph is it?
Answer:
By joining all the points it forms a straight line graph.
This is also called a linear graph.
c) What is the height of the plant after 3 weeks?
Answer:
From the graph, we can observe that the height of the plant will be 6 cm after 3 weeks.
d) What is the height of the plant after 5 weeks?
Answer:
From the graph, we can observe that the height of the plant will be 10 cm after 5 weeks.
e) What is the height of the plant if less than 4 weeks have passed? Express your answer in the form of an inequality in terms of h, where h stands for the height of the plant in centimeters.
Answer:
The height of the plant if less than 4 weeks have passed will be 8cm.
Therefore, the height in the form of an inequality in terms of h will be h ≥ 8, where h stands for the height of the plant in cm.
f) Name the dependent and independent variables.
Answer:
From the above observation, we can say the dependent variable is h
and the independent variable is t.
Math in Focus Course 1B Practice 9.3 Answer Key
Use graph paper. Solve.
Question 1.
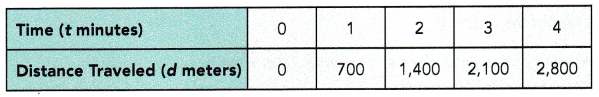
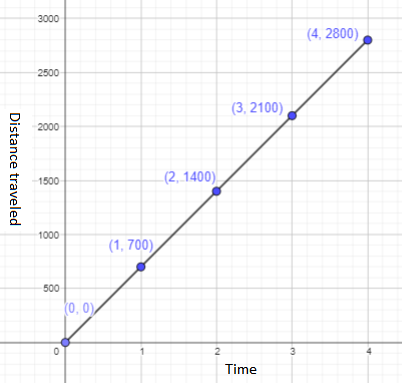
A cyclist took part in a competition. The distance traveled, d meters, after t minutes, is given by d = 700t. Graph the relationship between t and d. Use 2 units on the horizontal axis to represent 1 minute and 1 unit on the vertical axis to represent 350 meters.
a) What type of graph is it?
Answer:
By joining all the points it forms a straight line graph.
This is also called a linear graph.
b) What is the distance traveled in 2.5 minutes?
Answer:
Given that the distance traveled, d meters, after t minutes, is given by d = 700t.
d = 700×2.5
= 1750 m
Thus, 1750 m is the distance traveled in 2.5 min.
c) What is the distance traveled in 3.5 minutes?
Answer:
Given that the distance traveled, d meters, after t minutes, is given by d = 700t.
d = 700×3.5
= 2450 m
Thus, 2450 m is the distance traveled in 3.5 min.
d) What is the average speed of the cyclist?
Answer:
The average speed of the cyclist can be calculated by using the below formula,
Average speed = \(\frac{total distance}{total elapsed time}\)
Total distance = 0+700+1400+2100+2800 = 7000 m
Total time = 0+1+2+3+4 = 10 min
= \(\frac{7000}{10}\)
= 700
The average speed of the cyclist is 700 metre per min.
e) Assuming that the cyclist travels at a constant speed throughout the competition, what distance will he travel in 7 minutes?
Answer:
Let us assume that the cyclist travels at a constant speed of 700m in a min.
So, the distance he travel in 7 mins will be 7×700=4900 m.
f) If the cyclist needs to cycle for at least 2.1 kilometers, how many minutes will he need to cycle? Express your answer in the form of an inequality in terms of t, where t stands for the number of minutes.
Answer:
The cyclist needs to cycle for at least 2.1 kilometers.
1 kilometer equals to 1000 m.
2.1 km will be equal to 2.1×1000 = 2100 m
Given that the distance traveled, d meters, after t minutes, is given by d = 700t.
2100 = 700t
2100÷700 =(700×t)÷700
300 = t
The number of minutes the cyclist will need to cycle 2.1 km will be 300 min.
g) Name the dependent and independent variables.
Answer:
From the above observation, we can say the dependent variable is d
and the independent variable is t.
Question 2.
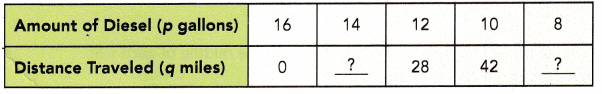
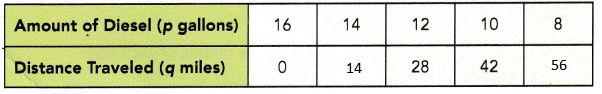
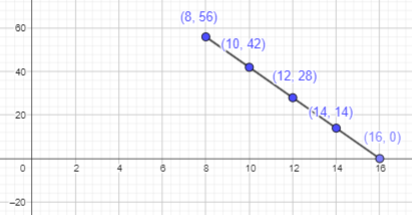
A bus uses 1 gallon of diesel for every 7 miles traveled. The amount of diesel left in the gas tank, p gallons, after traveling q miles, is given by q = 112 – 7p. Copy and complete the table. Graph the relationship between p and q. Use 1 unit on the horizontal axis to represent 1 gallon and 1 unit on the vertical axis to represent 7 miles.
a)
Answer:
Given that a bus uses 1 gallon of diesel for every 7 miles traveled. The amount of diesel left in the gas tank, p gallons, after traveling q miles, is given by q = 112 – 7p.
If p is 14, then q will be 112 – 7×14 = 112-98 = 14
If p is 8, then q will be 112 – 7×8 = 112-56 = 56
b) How many gallons of diesel were left after the bus has traveled 49 miles?
Answer:
The amount of diesel left in the gas tank, p gallons, after traveling q miles, is given by q = 112 – 7p.
Here q is 49 miles.
49 = 112 – 7p
49 +7p = 112 – 7p +7p
49 +7p = 112
49 +7p – 49 = 112 – 49
7p = 63
7p÷7 = 63÷7
p=9
9 gallons of diesel were left after the bus has traveled 49 miles
c) After the bus has traveled for 56 miles, how much farther can the bus travel before it runs out of diesel?
Answer:
For 56 miles, 8 gallons of diesel will be used
Here p is 8
8 = 112 – 7p
8+7p = 112 – 7p + 7p
8+7p = 112
8+7p-8 = 112-8
7p = 104
7p÷7 = 104÷7
p = 14.8
After the bus has traveled for 56 miles, it will travel 0.8 m before it runs out of diesel.
d) If the bus travels more than 28 miles, how much diesel is left? Express your answer in the form of an inequality in terms of p, where p stands for the amount of diesel left.
Answer:
If the bus travels more than 28 miles, 12 gallons will be utilised.
It can be expressed as p ≥ 12, where p stands for the amount of diesel left.
Question 3.
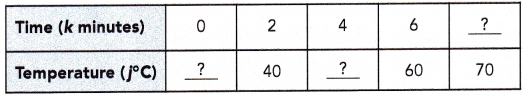
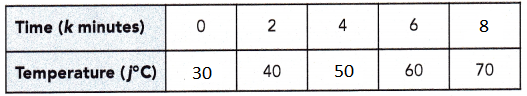
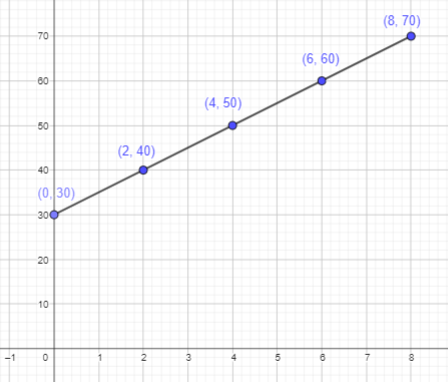
A kettle of water is heated and the temperature of the water, j°C, after k minutes, is given by j = 5k + 30. Copy and complete the table. Graph the relationship between k and j. Use 1 unit on the horizontal axis to represent 1 minute and 1 unit on the vertical axis to represent 5°C.
a)
Answer:
Given that a kettle of water is heated and the temperature of the water, j°C, after k minutes, is given by j = 5k + 30.
If k = 0 then j will be
j = 5k + 30
j = 5×0 + 30
j = 30
If k = 4 then j will be
j = 5k + 30
j = 5×4 + 30
j = 20+30
j = 50
If j=70
70 = 5k + 30
70-30 = 5k+30-30
40 = 5k
40÷5 = 5k÷5
8 = k
b) What is the temperature of the water after 5 minutes?
Answer:
Given that a kettle of water is heated and the temperature of the water, j°C, after k minutes, is given by j = 5k + 30.
If k = 5 then j will be
j = 5k + 30
j = 5×5 + 30
j = 25+30
j = 55°C
c) What is the average rate of the heating?
Answer:
The average rate of the heating can be calculated by using the below formula,
Average rate = \(\frac{total temp}{total elapsed time}\)
Total temp = 30+40+50+60+70 = 250
Total time = 0+2+4+6+8 = 20 min
= \(\frac{250}{20}\)
= 12.5 rate of heat per min
d) Assuming the temperature of the water rises at a constant rate, what is the temperature of the water after 10 minutes?
Answer:
Given that a kettle of water is heated and the temperature of the water, j°C, after k minutes, is given by j = 5k + 30.
Here, k=10 min
j = 5k + 30
= 5×10 + 30
= 50+30
= 80°C
80°C is the temperature of the water after 10 minutes.
e) The kettle of water needs to be heated till the water boils. For how many minutes does the kettle need to be heated? Express your answer in terms of k, where k stands for the number of minutes. (Hint: Water boils at 100°C.)
Answer:
Given that the kettle of water needs to be heated till the water boils and it will boils at 100°C
j = 5k + 30
100 = 5k + 30
100-30 = 5k + 30 – 30
70 = 5k
70÷5 = 5k÷5
k = 14 min
The kettle needs to be heated for 14 mins.
Brain @ Work
Use graph paper. For each exercise, plot the points on a coordinate plane.
Question 1.
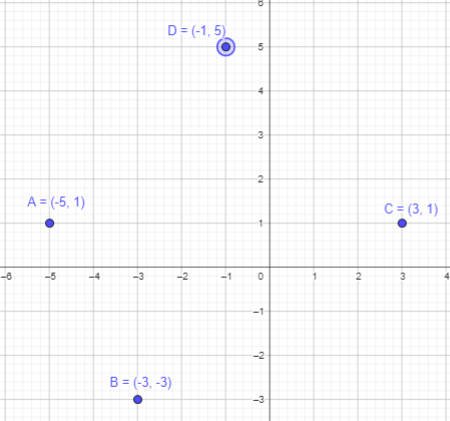
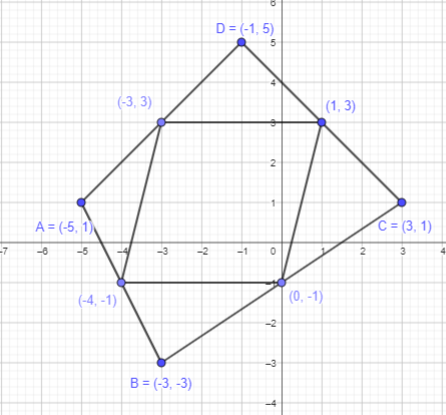
A (-5, 1), B (-3, -3), C (3, 1), and D (-1, 5)
Answer:
Point A (-5, 1):
As the x coordinate is negative, start from origin and move 5 points towards negative x axis.
As the y-coordinate is positive, start from origin and move 1 point towards positive y axis.
Thus, the required point A is plotted.
Point B (-3, -3):
As the x coordinate is negative, start from origin and move 3 points towards negative x axis.
As the y-coordinate is negative, start from origin and move 3 point towards negative y axis.
Thus, the required point B is plotted.
Point C (3,1):
As the x coordinate is positive, start from origin and move 3 points towards positive x axis.
As the y-coordinate is positive, start from origin and move 1 point towards positive y axis.
Thus, the required point C is plotted.
Point D(-1, 5):
As the x coordinate is negative, start from origin and move 1 points towards negative x axis.
As the y-coordinate is positive, start from origin and move 5 point towards positive y axis.
Thus, the required point D is plotted.
Question 2.
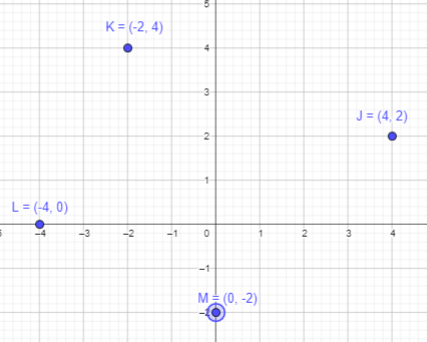
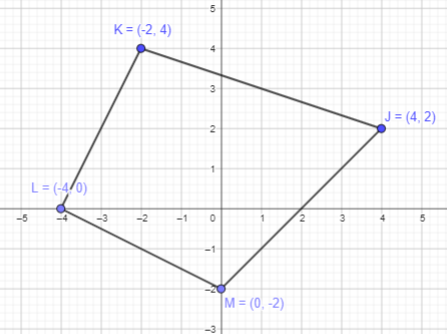
J (4, 2), K (-2, 4), L (-4, 0), and M (0, -2)
Answer:
Point J (4, 2):
As the x coordinate is positive, start from origin and move 4 points towards negative x axis.
As the y-coordinate is positive, start from origin and move 2 point towards positive y axis.
Thus, the required point J is plotted.
Point K (-2, 4):
As the x coordinate is negative, start from origin and move 2 points towards negative x axis.
As the y-coordinate is positive, start from origin and move 4 point towards positive y axis.
Thus, the required point K is plotted.
Point L (-4, 0):
As the x coordinate is negative, start from origin and move 4 points towards negative x axis.
As the y-coordinate is zero, mark at origin.
Thus, the required point L is plotted.
Point M (0, -2):
As the x coordinate is zero, mark at origin.
As the y-coordinate is negative, start from origin and move 2 point towards negative y axis.
Thus, the required point M is plotted.
Question 3.
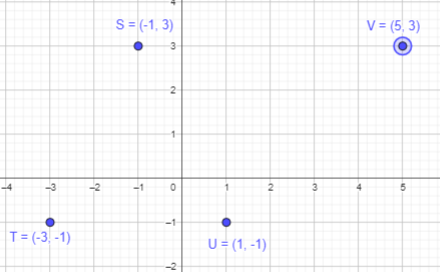
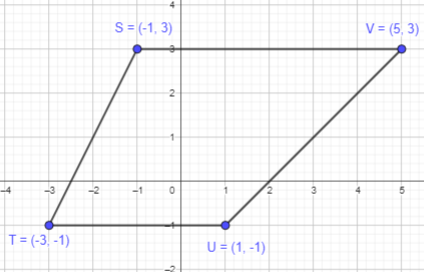
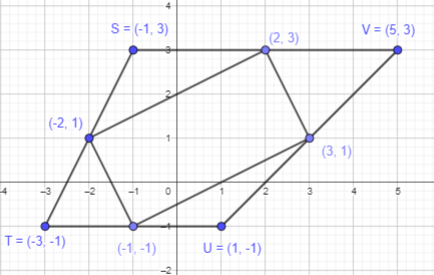
S (-1, 3), T (-3, -1), U (1, -1), and V(5, 3)
Answer:
Point S (-1, 3):
As the x coordinate is negative, start from origin and move 1 points towards negative x axis.
As the y-coordinate is positive, start from origin and move 3 point towards positive y axis.
Thus, the required point A is plotted.
Point T (-3, -1):
As the x coordinate is negative, start from origin and move 3 points towards negative x axis.
As the y-coordinate is negative, start from origin and move 1 point towards negative y axis.
Thus, the required point B is plotted.
Point U (1,-1):
As the x coordinate is positive, start from origin and move 1 points towards positive x axis.
As the y-coordinate is negative, start from origin and move 1 point towards negative y axis.
Thus, the required point C is plotted.
Point V(5, 3):
As the x coordinate is positive , start from origin and move 5 points towards positive x axis.
As the y-coordinate is positive, start from origin and move 3 point towards positive y axis.
Thus, the required point D is plotted.
Question 4.
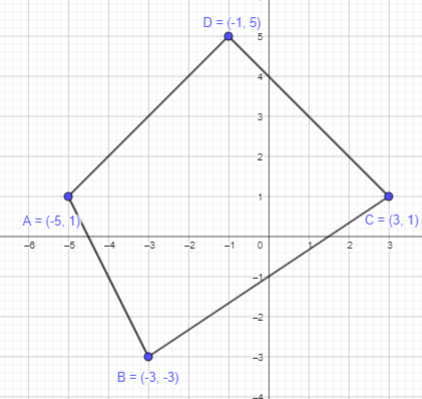
In questions 1 to 3, what is the figure formed?
Answer:
Join the plotted points A,B,C and D.
It will form a four sided figure or a quadrilateral.
Join the plotted points K,L,M and N.
It will form a four sided figure or a quadrilateral.
Join the plotted points S,T,U and V.
It will form a four sided figure or a quadrilateral.
Question 5.
a) For each figure in questions to mark the middle of each side and connect the points in order.
Answer:
Mark the mid-points of AB, BC, CD and DA line segment.
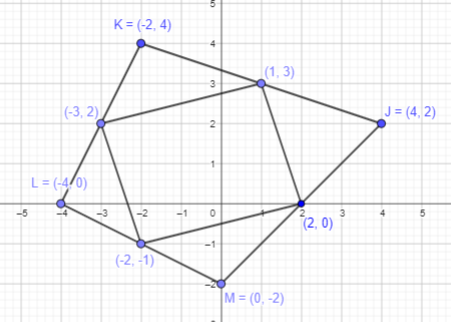
Mark the mid-points of JK, KL, LM and MJ line segment.
Mark the mid-points of SV, VU, UT and TS line segment.
b) What are the figures formed? Explain your answers.
Answer:
By joining the midpoints on ABCD:
Join the points to form a quadrilateral.
A parallelogram is formed as the opposite sides are parallel to each other.
By joining the midpoints of JLKM:
Join the points to form a quadrilateral.
A rectangle is formed as the opposite sides are equal to each other.
By joining the midpoints of STUV:
Join the points to form a quadrilateral.
A rectangle is formed as the opposite sides are equal to each other.