Go through the Math in Focus Grade 4 Workbook Answer Key Chapter 5 Practice 3 Stem-and-Leaf Plots to finish your assignments.
Math in Focus Grade 4 Chapter 5 Practice 3 Answer Key Stem-and-Leaf Plots
Complete. Use the data in the stem-and-leal plot.
Example
The stem-and-leaf plot shows 9 students’ grades on a math test.
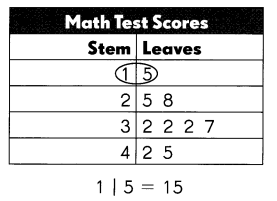
In a stem-and-leaf plot, the leaves are the ones digits and the stems are the digits to the left of the ones digit.

The stem 3 has 4 leaves.
The median, the middle score, is 32
The mode, the most frequent score, is 32
The range of the scores is 30
The outlier, the number farthest from the others, is 15
Complete. Use the data in the stem-and-leal plot.
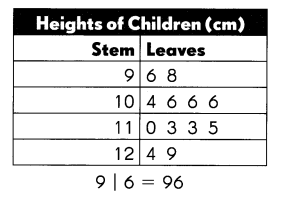
The stem-and-leaf plot shows the heights of 1 2 children in centimeters.
Question 1.
The stem 12 has ___ leaves.
Answer:
2 leaves.
Explanation:
The stem 12 has 2 leaves.
Question 2.
The height of the shortest child is ____ centimeters.
Answer:
96 centimeters.
Explanation:
The height of the shortest child is 96 centimeters.
Question 3.
10 | 4 stands for ___ centimeters, and 1 1 | 4 stands for ___ centimeters.
Answer:
104 cm and 114 cm.
Explanation:
10 | 4 stands for 104 centimeters, and 1 1 | 4 stands for 114 centimeters.
Question 4.
The median height of the children is ____ centimeters.
Answer:
The median height of the children is 106 centimeters.
Explanation:
The data is 96,93,104,106,106,106,110,113,113,115,124,129. To find the median we will arrange the numbers in order from least to greatest. The middle number or the mean of the two middle numbers is the median. The data set from least to greatest is 93,96,104,106,106,106,110,113,113,115,124,129. So the median will be
= \(\frac{106+110}{2}\)
= \(\frac{216}{2}\)
= 106.
So the median height of the children is 106 centimeters.
Question 5.
The mode of the set of data is ___ centimeters.
Answer:
The mode of the set of data is 106 centimeters.
Explanation:
To find the mode we will pick the number that appears most often is the mode and there can be more than one mode. So the mode is 106 cm.
Question 6.
The range of the heights is ____ centimeters.
Answer:
The range of the heights is 36 centimeters.
Explanation:
To find the range, we will find the difference between the greatest and the least number. So the range will be
= 129-93
= 36.
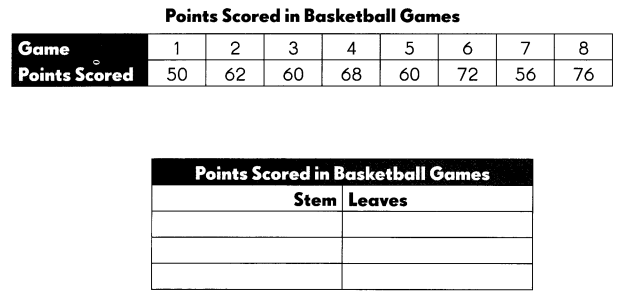
Make a stem-and-leaf plot to show the data.
The table shows the points scored by a school team in eight basketball games one season.

Complete. Use the data in the stem-and-leaf plot.
Question 7.
The stem 7 has ___ leaves.
Answer:
The stem 7 has 2 leaves.
Question 8.
The stem ___ has the greatest number of leaves.
Answer:
The stem 6 has the greatest number of leaves.
Question 9.
The median number of points scored is ____
Answer:
The median number of points scored is 64.
Explanation
Given the data is 50,66,60,60,62,68,72,76. Now we will arrange the numbers in order from least to greatest. The data will be 50,60,60,62,66,68,72,76. So the median will be
= \(\frac{62+66}{2}\)
= \(\frac{128}{2}\)
= 64.
Question 10.
The mode number of points scored is ___
Answer:
The mode number of points scored is 60.
Explanation:
The number that appears most often is the mode. So the mode will be 60.
Question 11.
The range of the set of data is ___
Answer:
The range of the set of data is 26.
Explanation:
To find the range we will find the difference between the greatest and the least number. So the range will be 76-50 which is 26.
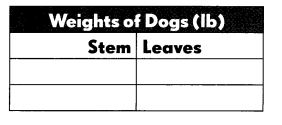
Make a stem-and-leaf plot to show the data.
Seven children weighed their dogs at a pet-care center.
15 lb, 12 lb, 17 lb, 15 lb, 21 lb, 17 lb, 15 lb
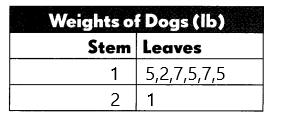
Complete. Use the data in the stem-and-leaf plot.
Question 12.
The weight of the heaviest dog is ___ pounds.
Answer:
The weight of the heaviest dog is 21 pounds.
Question 13.
The median weight of the dogs is ___ pounds.
Answer:
The median weight of the dogs is 15 pounds.
Explanation:
Given the data is 15 lb,12 lb,17 lb,15 lb,21 lb,17 lb,15 lb. Now we will arrange the numbers in order from least to greatest. The data will be 12 lb, 15 lb, 15 lb, 15 lb, 17 lb, 17 lb, 21 lb. So the median will be
= 15 lb.
Question 14.
The mode of the set of data is ___ pounds.
Answer:
The mode of the set of data is 15 pounds.
Explanation:
The number that appears most often is the mode. So the mode will be 15 pounds.
Question 15.
The range of the weight of the dogs is ___ pounds.
Answer:
The range of the weight of the dogs is 9 pounds.
Explanation:
To find the range we will find the difference between the greatest and the least number. So the range will be 21-12 which is 9.
Question 16.
___ of the dogs weigh less than 1 8 pounds.
Answer:
6 of the dogs weigh less than 18 pounds.
Question 17.
An eighth dog is weighed at the pet-care center. Its weight is 32 pounds. How would this change the stem-and-leaf plot? How would this change the median and mode?
Answer:
Explanation:
For 32 in the stem, we will place 3 and in the leaves, we will place 2. And the data will be 12 lb, 15 lb, 15 lb, 15 lb, 17 lb, 17 lb, 21 lb, 32 lb. So the median will be
= \(\frac{15+17}{2}\)
= \(\frac{32}{2}\)
= 16