Practice the problems of Math in Focus Grade 3 Workbook Answer Key Chapter 13 Bar Graphs and Plots to score better marks in the exam.
Math in Focus Grade 3 Chapter 13 Answer Key Bar Graphs and Plots
Math Journal
A survey was carried out to find the scores of students on a 20-minute math quiz.
Number of Questions Right
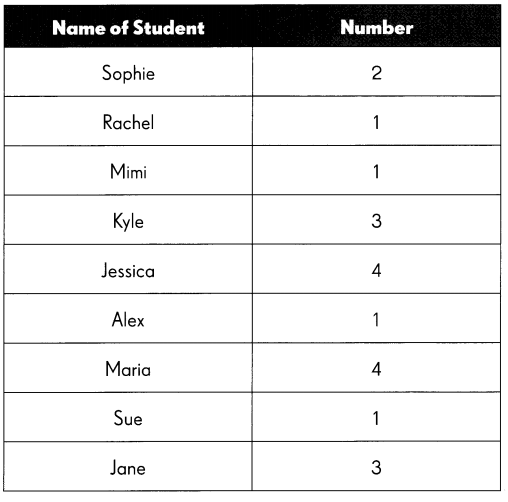
Work in groups to make a line plot. Use the data in the table. Follow the steps to help you.
Step 1: Give the line plot a title. Draw and label the horizontal number line.
Step 2: Draw an ✗ for each student above one number.
Step 3: Check that the number of ✗s shows the data in the table.
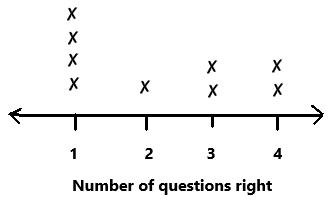
Answer:
Answer each question. Use the data in the line plot.
Question 1.
How did you get the least and greatest number on the number line?
Answer:
The least number is 1 and the greatest number is 4.
Question 2.
A survey asks 1 00 people how many children are in their families. All the people answer 0, 1, 2, 3, or 4. Would a line plot be a good way to show this data? Explain your thinking.
Answer:
The table shows the number of model trains that 8 children have. Choose which line plot matches the data.
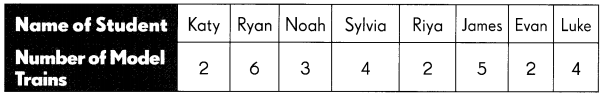
Fill in the blank. Use the data in the table.
Question 3.
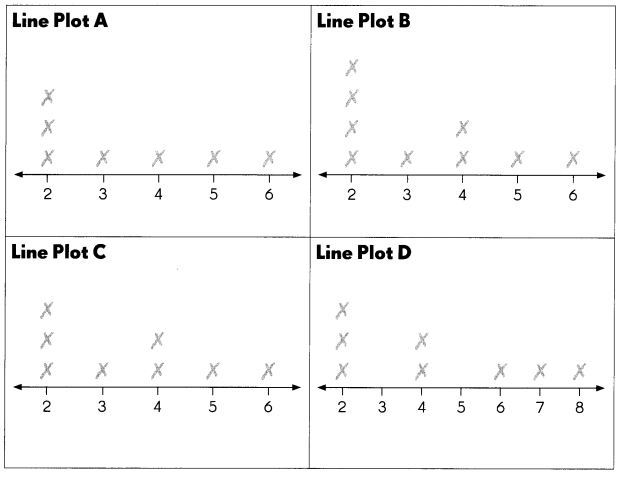
Line plot __________ matches the given data.
Answer:
Line plot C matches the given data.
Explain the mistakes in the other line plots.
Question 4.
Answer:
The mistake made in line plot A is we have to draw 2 ✗s to represent 2 children at number 4 in horizontal line. Where horizontal line represents number of model trains. But in line plot A we can observe only one ✗at number 4.
Question 5.
Answer:
The mistake made in line plot B is we have to draw 3 ✗s to represent 3 children at number 2 in horizontal line. Where horizontal line represents number of model trains. But in line plot B we can observe four ✗s at number 2.
Question 6.
Answer:
The mistake made in line plot D is we have to draw ✗ to represent 1 children at number 3 and draw ✗ to represent 1 children at number 5 in horizontal line. Where horizontal line represents number of model trains. But in line plot D we can observe ✗at number 7, ✗ at number 8 instead of number 3 and number 5.
Put On Your Thinking Cap!
Challenging Practice
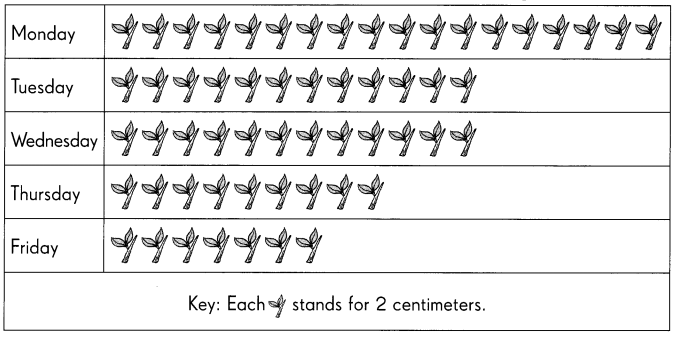
Pinocchio’s nose grew 2 centimeters longer every time he told a lie. He wanted to stop telling lies and be an honest boy. He drew a picture graph and a bar graph to check how many fewer lies he was telling every day.

The picture graph below and the bar graph on page 88 show the length his nose grew over five days.
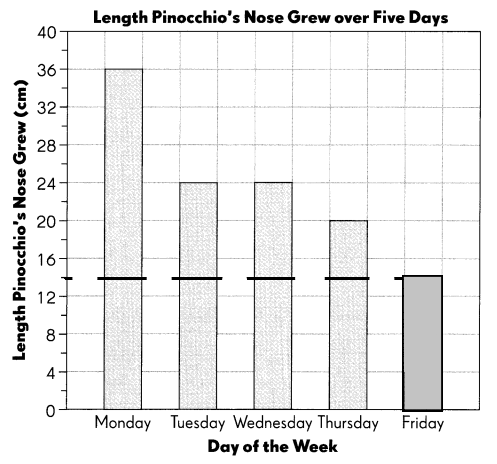
Length Pinocchio’s Nose Grew over Five Days
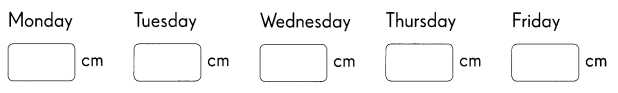
Use the information in the picture graph in above figure. Fill in the boxes to show the length his nose grew on…
Question 1.
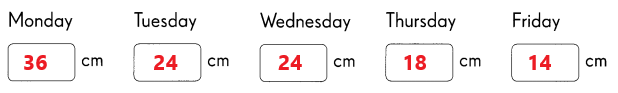
Answer:
Explanation:
Pinocchio’s nose grew 2 centimeters longer every time he told a lie. He wanted to stop telling lies and be an honest boy. He drew a picture graph to check how many fewer lies he was telling every day.
Monday:
18 x 2 cm = 36 cm
On Monday his nose grow 36 cm.
Tuesday:
12 x 2 cm = 24 cm
On Tuesday his nose grow 24 cm.
Wednesday:
12 x 2 cm = 24 cm
On Wednesday his nose grow 24 cm.
Thursday:
9 x 2 cm = 18 cm
On Thursday his nose grow18 cm.
Friday:
7 x 2 cm = 14 cm
On Friday his nose grow 14 cm.
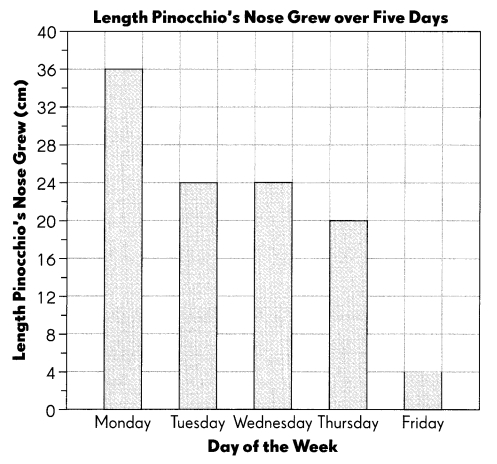
Complete the bar graph for Friday.
Question 2.
Answer:
Answer each question. Use the data in the bar graph.
Question 3.
On which day did his nose grow by 24 centimeters?
Answer:
On Tuesday and Wednesday his nose grow by 24 centimeters.
Question 4.
For which day is the bar graph incorrectly drawn?
Answer:
For Thursday the bar graph is incorrectly drawn.
Question 5.
How much longer does his nose grow on Tuesday than on Friday?
Answer:
On Tuesday his nose grow 24 cm long.
On Friday his nose grow 14 cm long.
24 – 14 = 10cm
His nose grow 10 cm longer on Tuesday than on Friday.
Put on Your Thinking Cap!
Problem Solving
Study each set of data carefully. Decide which graph would best represent each data.
Fill in the blanks with Picture Graph, Bar Graph, or Line Plot.
The table below shows the number of visitors at the art museum during six months. Erin wants to show the difference in the number of visitors for the months of February and April.
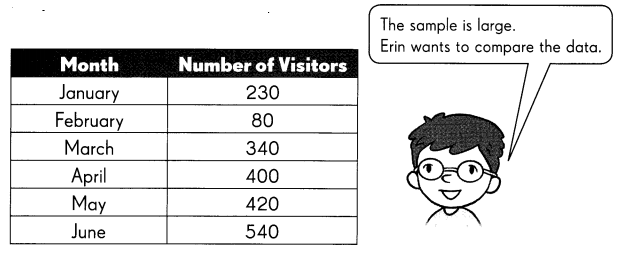
Answer:
Alisha wants to know which snack is most popular with third graders. She asks some of the third graders and records the data in this table.
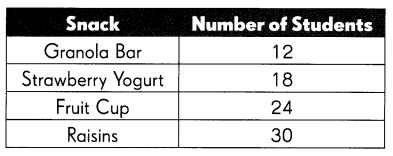
Answer:
A group of students took part in a math competition. At the end of the competition, Mr. Stephenson wanted to show how many games his students won. He recorded his findings in this table.
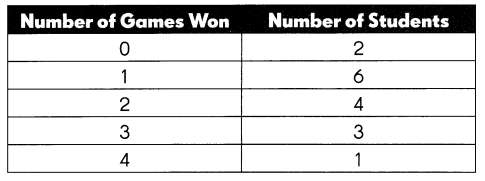
Answer: