Practice the problems of Math in Focus Grade 4 Workbook Answer Key Cumulative Review Chapters 5 and 6 to score better marks in the exam.
Math in Focus Grade 4 Cumulative Review Chapters 5 and 6 Answer Key
Concepts and Skills
Complete. Use the data in the table. (Lesson 5.1)
The ages of four cousins are shown.
8, 12, 10, 6
Question 1.
The sum of their ages is ___ years.
Answer:
Sum of their ages = 36 years.
Explanation:
The ages of four cousins are shown.
8, 12, 10, 6
Sum of their ages = 8 + 12 + 10 + 6
= 20 + 10 + 6
= 30 + 6
= 36 years.
Question 2.
The mean age of the cousins is ___ years.
Answer:
Mean age of their ages = 9 years.
Explanation:
The mean is the average of the numbers. It is easy to calculate: add up all the numbers, then divide by how many numbers there are.
Sum of their ages = 36 years.
Number of people = 4.
Mean age of their ages = Sum of their ages ÷ Number of people
= 36 ÷ 4
= 9 years.
Answer each question. Use the data in the line plot. (Lesson 5.2)
A group of hikers made a line plot to show the number of mountains they climbed. Each ✗ represents one hiker.
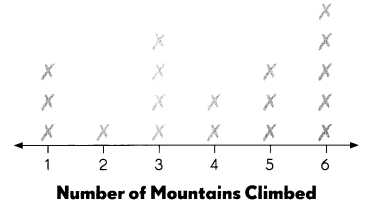
Question 3.
What is the median number of mountains climbed? ____
Answer:
Median number of mountains climbed = 4.
Explanation:
Number of mountain hikers = 1 1 1 2 3 3 3 3 4 4 5 5 5 6 6 6 6 6
Median number of mountains climbed = (4 + 4) ÷ 2
= 8 ÷ 2
= 4.
Question 4.
What is the range of the set of data? ____
Answer:
The range of the set of data = 1 to 6.
Explanation:
The range of a set of data is the difference between the highest and lowest values in the set.
Number of mountain hikers = 1 1 1 2 3 3 3 3 4 4 5 5 5 6 6 6 6
Question 5.
What is the mode of the set of data? ____
Answer:
The mode of the set of data = 6.
Explanation:
The mode is the value that appears most often in a set of data values.
1 mountain climbed by 3 people.
2 mountain climbed by 1 person.
3 mountain climbed by 4 people.
4 mountain climbed by 2 people.
5 mountain climbed by 3 people.
6 mountain climbed by 5 people.
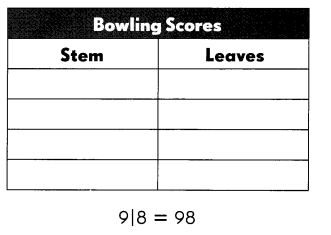
Make a stem-and-leaf plot to show the data. (Lesson 5.3)
Question 6.
A group of friends went bowling and recorded these scores.
75 73 79 84 98 64 84 67
Answer:
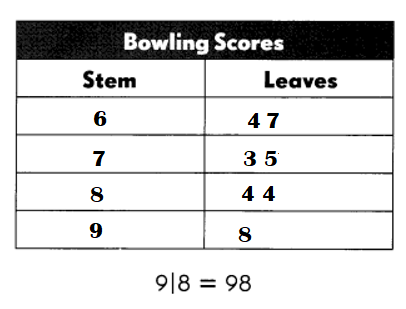
Explanation:
Arrange the scores given: 64 67 73 75 79 84 84 98.
To make a stem and leaf plot, each observed value must first be separated into its two parts:
- The stem is the first digit or digits;
- The leaf is the final digit of a value;
- Each stem can consist of any number of digits; but.
- Each leaf can have only a single digit.
Complete. Use the data in your stem-and-leaf plot.
Question 7.
____ is the mode.
Answer:
84 is the mode.
Explanation:
Scores given: 64 67 73 75 79 84 84 98.
64 – 1
67 – 1
73 – 1
75 – 1
79 – 1
84 – 2
98 – 1.
Question 8.
___ is the median.
Answer:
77 is the median.
Explanation:
Scores given: 64 67 73 75 79 84 84 98.
Median = (75 + 79) ÷ 2
= 154 ÷ 2
= 77.
Question 9.
___ is the range.
Answer:
64 to 98 is the range.
Explanation:
Scores given: 64 67 73 75 79 84 84 98.
Question 10.
___ is an outlier.
Answer:
84 to 98 is an outlier.
Explanation:
84 – 79 = 5.
73 – 67 = 6.
98 – 84 = 14.
Question 11.
How do the mode and median each change if you disregard the outlier?
Answer:
The effect of removing one outlier data point from the set. No matter what value we add to the set, the mean, median, and mode will shift by that amount but the range and the IQR will remain the same.
Explanation:
Outlier is an extreme value in a set of data which is much higher or lower than the other numbers. Outliers affect the mean value of the data but have little effect on the median or mode of a given set of data.
Write more likely, less likely, equally likely, certain, or impossible. (Lesson 5.4)
A bag has 8 blue marbles and 2 orange marbles. Describe the likelihood of each outcome.
Question 12.
An orange marble is chosen. _____
Answer:
Probability of orange marbles is chosen = 1 ÷ 5 or \(\frac{1}{5}\) .
Explanation:
Number of blue marbles = 8.
Number of orange marbles = 2.
Total marbles in bag = 8 + 2 = 10.
Probability of orange marbles is chosen = Number of orange marbles ÷ Total marbles in bag
= 2 ÷ 10
= 1 ÷ 5 or \(\frac{1}{5}\) .
Question 13.
A blue marble is chosen. ____
Answer:
Probability of blue marbles is chosen = 4 ÷ 5 or \(\frac{4}{5}\) .
Explanation:
Number of blue marbles = 8.
Number of orange marbles = 2.
Total marbles in bag = 8 + 2 = 10.
Probability of blue marbles is chosen = Number of blue marbles ÷ Total marbles in bag
= 8 ÷ 10
= 4 ÷ 5 or \(\frac{4}{5}\) .
Question 14.
A red marble is chosen. ____
Answer:
Probability of red marbles is chosen = 0.
Explanation:
Number of blue marbles = 8.
Number of orange marbles = 2.
Number of red marbles = 0.
Total marbles in bag = 8 + 2 = 10.
Probability of red marbles is chosen = Number of red marbles ÷ Total marbles in bag
= 0 ÷ 10
= 0.
Question 15.
A blue or an orange marble is chosen. ____
Answer:
Probability of orange or blue marbles is chosen = 1.
Explanation:
Number of blue marbles = 8.
Number of orange marbles = 2.
Total marbles in bag = 8 + 2 = 10.
Probability of blue marbles is chosen = Number of blue marbles ÷ Total marbles in bag
= 8 ÷ 10
= 4 ÷ 5 or \(\frac{4}{5}\) .
Probability of orange marbles is chosen = Number of orange marbles ÷ Total marbles in bag
= 2 ÷ 10
= 1 ÷ 5 or \(\frac{1}{5}\) .
Probability of orange or blue marbles is chosen = (Number of orange marbles + Number of blue marbles) ÷ Total marbles in bag)
= (8 + 2) ÷ 10
= 10÷ 10
= 1.
Solve. Use the scenario above. (Lesson 5.4)
Question 16.
How would you change the number of each colored marble in the bag so that it is more likely that an orange marble is chosen?
Answer:
Explanation:
Number of blue marbles = 8.
Number of orange marbles = 2.
Total marbles in bag = 8 + 2 = 10.
Look at the spinner. Write the probability of each outcome as a fraction. (Lesson 5.5)
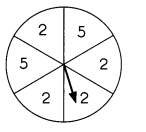
Question 17.
Probability of landing on 2 = ____
Answer:
Probability of landing on 2 = 2 ÷ 3 or \(\frac{2}{3}\)
Explanation:
Number of 2 on spinner = 4.
Total numbers on spinner = 6.
Probability of landing on 2 = Number of 2 on spinner ÷ Total numbers on spinner
= 4 ÷ 6
= 2 ÷ 3 or \(\frac{2}{3}\)
Question 18.
Probability of landing on 6 = ____
Answer:
Probability of landing on 6 = 0.
Explanation:
Number of 6 on spinner = 0.
Total numbers on spinner = 6.
Probability of landing on 6 = Number of 6 on spinner ÷ Total numbers on spinner
= 0 ÷ 6
= 0.
Add or subtract. Write each answer in simplest form. (Lessons 6.1 and 6.2)
Question 19.
\(\frac{3}{4}\) + \(\frac{1}{12}\) + \(\frac{1}{6}\) =
Answer:
\(\frac{3}{4}\) + \(\frac{1}{12}\) + \(\frac{1}{6}\) = \(\frac{11}{12}\)
Explanation:
\(\frac{3}{4}\) + \(\frac{1}{12}\) + \(\frac{1}{6}\) =
= [(9 + 1) ÷ 12] + \(\frac{1}{12}\)
= \(\frac{10}{12}\) + \(\frac{1}{12}\)
= (10 + 1) ÷ 12
= \(\frac{11}{12}\)
Question 20.
\(\frac{9}{10}\) – \(\frac{1}{5}\) – \(\frac{1}{2}\) =
Answer:
\(\frac{9}{10}\) – \(\frac{1}{5}\) – \(\frac{1}{2}\) = \(\frac{1}{5}\)
Explanation:
\(\frac{9}{10}\) – \(\frac{1}{5}\) – \(\frac{1}{2}\) =
= [(9 – 2) ÷ 10] – \(\frac{1}{2}\)
= \(\frac{7}{10}\) – \(\frac{1}{2}\)
= (7 – 5) ÷ 10
= 2 ÷ 10
= \(\frac{1}{5}\)
Write the amount of water in each set of 1-liter containers as a mixed number. (Lesson 6.3)
Question 21.
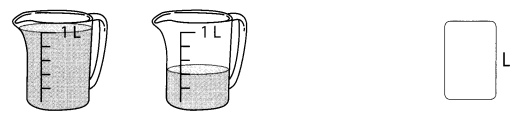
Answer:
Amount of 2 jars = 1 \(\frac{1}{5}\)L.
Explanation:
Amount of water in first jar = 1L.
Amount of water in second jar = \(\frac{1}{5}\)L.
Amount of 2 jars = Amount of water in first jar + Amount of water in second jar
= 1 + \(\frac{1}{5}\)
= (5 + 1) ÷ 5
= \(\frac{6}{5}\)
= 1 \(\frac{1}{5}\)L.
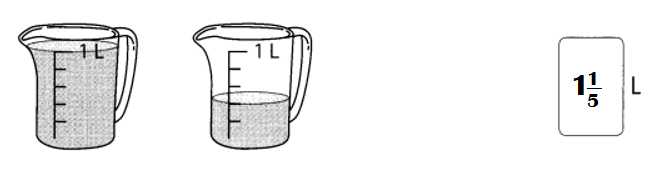
Question 22.
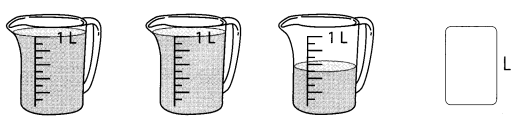
Answer:
Amount of three jars = 2\(\frac{1}{2}\)L.
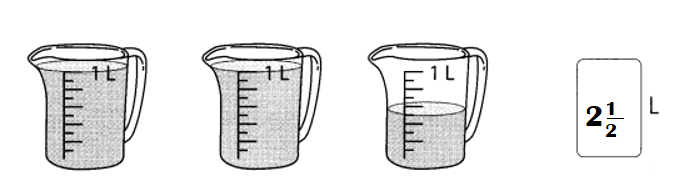
Explanation:
Amount of water in first jar = 1L.
Amount of water in second jar = 1L.
Amount of water in third jar = \(\frac{1}{2}\)L.
Amount of three jars = Amount of water in first jar + Amount of water in second jar + Amount of water in third jar
= 1 + 1 + \(\frac{1}{2}\)
= 2 + \(\frac{1}{2}\)
= (4 + 1) ÷ 2
= \(\frac{5}{2}\)
= 2\(\frac{1}{2}\)L.
Express the shaded part of each figure as a mixed number or an improper fraction. (Lessons 6.4 and 6.5)
Question 23.
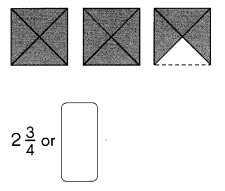
Answer:
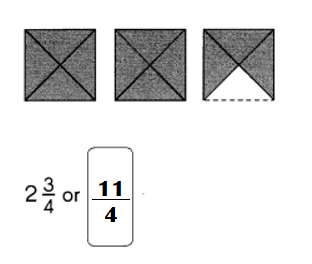
Explanation:
Mixed number of the shaded figure = 2\(\frac{3{4}\)
Improper fraction of the shaded figure = (8 + 3) ÷ 4
= 11 ÷ 4 or \(\frac{11}{4}\)
Question 24.
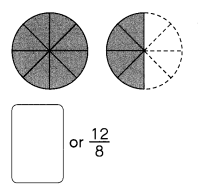
Answer:
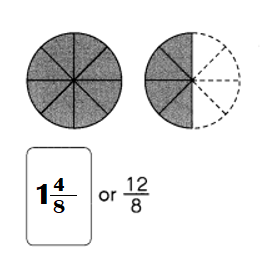
Explanation:
Improper fraction of the shaded figure = \(\frac{12}{8}\)
Mixed number of the shaded figure = \(\frac{12}{8}\)
= 1\(\frac{4}{8}\)
Express each improper fraction as a mixed number. (Lesson 6.5)
Question 25.
\(\frac{9}{7}\) = ____
Answer:
\(\frac{9}{7}\) = 1\(\frac{2}{7}\)
Explanation:
\(\frac{9}{7}\) = 1\(\frac{2}{7}\)
Question 26.
\(\frac{20}{9}\) = ____
Answer:
\(\frac{20}{9}\) = 2\(\frac{2}{9}\)
Explanation:
\(\frac{20}{9}\) = 2\(\frac{2}{9}\)
Express each mixed number as an improper fraction. (Lesson 6.5)
Question 27.
3\(\frac{2}{5}\) = ____
Answer:
3\(\frac{2}{5}\) = \(\frac{17}{5}\)
Explanation:
3\(\frac{2}{5}\) = (15 + 2 ) ÷ 5 = \(\frac{17}{5}\)
Question 28.
2\(\frac{8}{9}\) = ____
Answer:
2\(\frac{8}{9}\) = \(\frac{26}{9}\)
Explanation:
2\(\frac{8}{9}\) = (18 + 8) ÷ 9 = \(\frac{26}{9}\)
Add or subtract. (Lesson 6.6)
Question 29.
2 + \(\frac{2}{5}\) + \(\frac{1}{10}\) = ____
Answer:
2 + \(\frac{2}{5}\) + \(\frac{1}{10}\) = \(\frac{25}{10}\)
Explanation:
2 + \(\frac{2}{5}\) + \(\frac{1}{10}\) = ](10 + 2) 5] + \(\frac{1}{10}\)
= \(\frac{12}{5}\) + \(\frac{1}{10}\)
= (24 + 1) ÷ 10
= \(\frac{25}{10}\)
Question 30.
3 – \(\frac{3}{4}\) – \(\frac{5}{8}\) = ___
Answer:
3 – \(\frac{3}{4}\) – \(\frac{5}{8}\) = \(\frac{23}{8}\)
Explanation:
3 – \(\frac{3}{4}\) – \(\frac{5}{8}\) = 3 – [(6 – 5)÷ 8]
= 3 – \(\frac{1}{8}\)
= (24 – 1) ÷ 8
= \(\frac{23}{8}\)
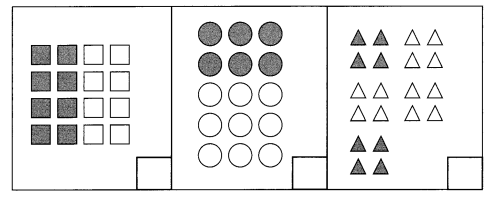
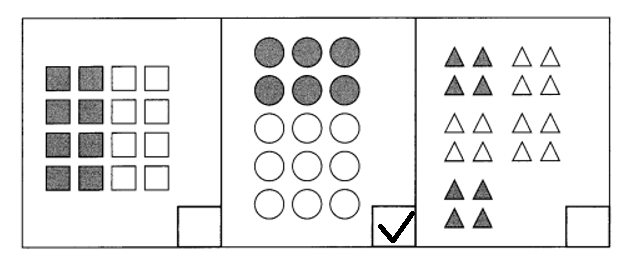
check (✓) each set in which \(\frac{2}{5}\) of the figures are shaded. (Lesson 6.7)
Question 31
Answer:
Explanation:
(✓) each set in which \(\frac{2}{5}\) of the figures are shaded.
Fraction of square figure = Number of shaded squares ÷ Total number of squares
= 8 ÷ 16
= 1 ÷ 2 or \(\frac{1}{2}\)
Fraction of circle figure = Number of shaded circles ÷ Total number of circles
= 6 ÷ 15
= 2 ÷ 5 or \(\frac{2}{5}\)
Fraction of triangle figure = Number of shaded triangles ÷ Total number of triangles
= 4 ÷ 20
= 1 ÷ 5 or \(\frac{1}{5}\)
Solve. (Lesson 6.7)
Question 32.
\(\frac{2}{3}\) of 15 = ___
Answer:
\(\frac{2}{3}\) of 15 = 10.
Explanation:
\(\frac{2}{3}\) of 15 = 2 ×5 = 10.
Question 33.
\(\frac{3}{5}\) of 40 = ___
Answer:
\(\frac{3}{5}\) of 40 = 24.
Explanation:
\(\frac{3}{5}\) of 40 = 3 × 8 = 24.
Problem Solving
Solve. Show your work.
Question 34.
Teams A, B, C, and D were in a tournament. The average score of the 4 teams was 92. Team A scored 78 points,
Team B scored 95 points, and Team C scored 88 points.
a. How many points did Team D score?
Answer:
Points Team D scored = 107.
Explanation:
Points Team A scored = 78.
Points Team B scored = 95.
Points Team C scored = 88.
Points Team D scored = ??.
The average score of the 4 teams was 92.
=> (Points Team A scored + Points Team B scored + Points Team C scored + Points Team D scored) ÷ 4 = 92.
=> (78 + 95 + 88 + ??) ÷ 4 = 92.
=> (173 + 88 + ??) ÷ 4 = 92.
=> (261 + ??) ÷ 4 = 92 × 4
=> 261 + ?? = 92 × 4
=> 261 + ?? = 368.
=> ?? = 368 – 261
=> ?? = 107.
Points Team D scored = 107.
b. Find the range of the scores. Hence, state the difference in score between the winning team and the losing team.
Answer:
Range of the scores = 78 to 107.
29 is the difference in score between the winning team and the losing team.
Explanation:
Scores scored by teams = 78 88 95 107.
Points Team A scored = 78.
Points Team B scored = 95.
Points Team C scored = 88.
Points Team D scored = 107.
Difference:
Highest score scored – Least score scored
= 107 – 78
= 29.
Losing team are Team A,B,C. Winning team is A.
Question 35.
Michael scored 15, 21, and 24 in the first three basketball games of the season.
a. What is his mean score?
Answer:
His mean score = 20.
Explanation:
Score scored by Michael in the first three basketball games of the season = 15, 21, 24.
The mean is the arithmetic average of a set of given numbers. The median is the middle score in a set of given numbers. The mode is the most frequently occurring score in a set of given numbers.
His mean score = score scored ÷ Number of games
= (15 + 21 + 24) ÷ 3
= (36 + 24) ÷ 3
= 60 ÷ 3
= 20.
b. What is the range of his scores?
Answer:
Range of his scores = 15 to 24.
Explanation:
Score scored by Michael in the first three basketball games of the season = 15, 21, 24.
Range of his scores = 15 to 24.
c. How many points must he score in the next game to achieve a mean score of 27?
Answer:
48 more points must he score in the next game to achieve a mean score of 27.
Explanation:
His mean score = score scored ÷ Number of games
=> 27 = (15 + 21 + 24 + ?? ) ÷ 4
=> 27 = (36 + 24 + ?? ) ÷ 4
=> 27 = (60 + ?? ) ÷ 4
=> 27 × 4 = 60 + ??
=> 108 – 60 = ??
=> 48 = ??.
Question 36.
Samuel and Kenneth collect sports cards. The average number of cards they have is 248. Samuel has 3 times as many cards as Kenneth. How many cards does each boy have?
Answer:
Number of sports cards Kenneth collected = 124.
Number of sports cards Samuel collected = 372.
Explanation:
Samuel has 3 times as many cards as Kenneth.
Let Number of sports cards Kenneth collected be X.
=> Number of sports cards Samuel collected = 3 × Number of sports cards Kenneth collected
= 3 × X = 3X.
The average number of cards they have is 248.
=> (Number of sports cards Samuel collected + Number of sports cards Kenneth collected) ÷ 2 = 248.
=> (3X + X) ÷ 2 = 248
=> 4X ÷ 2 = 248.
=> 4X = 248 × 2
=> 4X = 496.
=> X = 496 ÷ 4
=> X = 124.
Number of sports cards Samuel collected = 3X = 3 × 124 = 372.
Question 37.
A group of students made a list of the states where they were born. The line plot shows the number of times the letter A’ appears in the name of each state. Each ✗ represents one state.
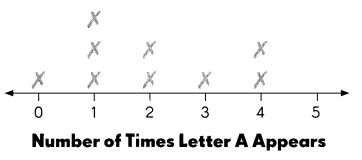
Complete. Use the data in the line plot.
a. What is the mode of the set of data? ____
Answer:
Mode of the set of data = 1.
Explanation:
Number of times A appears in states = 0 1 1 1 2 2 3 4 4
The mode is the most frequently occurring score in a set of given numbers.
Mode of the set of data = 1.
b. What is the mean number of times the letter A’ appears? ___
Answer:
Mean number of times the letter A’ appears = 2.
Explanation:
The mean is the arithmetic average of a set of given numbers.
Number of times A appears in states = 0 1 1 1 2 2 3 4 4
mean number of times the letter A’ appears = (0 + 1 + 1 + 1 + 2 + 2 + 3 + 4 + 4) ÷ 9
= 18 ÷ 9
= 2.
c. Is the name of a state more likely to have 1 or 2 As? Explain your answer.
Answer:
Yes, the state going to have more likely 2As because mean number of times the letter A’ appears = 2.
Explanation:
Yes state is going to have 2 As because average letters in the states name going to be 2 that menas in their names 2As are likely to be.
d. According to the data, what is less likely to happen? Explain your answer.
Answer:
According to the data, its less likely to happen that minimum As likely to be 1 and maximum 2 As in every name of state not more.
Explanation:
Well, its less likely to happen that minimum As likely to be 1 and maximum 2 As in every name of state not more.
Question 38.
The stem-and-leaf plot shows the number of pages in 8 books.
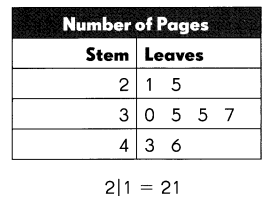
a. Which stem has only odd numbers for its leaves?
Answer:
Stem 3 is having only odd numbers for its leaves.
Explanation:
All the numbers ending with 1,3,5,7 and 9 are odd numbers. For example, numbers such as 11, 23, 35, 47 etc.
Stem 2 – 1 5
Stem 3 – 0 5 5 7.
Stem 4 – 3 6.
b. Find the median of the set of data.
Answer:
Median of set = 35.
Explanation:
Number of pages = 21, 25, 30, 35, 35, 37, 43, 46.
Median of set = (35 + 35) ÷ 2
= 70 ÷ 2
= 35.
c. Find the mode of the set of data. ___
Answer:
Mode of the set of data = 35.
Explanation:
The mode is the value that appears most often in a set of data values.
Number of pages = 21, 25, 30, 35, 35, 37, 43, 46.
21 – 1 time.
25 – 1 time.
30 – 1 time.
35 – 2 time.
37 – 1 time.
43 – 1 time.
46 – 1 time.
d. Find the range of the set of data. ____
Answer:
Range of the set of data – 21 to 46.
Explanation:
Number of pages = 21, 25, 30, 35, 35, 37, 43, 46.
e. Which of the above measures tells you the difference in the number of pages between the thickest and the thinnest books? ___
Answer:
Range of the set of data above measures tells you the difference in the number of pages between the thickest and the thinnest books.
Explanation:
Range of the set of data above measures tells you the difference in the number of pages between the thickest and the thinnest books.
f. Is there an outlier in the set of data? Explain your answer. ___
Answer:
No, there is no outlier in the set of data because there is no much difference in the data measurements.
Explanation:
There is no outlier in the set of data because there is no much difference in the data measurements.
Question 39.
A cube is numbered from 1 to 6 and tossed once. What is the probability of tossing
a. a 5 or a 6? ___
Answer:
Probability of tossing 5 = 1 ÷ 6 or \(\frac{1}{6}\)
Probability of tossing 6 = 1 ÷ 6 or \(\frac{1}{6}\)
Explanation:
A cube is numbered from 1 to 6 and tossed once.
Total numbers on cube = 6.
Probability of tossing 5 = Number of 5 side ÷ Total numbers on cube
= 1 ÷ 6 or \(\frac{1}{6}\)
Probability of tossing 6 = Number of 6 side ÷ Total numbers on cube
= 1 ÷ 6 or \(\frac{1}{6}\)
b. an odd number? ___
Answer:
Probability of odd number = 1 ÷ 2 or \(\frac{1}{2}\)
Explanation:
odd number on cube = 1, 3 , 5.
Total numbers on cube = 6.
Probability of odd number = odd number on cube ÷ Total numbers on cube
= 3 ÷ 6
= 1 ÷ 2 or \(\frac{1}{2}\)
Question 40.
Sasha has 40 stamps in her collection. 12 of them are from foreign countries.
a. What fraction of the stamps are foreign stamps?
Answer:
Fraction of the stamps are foreign stamps = 3 ÷ 10 or \(\frac{3}{10}\)
Explanation:
Number of stamps in her collection Sasha has = 40.
Number of stamps of them are from foreign countries = 12.
Fraction of the stamps are foreign stamps = Number of stamps of them are from foreign countries ÷ Number of stamps in her collection Sasha has
= 12 ÷ 40
= 3 ÷ 10 or \(\frac{3}{10}\)
b. What fraction of the stamps are U.S. stamps?
Answer:
3 ÷ 10 or \(\frac{3}{10}\) are fraction of the stamps are U.S. stamps.
Explanation:
Fraction of the stamps are U.S. stamps = Number of stamps of them are from U.S. countries ÷ Number of stamps in her collection Sasha has
= 12 ÷ 40
= 3 ÷ 10 or \(\frac{3}{10}\)
Question 41.
A string is 1 foot long. Blake cuts What fraction of the string is left?
Answer:
Explanation:
Length of the string = 1 foot.
Question 42.
Pedro scored \(\frac{1}{4}\) of all the goals scored during a soccer game. He scored 2 goals. How many goals were not scored by Pedro?
Answer:
Number of goals were not scored by Pedro = 6.
Explanation:
Points scored by Pedro \(\frac{1}{4}\) of all the goals scored during a soccer game.
Let all goals be X.
Points soccer game scored = X × \(\frac{1}{4}\) = 2.
=> X = 2 × 4
=> X = 8.
Points Pedro scored = 2.
Number of goals were not scored by Pedro = Points soccer game scored – Points Pedro scored
= 8 – 2
= 6.
Must Follow: