Go through the Math in Focus Grade 4 Workbook Answer Key Chapter 5 Practice 2 Median, Mode, and Range to finish your assignments.
Math in Focus Grade 4 Chapter 5 Practice 2 Answer Key Median, Mode, and Range
Find the median, mode, and range.
Example
4, 6, 5, 6, 8, 8, 10, 8
Find the median.
Arrange the numbers in order from least to greatest. The middle number or the mean of the two middle numbers is the median.
Since there are two middle numbers, 6 and 8, find the mean of the two numbers.
The median of the data set is \(\frac{6+8}{2}\) = \(\frac{14}{2}\) = 7
Find the mode.
The number that appears most often is the mode. There can be more than one mode, If all the numbers appear the same number of times, there is no mode.
Find the range.
4, 5, 6, 6, 8, 8, 8, 10
Range = 10 – 4
= 6
The range of the data set is 6.
The difference between the greatest and the least number is the range.
Find the median, mode, and range of each set of data.
Question 1.
50, 52, 58, 50, 47, 43, 52, 60, 49, 52
Median:
Mode:
Range:
Answer:
Median: 51
Mode: 52
Range: 17.
Explanation:
Given the data set is 50, 52, 58, 50, 47, 43, 52, 60, 49, 52. So to find the median we will arrange the numbers in order from least to greatest. The middle number or the mean of the two middle numbers is the median. So the numbers in order from least to greatest are 43,47,49,50,50,52,52,52,58,60. The middle numbers are 50 and 52, so the median is
Median = \(\frac{50+52}{2}\)
= \(\frac{102}{2}\)
= 51.
To find the mode we will pick the number that appears most often is the mode and there can be more than one mode, If all the numbers appear the same number of times, there is no mode. So here the mode will be 52.
To find the range, we will find the difference between the greatest and the least number.
So the range is 60-43 which is 17.
Question 2.
15 in., 18 in., 12 in., 14 in., 30 in., 15 in., 15 in.
Median:
Mode:
Range:
Answer:
Median: 15 in.
Mode: 15 in.
Range: 18 in.
Explanation:
Given the data set is 15 in., 18 in., 12 in., 14 in., 30 in., 15 in., 15 in.. So to find the median we will arrange the numbers in order from least to greatest. The middle number or the mean of the two middle numbers is the median. So the numbers in order from least to greatest are 12 in., 14 in., 15 in.,15 in.,15 in.,18 in.,30 in. The middle numbers are 50 and 52, so the median is
Median = 15 in.
To find the mode we will pick the number that appears most often is the mode and there can be more than one mode, If all the numbers appear the same number of times, there is no mode. So here the mode will be 15.
To find the range, we will find the difference between the greatest and the least number.
So the range is 30-12 which is 18 in.
Question 3.
9 lb, 11lb, 14 lb, 20 lb, 14 lb, 20 lb, 14 lb, 20 lb
Median:
Mode:
Range:
Answer:
Median: 15 in.
Mode: 15 in.
Range: 18 in.
Explanation:
Given the data set is 9 lb, 11lb, 14 lb, 20 lb, 14 lb, 20 lb, 14 lb, 20 lb. So to find the median we will arrange the numbers in order from least to greatest. The middle number or the mean of the two middle numbers is the median. So the numbers in order from least to greatest are 12 in., 14 in., 15 in.,15 in.,15 in.,18 in.,30 in. The middle numbers are 50 and 52, so the median is
Median = 15 in.
To find the mode we will pick the number that appears most often is the mode and there can be more than one mode, If all the numbers appear the same number of times, there is no mode. So here the mode will be 15.
To find the range, we will find the difference between the greatest and the least number.
So the range is 30-12 which is 18 in.
Example
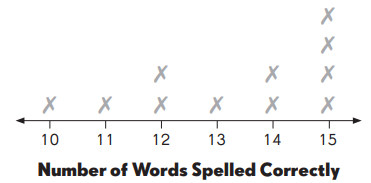
The line plot shows the number of words spelled correctly by each contestant in a spelling bee. Each ✗represents one contestant.
Number of Words Spelled Correctly
An ✗ above 15 on the number line represents a contestant who spelled 15 words correctly.
Complete. Use the data in the line plot.
____ contestants took part in the spelling bee.
The median number of words spelled correctly is 14
The number of contestants who spelled the greatest number of words correctly is 4
The mode of the set of data is 15 words.
The difference between the greatest and the least number of words spelled correctly is 5
Answer:
11 contestants took part in the spelling bee.
Explanation:
Here, 11 contestants took part in the spelling bee.
The data will be 10,11,12,12,13,14,14,15,15,15,15.
Make a line plot to show the data.
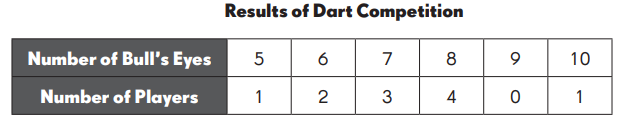
The table shows the number of bull’s eyes each player scored out of 10 shots in a dart competition.
Complete. Use the data in your line plot.
Question 4.
The median number of bull’s eyes scored is ____
Answer:
The median number of bull’s eyes scored is 1.5.
Explanation:
The median number of bull’s eyes scored is, here we will arrange the numbers in order from least to greatest. The middle number or the mean of the two middle numbers is the median. So the numbers in order from least to greatest are 0,1,1,2,3,4. The median number is
= \(\frac{1+2}{2}\)
= \(\frac{3}{2}\)
= 1.5.
Question 5.
There are ___ players altogether.
Answer:
There are 11 players.
Explanation:
The number of players are 0+1+1+2+3+4 which is 11 players.
Question 6.
The number of bull’s eyes that was scored the most is ___
Answer:
The number of bull’s eyes that was scored the most is 8.
Question 7.
The range of the set of data is ___
Answer:
The range of the set of data is 4.
Explanation:
To find the range, we will find the difference between the greatest and the least number.
So the range is 4-0 which is 4.
Question 8.
____ players scored 7 bull’s eyes, and the winner scored
___ bull’s eyes.
Answer:
3 players scored 7 bull’s eyes, and the winner scored 4 bull’s eyes.
Complete the table based on the information given.
A number cube has six faces numbered 1 to 6. John tossed two number cubes several times and added the numbers each time.
Complete. Use the data in the table.
Question 9.
John threw the two number cubes ____ times altogether.
Answer:
Question 10.
Make a line plot to show the total for each toss.
Answer:
Question 11.
The median of the set of data is _____
Answer:
Question 12.
The mode of the set of data is ______
Answer:
Question 13.
The range of the set of data is ____
Answer:
Find the mean of each set of data.
Example
Haley made a line plot to show the number of points she scored in a computer math game over three weeks.
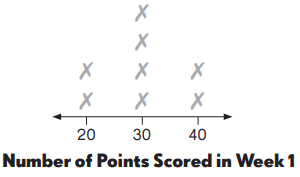
20 points × 2 times = 40
30 points × 4 times = 120
40 points × 2 times = 80
Haley’s mean score for each game in Week 1 is 30 points.
Question 14.
15 points × ____ time(s) = ___
20 points × ____ time(s) = ___
25 points × ____ time(s) = ___
30 points × ____ time(s) = ___
35 points × ____ time(s) = ___
Mean = ___
= ____ = _____
Haley’s mean score for each game in Week 2 is ___ points.
Answer:
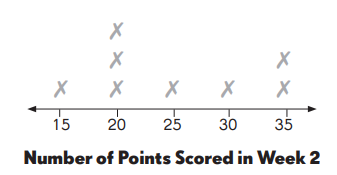
Haley’s mean score for each game in Week 2 is 25 points.
Explanation:
Haley’s mean score for each game in Week 2 is 1,3,1,1,2
15 points × 1 time(s) = 15
20 points × 3 time(s) = 60
25 points × 1 time(s) = 25
30 points × 1 time(s) = 30
35 points × 2 time(s) = 70
Here, the mean is 25.
Haley’s mean score for each game in Week 2 is 25 points.
Find the mean of the set of data.
Question 15.
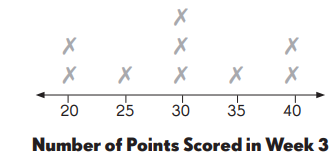
20 points × ____ time(s) = ___
25 points × ____ time(s) = ___
30 points × ____ time(s) = ___
35 points × ____ time(s) = ___
40 points × ____ time(s) = ___
Mean = ___
= ____ = _____
Haley’s mean score for each game in Week 3 is ___ points.
Answer:
Haley’s mean score for each game in Week 3 is 60 points.
Explanation:
20 points × 2 time(s) = 40
25 points × 1 time(s) = 25
30 points × 3 time(s) = 60
35 points × 1 time(s) = 35
40 points × 2 time(s) = 80
Haley’s mean score for each game in Week 3 is 60 points.
Question 16.
Compare the line plots for Weeks 2 and 3. Can you tell which data set has a greater mean just by looking at the line plots? What part of the line plot makes you think that?
Answer:
Week 3 has a greater mean.
Explanation:
The mean for week 2 is 25 points and the mean for week 3 is 60 points. So week 3 has a greater mean.