Practice the problems of Math in Focus Grade 3 Workbook Answer Key Chapter 13 Practice 3 Line Plots to score better marks in the exam.
Math in Focus Grade 3 Chapter 13 Practice 3 Answer Key Line Plots
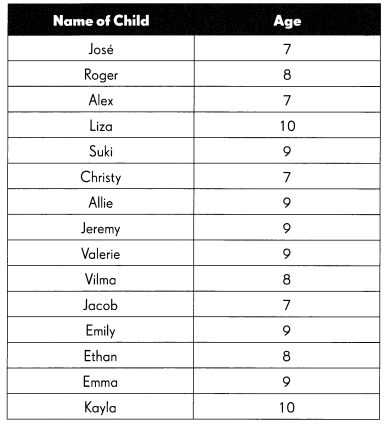
Amanda surveyed a group of children in a Nature Club to find out their ages. The table below shows the results of her survey.
Ages of Children in Years
Amanda made a line plot to show the results of her survey.
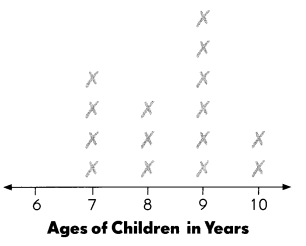
Answer each question. Use the data in the line plot.
Question 1.
What does each ✗ on the line plot stand for? __________
Answer:
Each ✗ on the line plot stand for number of children.
Question 2.
What do the numbers on the number line stand for? __________
Answer:
The numbers on the number line stand for Ages of children in years.
Question 3.
What is the age of the greatest number of children?
___________ years old
Answer:
9 years old is the age of the greatest number of children.
Question 4.
How many children are aged 6?
__________ children
Answer:
Zero children are aged 6.
Question 5.
What is the age of the oldest child surveyed?
_________ years
Answer:
10 years is the age of the oldest child surveyed.
Question 6.
How many children were surveyed in all?
___________ children

Answer:
15 children were surveyed in all.
Third graders carried out a survey. They wanted to find the number of children in each of their families. They displayed their results in this line plot.
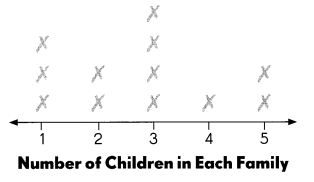
Answer each question. Use the data in the line plot.
Question 7.
What does each ✗ on the line plot stand for? __________
Answer:
Each ✗ on the line plot stand for families.
Question 8.
What do the numbers on the number line stand for? __________
Answer:
The numbers on the number line stand for number of children in each family.
Question 9.
How many families have 2 children?
__________ families
Answer:
2 families have 2 children.
Question 10.
How many families have fewer than 4 children?
___________ families
Answer:
9 families have fewer than 4 children.
Question 11.
What is the greatest number of children in the families surveyed?
____________ children
Answer:
5 children is the greatest number of children in the families surveyed.
Question 12.
How many families took part in the survey?
________ families
Answer:
12 families took part in the survey.
Question 13.
Did all the families surveyed have children? Answer yes or no. ___________

Answer:
Yes, all the families surveyed have children.
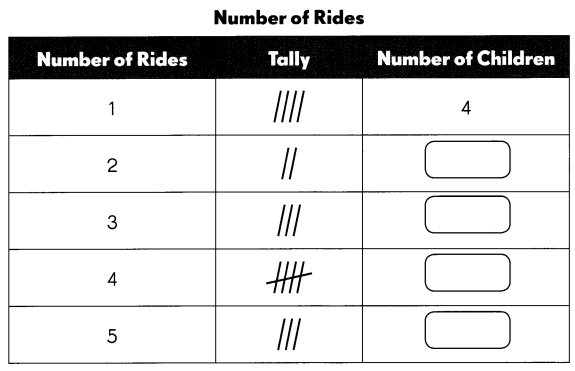
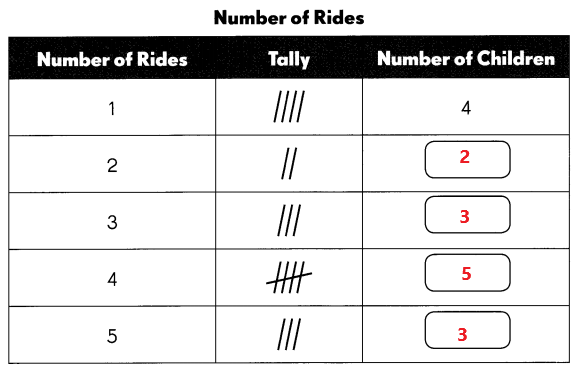
A survey was carried out to find the number of rides a group of children took at Happy Theme Park. The tally chart shows the results of the survey.
Complete the tally chart.
Question 14.
Answer:
Complete the line plot. Use the data in the tally chart.
Question 15.
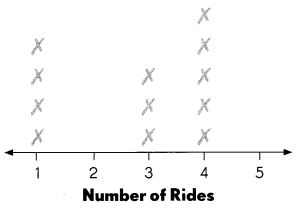
Answer:
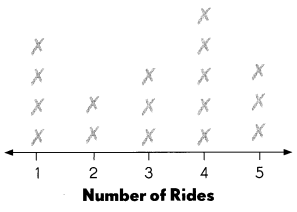
Answer each question. Use the data in the line plot.
Question 16.
What does each ✗ on the line plot stand for? _____________
Answer:
Each ✗ on the line plot stand for number of children.
Question 17.
What does each number on the number line stand for?__________
Answer:
Each number on the number line stand for number of rides.
Question 18.
How many children take 5 rides?
__________ children
Answer:
3 children took 5 rides.
Question 19.
How many children take 4 or more rides?
__________ children
Answer:
5 children take 4 rides.
3 children take 5 rides.
5 + 3 = 8
8 children took 4 or more rides.
Question 20.
Which number of rides are taken by the same number of children?
Answer:
3 children take 3 rides.
3 children take 5 rides.
3 rides and 5 rides are taken by the same number of children.
A baseball team counted the number of home runs each player hit. The results are shown in this table.
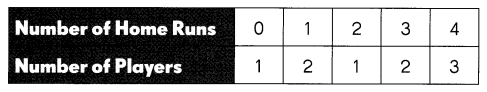
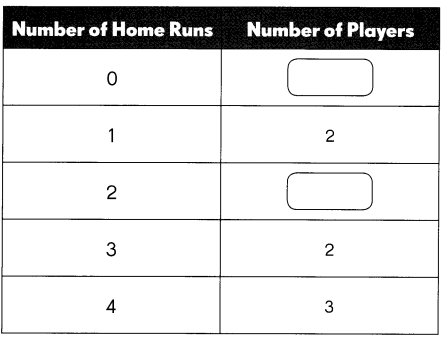
Complete the table.
Question 21.
Number of Home Runs
Answer:
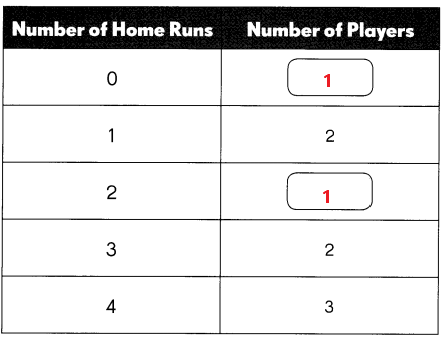
Fill in the blanks. Use the data in the table.
Question 22.
The greatest number of home runs hit by any player was ___________.
Answer:
The greatest number of home runs hit by any player was 4.
Question 23.
The least number of home runs hit by any player was ____________.
Answer:
The least number of home runs hit by any player was 0.
Complete the line plot. Use the data in the table.
Question 24.
Answer:
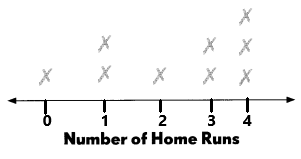
Answer each question. Use the data in the line plot.
Question 25.
What does each ✗ on the line plot stand for? ____________
Answer:
Each ✗ on the line plot stand for number of players.
Question 26.
How many players had 2 home runs?
__________ player
Answer:
1 player had 2 home runs.
Question 27.
How many players had more than 1 home run?
__________ players
Answer:
6 players had more than 1 home run.
Question 28.
What is the greatest number of home runs scored by a single player?
__________ home runs
Answer:
2 home runs scored by a single player.
Question 29.
How many players were surveyed in total?
___________ players
Answer:
9 players were surveyed in total.
Tom carried out a survey to find how many raisins there are in boxes of different brands. He made a line plot to show the results of his survey.
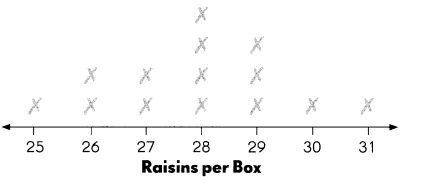
Answer each question. Use the data in the line plot.
Question 30.
What is the least number of raisins in a box?
___________ raisins
Answer:
25 raisins is the least number of raisins in a box.
Question 31.
What is the greatest number of raisins in a box?
__________ raisins
Answer:
31 raisins is the greatest number of raisins in a box.
Question 32.
Which number of raisins occurs most often?
_____________ raisins
Answer:
28 raisins occurs most often.
Question 33.
How many boxes contain 28 or more raisins?
_____________ boxes
Answer:
9 boxes contains 28 or more raisins.
Question 34.
How many boxes contain fewer than 27 raisins?
_____________ boxes
Answer:
3 boxes contains fewer than 27 raisins.
Question 35.
How many boxes were used in the survey in all?
___________ boxes
Answer:
14 boxes were used in the survey in all.